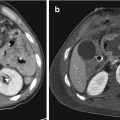
Fig. 5.1
Lumbar and thoracic fractures by axial loading injury mechanism (dashed open arrows): potential and limitation of radiography (two different patients). In both patients, radiographs (a, c) clearly show the reduction in height of the vertebral body, resulting from the axial loading injury mechanism. Source axial and 2-D reformatted sagittal CT images (b, d) did not show fracture line extending to posterior somatic wall in one patient, (a, b)while in the other one (c, d) clearly show that the fracture line involves the posterior somatic wall (solid arrows), thus reclassifying the L4 fracture as a burst one

Fig. 5.2
Cervical spine ligamentous injury by anterior flexion distraction injury mechanism: potential of radiography. Lateral view of the cervical spine shows anteriorly concave with fulcrum at C4-C5 level anterior vertebral or marginal (a) and posterior vertebral or marginal (b) lines, straight spinolaminar (c) and posterior spinous (d) lines, as well as the increase of the C4-C5 interarticular and interpinous (asterisk) spaces, from anterior flexion distraction injury mechanism (dashed open arrow). The low ratio between anteroposterior diameters of the spinal canal (dashed line) and vertebral body (continuous line), i.e., the Torg-Pavlov ratio, indicating a congenital stenosis of the cervical spinal canal. Intervertebral spaces are normally symmetric. Prevertebral soft tissues, i.e., nasopharyngeal (single arrowhead), retropharyngeal (double arrowhead), and pretracheal (triple arrowhead) spaces, are normal. These findings required prompt CT scan (not shown) for complete evaluation of posttraumatic scenario
However, despite its diagnostic potential, technical limitations of radiography in depicting the highly complex anatomy of the spine are well known, above all in the craniocervical junction, cervicothoracic junction (Fig. 5.3), and thoracic spine, as well as in the presence of associated spinal diseases, mostly in elderly patients (Fig. 5.3). Notably, studies have shown that radiography has only 30–60% sensitivity in evaluating fractures and ligamentous injuries [18, 30, 44]. The rate of missed cervical spine injuries by conventional radiography is high: in a retrospective evaluation of 800 patients with polytrauma, CT identified fractures with a sensitivity of 98.5%, compared with a sensitivity of 43% for radiography [34]. Clear visualization of the cervicothoracic junction is mandatory as a fracture of C7 (Figs. 5.3 and 5.4) or a fracture or dislocation of C7-T1 (Fig. 5.5) accounts for nearly 17% of cervical spine injuries [14]. This explains the frequent need of CT (Figs. 5.3, 5.4, and 5.5) and/or MRI (Fig. 5.5). In pediatric patients, diagnostic imaging of spinal injury, especially the cervical one, remains a difficult issue. Clinical assessment is essential, and it has been proposed to use radiography more selectively, i.e., by a single lateral view. However, since every effort should be made to rule out a potentially devastating injury, doubtful cases need to be followed by cross-sectional imaging [50].


Fig. 5.3
C6 and C7 fracture dislocation and subluxation by translational injury mechanism in an elderly patient with degenerative spinal disease: potential and limitation of radiography. Anteroposterior, lateral, and open-mouth views (a) show an avulsion fracture of the C6 spinous process (long white arrow) and a fracture line in the peduncular area of C7 (arrowhead). Only right- and left-side 2D-reformatted sagittal and source axial CT images (b) allow the identification of both C7 pedicles fracture lines (short white arrows), and C6-C7 facet joints right dislocation (white arrowhead) and left subluxation from translational injury mechanism (dashed open arrow). Note also a thin posterior epidural hematoma (black arrows). MRI (not shown) did not add further significant information
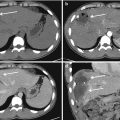
Fig. 5.4
C7 fracture: nonconsecutive right to left 2D-reformatted sagittal (a) and source axial (b) CT images at admission show thin fracture lines in both the posterior hemiarches and in the posterior third of the vertebral body; C6-C7 interspinous space is not clearly enlarged. Despite appropriate immobilization, 10 days later similar CT images (c, d) show clear-cut diastasis of the bony fragments in both the C7 vertebral body (black arrows) and the posterior hemiarches (white arrows) incipient kyphosis and C6-C7 interspinous space enlargement (arrowhead)
Fig. 5.5
C7-T1 severe fracture-dislocation and spinal cord transection: 2D-reformatted sagittal and source axial CT images (a), and T1- and T2-weighted sagittal MR images (b). CT clearly shows the bilateral interfacetal dislocation resulting from translational injury (dashed open arrow). Despite poor quality due to cervical collar and spinal longboard, MRI shows a spinal cord divided into a cranial and caudal portion (solid arrow). At C7-T1 level, the disconnection of flavum, interspinous, and supraspinous ligaments are obviously evident. Asterisk indicates a hemorrhagic prevertebral collection resulting from anterior longitudinal ligament tear
Thus, radiography is indicated in conscious adult patients, without radiculo-medullary symptoms, but still at risk of spinal injury after a low-energy trauma. On the other side, radiography should not be used as a first-line diagnostic procedure in adult patients unconscious, or with radiculo-medullary symptoms, after major trauma, who represent indications to CT and/or MRI.
5.2.2 Computed Tomography
CT is significantly superior to radiography in terms of sensitivity, specificity, and diagnostic accuracy (Figs. 5.1 and 5.3). Axial, multiplanar 2D-, and 3D-reformatted CT images are the optimal tools to show the more complex anatomic regions of the spine, such as craniocervical (Fig. 5.6), cervicothoracic, and thoracolumbar junctions, as well as the classical anatomical model of the “three columns” of Denis [5] of the thoracic and lumbar spine (Fig. 5.7a), as well as the anatomic model of the “four columns” of the subaxial cervical spine (Fig. 5.7b) for the Cervical Spine Injury Severity Score [33]. CT may confirm the diagnosis of compression fracture at radiography or reclassify the lesion as a burst fracture (Fig. 5.1), with possible impact on the management plan. Similarly, only CT defines with certainty the fracture lines involving bone and joint components of the lateral arches (Figs. 5.3 and 5.4). Surely, CT is the best technique for the recognition of vertebral bony portions and fragments (Fig. 5.8), as well air or gas, which may not be recognized or wrongly interpreted as bone by MRI. Notably, also thanks to multislice technique and providing the most accurate assessment of the fine anatomy of the osseous spine, CT allows the identification of indirect signs of discoligamentous or capsular injury, sometimes hardly recognizable in lateral view radiographs, although CT analysis of the soft tissues is less accurate than that directly provided by MRI (Figs. 5.8, 5.9, 5.10, and 5.11) [9, 16, 20]. These reasons explain why CT is now considered the first-line procedure in polytrauma patients who however require CT of the head, chest, abdomen, and pelvis to rule out intracranial and visceral injuries.


Fig. 5.6
Potential of CT in depicting the normal anatomy of the craniocervical junction: nonconsecutive right to left 2D-reformatted sagittal (a), 2D-reformatted coronal (b), and source axial (c) CT images. Long arrows indicate normal relationship of the joints between occipital condyles and C1 lateral masses, i.e., the occipitoatlantal joints, which show close apposition and almost equidistant space along their extent. 2D-reformatted midsagittal image shows the atlantodental (white dots) and basion-dens (continuous short line) spaces, the posterior axial line (continuous long line), the basion to posterior axial line distance (dashed line), and the C1–C2 interspinous distance (dotted line). Black dots indicate laterodental spaces. Powers ratio measures the relationship between the foramen magnum and the atlas, by the ratio between the lines from the basion (B) to the posterior spinolaminar line of the atlas (C) and the line between the anterior arch of the atlas (A) and the opisthion (O) in the midsagittal plane, i.e., BC/AO. The McGregor line (not shown), i.e., a modification of the Chamberlain line, connects the posterior edge of the hard palate to the most caudal point of the occipital curve. When the odontoid process lies more than 4.5 mm above the McGregor line, this is defined basilar invagination
Fig. 5.7
Potential of CT images in depicting the “three-column” model of Denis of the thoracic and lumbar spine (a), and the “four-column” model of the cervical spine (b). In the thoracic spine (a), a 2D-reformatted sagittal CT image shows the anterior column (A) formed by the anterior longitudinal ligament and the anterior (two-thirds) of the vertebral body and intervertebral disc, the middle column (M) formed by the posterior (one-third) of the vertebral body and intervertebral disc and posterior longitudinal ligament, and the posterior column (P) formed by the structures which are posterior to the posterior longitudinal ligament including pedicles, laminae, articular processes and facet joints, flavum ligaments, i.e., neural arch and interconnecting ligaments. In the cervical spine (b), a source axial CT image shows the anterior column (continuous circle) formed by the vertebral body, intervertebral disc, anterior and posterior longitudinal ligaments, the lateral columns (dotted circles), i.e., the pillars, formed by the pedicles, superior and inferior facets, lateral mass, and facet joints, and the posterior column (dashed circle) formed by the flavum ligament flavum, lamina, spinous processes, and nuchal ligaments, i.e., infraspinous, supraspinous, and nuchae ligaments
Fig. 5.8
T11 translational injury (dashed arrow): nonconsecutive 2D-reformatted sagittal and T11 source axial CT images (a), T1- and T2-weighted sagittal and nonconsecutive T2*- and T2-weighted T10 axial MR images (b). CT better depicts the osseous fractures and the displacements of T11 fragments, most notably of its right superior facet (long white arrows) with low signal intensity on both T1- and T2-weighted sagittal MR images. On the other hand, at T10 level the T2* low signal intensity on the surface of the spinal cord (short white arrows) results from hemorrhage and not from bone fragments; at the same level, white arrowhead shows spinal cord edema. Black arrowheads show tears of anterior longitudinal ligament, T10-T11 flavum ligament and adjacent portion of supraspinous ligament
Fig. 5.9
L2 Flexion distraction fracture (Chance fracture): 3D-reformatted right and left oblique and 2D-reformatted coronal CT images (a), and T1- and T2-weighted sagittal MR images (b). CT clearly shows the fractures lines of both L2 pedicles (black and white arrows), and the increase of interspinous processes (double arrow) indicating L2-L3 interspinous ligament injury. At L2-L3 level, MRI better depicts hemorrhage in the interspinous ligament (black asterisk), as well as the complete tear of supraspinous ligament (black arrowhead), with associated large hemorrhagic collection in the subfascial space (white asterisk). Note also a subtle posterior subdural hematoma (white arrowhead) and bone edema in L2 and L3 vertebral bodies
Fig. 5.10
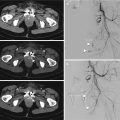
C4-C5 flexion distraction injury complicated by left vertebral artery dissection and hematomyelia: 2D-reformatted sagittal and coronal CT images (a), coronal and sagittal CT angiography images including magnification (b), T1- and T2-weighted, and STIR sagittal (c), and T2*-weighted axial (d) MR images. At C4-C5 level, the distraction injury mechanism (open dashed arrow) resulting in pure discal and ligamentous damage is clearly evident. CTA shows intimal flap (black arrows) of the left vertebral artery. MRI better shows an acute posttraumatic C4-C5 posterior disc herniation (long white arrows) directly depicts tear of anterior longitudinal, and interspinous ligaments resulting in prevertebral (small asterisk) and paravertebral (large asterisk) hemorrhagic collections. At C5-C6 level, MRI shows also an inhomogeneous centromedullary spinal cord area of prevalent T2 high signal intensity with portions of T2* low signal intensity (solid open arrows), such as hematomyelia in edema/contusion. Still note that there are no bony lesions
Fig. 5.11
C5 teardrop split fracture by flexion distraction and compression injury mechanisms: 2D-reformatted sagittal and nonconsecutive source axial CT images (a), and T1-weighted and STIR sagittal MR images (b). Fracture lines involve the C5 anterior lower body (white arrow), as well as both superior and inferior endplates (black arrowheads), i.e., a split fracture, with involvement of the posterior wall. MRI clearly depicts tear of the flavum (black arrow) and interspinous (asterisk) ligaments, as well as bone edema in the vertebral bodies of C6, T1, T2, and T3 (white arrowheads), some of which show reduction in height. Note also the incipient subluxation of right C5-C6 facet joint, as well as a subtle fracture of the ipsilateral C6 superior articular process (white circle)
Furthermore, thanks to technological progress and the availability of multislice CT scanners, a further advantage is the possibility of performing CT angiography (CTA) of cervicocranial arteries in patients with associated risk of blunt cerebrovascular injury [1, 3, 13, 36, 49]. An Italian study performed by a 16-slice CTA showed that blunt cerebrovascular injury occurred in more than 3% of 1153 patients admitted as multi-trauma, i.e., with two or more injuries (of which at least one life-threatening or Injury Severity Score ≥ 16) and/or high-speed trauma or fall from an height > 3 m [1]. Fractures, dislocations, and subluxation of the craniocervical junction and the cervical spine are among the conditions at risk (Figs. 5.10, 5.12, 5.13, and 5.14), including fractures of the transverse processes with involvement of the transverse foramen where the vertebral artery passes (Fig. 5.13). Other risk factors include injuries from high-energy trauma, such as LeFort fractures, fracture of the first rib and of the sternum, as well as associated signs of neck trauma suggesting hanging as the mechanism of injury. Catheter digital subtraction angiography is still considered the “gold standard” technique; however, it is relatively invasive, has a significant cost, requires specific resources, and is not always available. In the screening evaluation at the time of admission for trauma, it has to be replaced by modern-scanners multislice CTA [36]. CTA may be performed by a “whole body” or a sequential technique on the basis of institutional experience: always it has to include the aortic arch and cover the intracranial arterial vessels [1, 49].


Fig. 5.12
Fracture subluxation of the craniocervical junction complicated by bilateral vertebral artery dissection in pre-CTA era: source axial and 2D-reformatted sagittal CT images (a), T2-weighted coronal MR image of the head (b) and digital subtraction angiography anteroposterior view (c). At admission, CT showed type III left occipital condyle fracture from ipsilateral alar ligament avulsion (black arrows). One day later, the patient underwent abrupt worsening of her neurological conditions, and MRI showed signs of ischemia in both infra- and supratentorial posterior circulation. Angiography showed right vertebral artery occlusion and left vertebral artery stenosis (white arrows), both signs consistent with arterial dissection
Fig. 5.13
Fracture of C2 odontoid process (type III or “low”) and mass complicated by vertebral artery dissection: 2D-coronal and sagittal unenhanced CT (a), source axial (b), and 2D-reformatted sagittal and coronal CT angiography (c) images show the axis fracture (white arrows), the impingement of a fragment of its left lateral mass on the left vertebral artery (long black arrow), and left vertebral artery irregularity and stenosis (short black arrows)
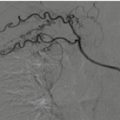
Fig. 5.14
C6 left mass fracture-dislocation and C7 left mass fracture associated with C6-C7 and C7-T1 subluxation from extension distraction injury, complicated by carotid artery dissection: 2D-reformatted coronal and sagittal, and nonconsecutive source axial CT images (a), and 2D-reformatted coronal and sagittal, and source axial CT angiography images (b). CT images show fracture-dislocation of left C6 mass (black circle) and fracture of left C7 (white circle) mass, as well as C6-C7 (black arrows) and C7-T1 (white arrows) facet joint subluxation. CTA shows intimal injury and thrombus in the left internal carotid artery (white arrowhead). Note also occlusion of the proximal V2 segment of the left vertebral artery (black arrowhead) associated with hematoma in the left longissimus muscles and anterior scalenus muscles region (asterisk)
Additionally, iodine contrast medium intrathecal injection, i.e., myelography completed by high-resolution CT myelography, may be still advocated for a more detailed evaluation of posttraumatic nerve root avulsions, especially in brachial plexus injuries, providing a support to somatosensory evoked potentials in prognosis and surgical exploration planning, especially when high-resolution MRI including MR myelography is contraindicated or provides uncertain findings [43, 60].
Finally, various potential pitfalls may mimic or mask spinal injuries at multislice CT [19], including anatomical and developmental variants resulting from failure of fusion or segmentation, vascular channels (Fig. 5.15), intervertebral discs, motion-related and beam-hardening artifacts, and non-traumatic or underlying conditions. The (neuro)radiologist has to be familial with such possibilities.

Fig. 5.15
Basivertebral veins: anteroposterior and lateral radiographic views (a), consecutive axial CT images (b), and T1-weighted and fat-suppressed T2-weighted sagittal and axial MR images (c). Radiography shows a subtle radiolucency (black arrow) along the anterior wall of T12 vertebral body: this finding was considered suspicious for fracture after a skiing fall. CT clearly depicts the vertebral body basivertebral veins which course horizontally receiving tributaries from numerous small venous channels, through many openings in the anterior and lateral surfaces of the vertebral body, then draining into the anterior internal vertebral plexus in the middle of the posterior vertebral body. MRI confirms this finding, i.e., its morphology (white arrows) associated with T1 low and T2 high signal intensity. Furthermore, MRI does not show bone edema
5.2.3 Magnetic Resonance Imaging
MRI is the only imaging procedure providing a direct study of the spinal cord and spinal root. Thus, it is indicated in patients with spinal cord symptoms and signs and in those with discrepancy between findings at radiography and/or CT and neurological clinical status [12, 15, 31, 39, 47].
High contrast resolution of MRI, especially in short tau inversion recovery (STIR) and fat-suppressed T2-weighted images, results in the further advantages of direct identification of posttraumatic bone edema, as well as intervertebral discs, ligaments, and joints lesions, even with normal findings at radiography or CT.
MRI examination should always include:


T1-weighted sagittal images, for anatomical details and sensitivity in the identification of a possible spinal hematoma (Figs. 5.5, 5.8, 5.9, 5.10, 5.11, and 5.15)
T2-weighted sagittal images, for the evaluation of the spinal cord (Figs. 5.5, 5.8, 5.9, 5.10, 5.11, 5.15, and 5.16);
STIR or fat-suppressed T2-weighted sagittal images (Figs. 5.10, 5.11, 5.16, 5.17, 5.18, and 5.19), for a better evidence of bone edema and soft tissues damage
T2- or T2*-weighted axial images to confirm spinal cord injury since in sagittal planes artifactual images can “overlap” to the spinal cord (Figs. 5.8, 5.10, and 5.18);
Fig. 5.16
C2 atypical traumatic spondylolisthesis in multiple vertebral injuries: nonconsecutive right to left 2D-reformatted sagittal (a) and source axial (b) CT images, and STIR sagittal MR image (c). The fracture line involving both axis pedicles and axis body (black arrows) is well depicted. MRI shows posttraumatic bone edema in the C7, T1, T2, and T3 vertebral bodies
Fig. 5.17
Multiple fractures of the craniocervical junction and thoracic spine: nonconsecutive source axial (a), right to left 2D-reformatted sagittal, and midsagittal (b) CT, and STIR sagittal MRI (c) images. In the craniocervical junction, CT shows a type I right occipital condyle fracture (thin long white arrow), a type II atlas fracture (white arrowheads), and an atypical traumatic spondylolisthesis of the axis (black arrow) of the posterior third of the body of the atlas. Note also the burst fracture of T5, the edema (thick long white arrows) in the T2, T3, T4, and T7 vertebral bodies, the interruption of T5-T6 and T6-T7 ligamenta flava (short white arrows), as well as signal alteration in T3 to T6 interspinous ligaments (asterisk)
Fig. 5.18
T9 split fracture by a mixed compression (white dashed open arrow) and translation (black dashed open arrow) injury mechanisms: 2D-reformatted midsagittal (a) and source axial CT (b), and fat-sat T2-weighted sagittal (c) and T2*-weighted axial (d) MR images. Solid arrowheads indicate the involvement of both endplates, i.e., a split fracture. Short white arrow indicates tears of supraspinous ligament at T8-T9 level and T8-T9 ligamentum flavum, as well as injury to T8-T9 ligamentum flavum. White long arrow indicates hematomyelia. The spinal cord is highly compressed and distorted
Fig. 5.19
Potential for MRI in depicting nerve roots: nonconsecutive 2D-reformatted axial images from high-resolution 3D-TSE T2-weighted images. At C4-C5 (left image) and C5-C6 (right image), anterior and posterior nerve roots are clearly evident
Furthermore, in the evaluation of the neurological damage, a significant advantage of MRI is to study neural roots (Fig. 5.19) and plexi, limiting the need for radiography and CT myelography. Root avulsions and lesions of the neural pockets possibly resulting in pseudomeningocele may be shown already in the acute phase, especially by high-resolution 3D T2-weighted “myelographic” sequences. However, when necessary, the complete MR study of a plexus is generally performed on a later stage (generally after 1 month from the trauma) since it requires complete patient’s immobility, absorption of possible posttraumatic hemorrhage, and finally possible surgical therapeutic options (nerve reconstruction) are not performed in the acute phase but generally in 2–3 months from trauma. In addition to “myelographic” images for assessing the integrity of roots and neural pockets, the study should include STIR or fat-suppressed T2-weighted images to rule out or show damage of the plexus elements. Intravenous paramagnetic contrast medium may be useful to demonstrate the damage of the blood–neural barrier in the subacute and chronic phase.
Additionally, MR imaging is superior to CT in the evaluation of bone edema, disc and ligaments injury. Recently, it has been advocated as appropriate to include STIR or fat-suppressed T2-weighted sagittal images of a spinal segment wider than the area of the posttraumatic injury (Figs. 5.11 and 5.16), and possibly of the whole spine. This is to rule out other spinal lesions which, although generally of no great clinical relevance, can be important for overall clinical prognosis and surgical planning [38, 45, 57]. Supraspinous ligament injury may be diagnosed by the discontinuity or nonvisualization of its black stripe of low signal intensity on T1- and/or T2-weighted sagittal images (Figs. 5.8, 5.9, 5.10, and 5.18), i.e., a sign which may be advocated also for flavum ligament injury (Figs. 5.8, 5.10, 5.11, 5.17, and 5.18). Interspinous ligament injury may be diagnosed by high signal intensity on STIR and fat-suppressed T2-weighted images (Figs. 5.9 and 5.17), consistent with hematoma [16], despite this evidence does not mean its certain disruption (Fig. 5.10). Surgical exploration remains the standard reference for the identification of the ligamentous damage. Thus, abnormal T2 signal intensity seen in the capsules or ligaments with normal bone relationships results in an “indeterminate” score in TLICS and SLIC classification systems [52, 53]. Nevertheless, diagnostic imaging aimed to the specific lesional situation seems to facilitate the most appropriate therapeutic choice.
Finally, in the acute phase, certainly the quality of MR studies may be reduced by the presence of cervical collar or spinal longboard (Fig. 5.4).
5.3 Anatomy, Function, and Stability
Two adjacent vertebrae and the corresponding interconnected soft tissue are the simplest and principal functional motion segment of the spine, i.e., the functional spinal unit. Stability is strongly correlated with the integrity of discal, joint, and ligamentous structures supporting bony elements.
In the craniocervical junction, occipital condyles, atlas, and axis are provided by a number of ligamentous and articular structures including the transverse ligament of the atlas and the apical ligament (which both form the so-called cruciform ligament), the alar ligaments, the tectorial membrane which blend with the posterior longitudinal ligament, and the atlanto-odontoid, occipitoatlantal, and atlantoaxial joints.
In the subaxial cervical spine and in the thoracolumbar spine, the functional spine unit is formed by an anterior and a posterior portion. The anterior portion includes the two aligned vertebral bodies, the interposed intervertebral disc containing a central hydrated nucleus pulposus and a peripheral annulus fibrosus, and the anterior and posterior longitudinal ligaments. The anterior longitudinal ligament is a strong band of variable thickness and width running the entire length of the spine from the skull base to the sacrum, connecting the anterior vertebral body to the anterior annulus fibrosus. The posterior longitudinal ligament is a strong band, spanning from the body of the axis to the posterior surface of the sacrum, connecting the posterior vertebral body to the posterior annulus fibrosus, forming the anterior wall of the vertebral canal, and superiorly blending with the tectorial membrane. The anterior portion primarily supports axial, or compressive, loading, which is resisted by vertebral bodies and intervertebral disc, which directs forces circumferential towards anterior and posterior ligaments.
The posterior portion includes the vertebral arches, flavum ligaments, facet joints, interspinous and supraspinous ligaments. Flavum ligaments connect the laminae of the adjacent vertebrae and keeps them aligned. Facet joints are posterior portions of the laminae and are the primary elements allowing spinal movements on the basis of their morphology in the cervical, thoracic, and lumbar segments. In the cervical spine, the upward and superomedial inclination of superior articular facets allows free flexion and extension, as well as combination of lateral flexion and rotation. In the thoracic spine, superior articular facets are oriented in the coronal plan, face posteriorly, and are directed a little superolaterally, resulting in free lateral rotation and minimized flexion and extension. In the lumbar spine, superior articular facets are oriented in a sagittal oblique plan and face posteromedially, resulting in a wider range of extension than flexion, while rotation is minimized. Interspinous ligament is a weak and thin membrane connecting the adjacent spinous processes. Supraspinous ligament is a strong cordlike ligament connecting the tips of the spinous processes from C7 to the sacrum. The posterior portion of the functional spinal unit primarily supports movements of the spine, including flexion, extension, and rotation, resisting excessive tensile forces possibly resulting also in translational injuries.
Spinal stability is defined as the ability of the spine to prevent progressive deformity and neurologic injury by maintaining relationships between vertebrae and limiting reciprocal displacements in the different positions, under the action of physiological loading and normal range of movements: this may result only from the whole integrity of vertebrae, intervertebral discs, joints, ligaments, muscles, and neural control [4, 23, 24, 58, 59].
A posttraumatic spinal lesion is considered stable when it can be reduced with external maneuvers and maintained reduced with external means (casts, corsets) till to healing, and unstable when it cannot be reduced by external maneuvers nor it can be maintained reduced by external elements until the healing. Therefore, an unstable posttraumatic spinal lesion requires surgery to restore the stability. However, the differentiation between stable and unstable lesions is still under discussion, and there are no stability or instability criteria universally accepted, even for the specific anatomical and functional characteristics of spinal segments. This resulted in the development of many classification systems guiding clinical and surgical treatment, historically based on anatomic structures and injury mechanisms (axial loading or compression/burst, distraction in flexion or extension, translation/rotation, seat belt injury) determined through analysis of osseous components and their relationships [5, 17, 25, 29, 33, 42, 46, 52, 53].
For instance, for a long time the evaluation of thoracolumbar fractures has been performed on the Denis three-column model classification system (Fig. 5.5), which was based on morphology from compression, burst, seat belt, and fracture dislocation injury mechanisms [5]. Fractures of articular, transverse, and spinous processes, and pars articularis were considered minor fractures. This classification system introduced and highlighted the involvement of the posterior vertebral body and intervertebral disc and the posterior longitudinal ligament, i.e., the “middle column,” whose lesions (Fig. 5.4) were defined to render the spine mechanically unstable and preferably requiring surgery. However, it has been demonstrated that “two-column” “unstable” injuries can also be successfully treated nonsurgically, if the posterior ligamentous complex is intact [29]. Notably, the anatomical models of the columns are not free from criticism since the columns do not represent anatomical or functional biomechanical realities.
A more accurate classification system of fractures of the thoracolumbar spine based on mechanism of injury was then proposed by Magerl et al. in 1994 and also called AO (Arbeitsgemeinschaft für Osteosynthesefragen or Association for Osteosynthesis) classification system [25]. The three main lesional mechanisms give the name to the three main groups of the lesion, i.e., compression, distraction, and translation/rotation. On the basis of fracture location, morphology, osseous or ligamentous disruption, and direction of displacement, each of these three groups is divided into three other and each of the resulting nine subgroups is further divided, for a total of 53 subtypes. The main principle was that fractures represent a continuum of progressively increasing injury severity and instability groups from A to C, resulting in an increasing likelihood of the need for surgery. AO system introduced and highlighted the role of injuries to soft tissues, namely the posterior ligamentous complex. Nevertheless, the complexity of this classification resulted in a certain degree of limited interobserver disagreement, providing poor prognostic data, and thus resulting in a limited use. Additionally, these classification systems did not provide information on the patient’s neurologic status, which is the other basis guiding surgical intervention. Notably, most classification systems lacked an overall assessment of the stability of the spine which has to include a comprehensive assessment of injury mechanism (as expression of immediate mechanical stability), ligamentous injury (as expression of long-term mechanical stability), and neurological status (as expression of clinical stability).
To overcome some of these limitations, in the first decade of 2000s, thoracolumbar injury classification and severity score system, or TLICS [52] and the subaxial cervical spine injury classification system, or SLIC [53] have been proposed for the management and treatment options of fractures of the thoracolumbar and subaxial cervical spine, respectively. These classification systems identified three major characteristics resulting in a weighted score critical to clinical decision-making: (1) injury morphology as determined by the pattern of spinal column disruption on available imaging studies, (2) integrity of the posterior ligamentous complex, or “posterior tensioning band” formed by flavum ligament, facet capsule, interspinous and supraspinous ligaments in the thoracolumbar spine, and of the discoligamentous complex formed by the anterior longitudinal ligament, intervertebral disc, and posterior longitudinal ligament anteriorly, flavum ligament, facet capsule, interspinous and supraspinous ligaments posteriorly in the subaxial cervical spine, and (3) neurologic status of the patient.
More recently, a new comprehensive modified AO spine fracture classification systems have been proposed [54, 55], taking the best of the Magerl, TLICS, and SLIC systems, and scoring fracture morphology, neurologic status, and relevant site- and patient-specific modifiers for therapeutic decisions.
Related posts:
Stay updated, free articles. Join our Telegram channel

Full access? Get Clinical Tree


