CHAPTER 1 Static Anatomic Techniques
Computed tomography (CT) and magnetic resonance imaging (MRI) are the mainstays of anatomic neurologic imaging. CT was first introduced in the early 1970s and MRI in the early 1980s. Since then, CT and MRI have transformed medical diagnosis and proved essential in neuroimaging.
COMPUTED TOMOGRAPHY
Basic Concepts
The spatial resolution of the CT image depends in part on voxel size. Ideally, each voxel of data would be very small to provide high spatial resolution. Each voxel would also ideally be isotropic (having equal dimensions in all three planes) to provide for excellent image reconstructions in any arbitrary plane. It has been relatively easy to achieve high in-plane resolution (along the x/y axes), to the order of 0.5 to 0.7 mm.1 It has proved difficult to achieve high resolution in the longitudinal or z-plane, because longitudinal resolution is determined by the slice thickness. Use of thin submillimeter slices reduces the length of tissue that can be scanned in a reasonable time or increases the scan time for equal lengths of tissue imaged. Evolution of CT technology over the years can be seen in part as the pursuit of this isotropic resolution.
Spiral CT
One technical factor unique to spiral CT is pitch. Pitch is the ratio of table displacement per 360-degree gantry rotation to slice collimation or thickness (table speed × rotation time/slice collimation). A small pitch gives finer spatial resolution along the z-axis of the patient but covers less tissue in a given time and delivers a higher radiation dose to the patient. A large pitch reduces the radiation dose to the patient but also reduces spatial resolution in the z-axis.
Multislice Spiral CT
The next significant milestone in CT evolution was the introduction of scanners with multiple detector rows. In 1998, all major vendors introduced 4-slice CT scanners capable of acquiring up to four slices per gantry rotation. Instead of a single detector row, multiple detector rows were stacked in the gantry along the z-axis of the patient (Fig. 1-1). The time needed for the gantry to complete a 360-degree revolution (gantry rotation time) was also cut in half from 1 second to 0.5 second. For the same slice thickness, pitch, and scan time, a 4-slice CT scanner could image eight times the distance of a single-slice scanner. Alternatively, the 4-slice scanner could acquire four 1.25-mm slices in half the time that single-slice spiral CT acquired one 5-mm slice. Four-slice CT made higher z-axis resolution feasible for a reasonable anatomic length and scan time.
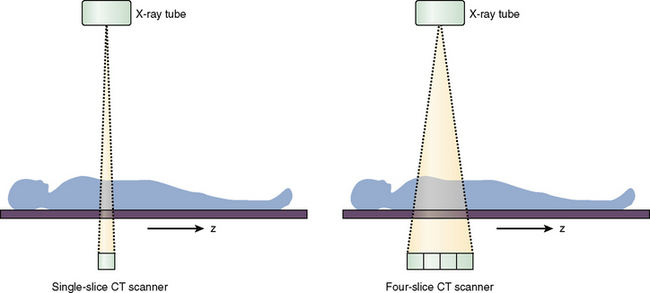
FIGURE 1-1 Single-slice versus multi-slice CT scanners. The four-slice scanner has multiple detector rows stacked along the z-axis of the patient.
Imaging
Normal Appearance of Images
The human eye can typically differentiate only 60 to 80 different levels of gray. In practice, therefore, the Hounsfield scale must be narrowed to illustrate specific structures of interest. This is achieved by selecting a gray-scale window of displayed Hounsfield units and arbitrarily making all structures above the chosen window white and all structures below the window black. The window width describes the range of Hounsfield values displayed as shades of gray. The window level gives the center value of that gray-scale window. A head CT is typically viewed at window width of 80 HU and window level of 40 HU, which means that 0 HU and 80 HU are the lower and upper limits of the window, respectively, with 40 HU in the center. This relatively narrow window width successfully displays the small differences in attenuation values of the brain. Figure 1-2 emphasizes the importance of choosing appropriate windows to properly display structures of interest and to detect clinically important pathologic processes.
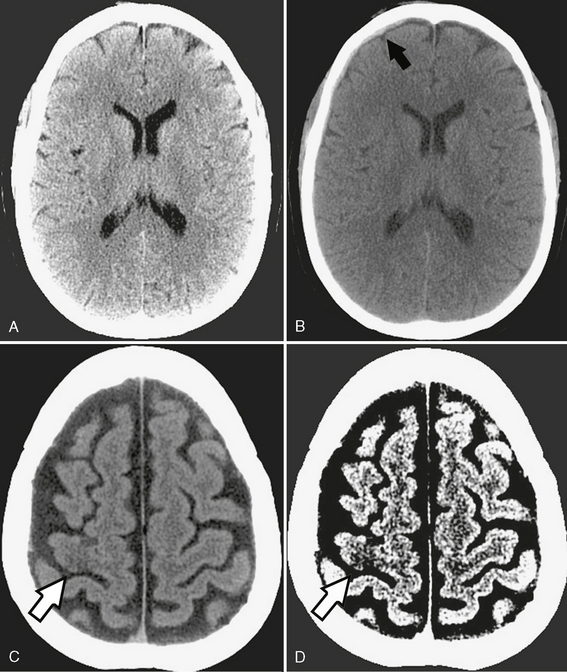
FIGURE 1-2 Importance of window settings. A, Subdural hematomas can be easily missed with narrow window settings because hemorrhage may lie outside the window and appear as bright as adjacent bone. B, However, widening the window (width 150, level 80) shows a very small right frontal subdural hematoma (arrow). C, Normal brain window (width 80, level 40) shows very subtle loss of gray-white differentiation in the right motor cortex (arrow). D, The acute stroke is made more conspicuous (arrow) by narrowing the window (width 8, level 32) to emphasize the small attenuation difference between gray and white matter.
Artifacts
Common artifacts encountered in CT include patient motion, beam hardening, partial volume effects, and metallic object streak artifacts. Patient motion during scanning creates extensive blurring and misregistration of images. This can be partly mitigated by reducing scan times as much as possible. Beam hardening occurs because the energy profile of the x-ray beam changes as it passes through dense objects such as bone. The softer (lower energy) x-rays are absorbed and filtered out by the bone, leaving a beam composed of only harder (higher energy) x-rays. On head CT, beam hardening typically occurs in the posterior fossa between the petrous apices, causing dark horizontal lines across the brain stem and limiting the utility of CT for assessing pathologic processes in this area. Partial volume artifacts ensue when an imaging voxel contains different types of tissue. The attenuation value of the voxel is a numerical average of the attenuation of all the tissues contained within that voxel. If a portion of the voxel has a very high (or low) Hounsfield unit value, that portion may influence the net attenuation of the voxel disproportionately and obscure the presence of other tissues. Like beam hardening, partial volume effects are most troublesome in the posterior fossa, where they cause streaks or bands of light and dark. Reducing scan thickness produces smaller voxels and helps to reduce partial volume effects. Metallic objects such as aneurysm clips or dental hardware generate intense streak artifacts because their exceptionally high density causes beam hardening and partial volume artifacts. The streaks can completely obscure adjacent structures and prevent their evaluation. Figure 1-3 illustrates these typical artifacts.
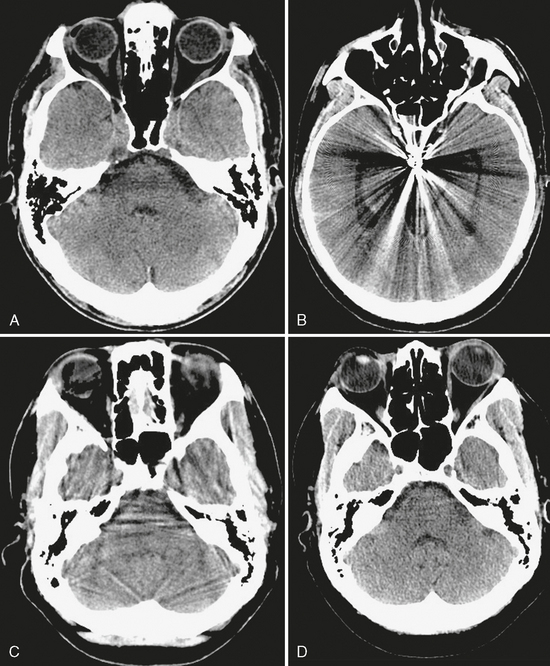
FIGURE 1-3 Common CT artifacts. A, Beam hardening is seen between the petrous apices, limiting evaluation of the pons. B, Aneurysm clip causes extensive metallic streak artifact. C, Partial volume artifact is seen as streaks throughout the posterior fossa on this 5-mm thick slice. D, Reducing slice thickness to 2.5 mm significantly reduces partial volume artifact.
Specific Uses
Brain CT is most useful in acute settings, especially emergency departments, because of its fast acquisition time, ready accessibility, and lower cost compared with MRI. As the first-line examination after trauma, CT is more sensitive than MRI for detecting skull fractures and radiopaque foreign bodies such as metal or glass.2 CT readily identifies acute subdural/epidural and parenchymal hematomas and hemorrhagic contusions and is superior to MRI for detecting acute subarachnoid hemorrhage.3 CT is particularly helpful for identifying calcification and assessing pathologic processes of bone, both of which may narrow a differential diagnosis. CT is indispensable for studying patients with cardiac pacemakers, defibrillators, intra-orbital metal, or other implants that contraindicate the use of MRI.
CT angiography (CTA) has become important in the initial evaluation of subarachnoid hemorrhage, achieving 90% to 93% sensitivity for detecting aneurysms according to meta-analyses of older studies.4,5 The faster scan times available with 16- and 64-slice scanners permit selective capture of the arterial phase of contrast opacification without venous contamination and provide images close to true angiograms. The fast, thinly collimated multi-slice acquisitions now permit CTA to be performed over long distances in short periods of time, so CTA can image the entire region from the base of the heart to the vertex of the skull to evaluate stroke patients for left atrial thrombi and potential occlusions in the cervical and intracranial circulations. Although digital subtraction angiography (DSA) remains the gold standard for angiography at present, the sensitivity and speed of CTA are constantly improving, so CTA will come to rival DSA in the near future.6
Analysis
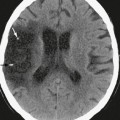
In any acute setting, noncontrast head CT can be used to quickly assess for the three Hs—hemorrhage, herniation, and hydrocephalus—which may necessitate immediate neurosurgical intervention. Figure 1-4 illustrates the utility of CT in the acute setting, as well as its importance in the evaluation of bony lesions.
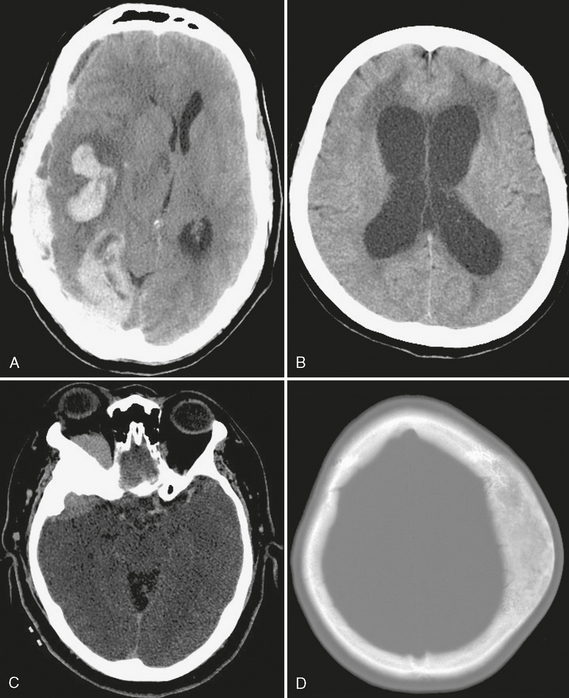
FIGURE 1-4 Uses of CT. A, Extensive right parenchymal and subdural hematomas cause significant right-to-left midline shift, a neurosurgical emergency. B, Acute hydrocephalus with transependymal flow of CSF is seen as low attenuation of periventricular white matter. C, The sphenoid wing hyperostosis associated with this enhancing extra-axial mass is characteristic of meningioma. D, Fibrous dysplasia has a typical CT appearance as an expansile osseous lesion with ground-glass internal matrix.
A sample report is shown in Box 1-1.
BOX 1-1 Sample Report: CT and CT Angiography of the Head(Fig. 1-5)
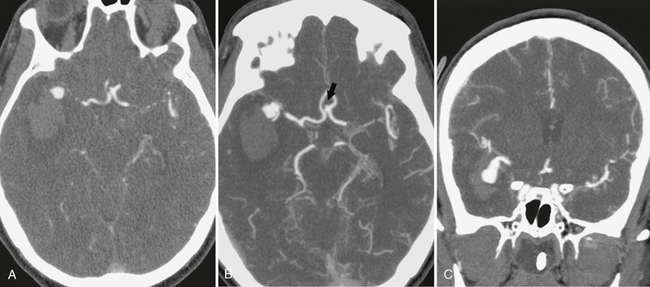
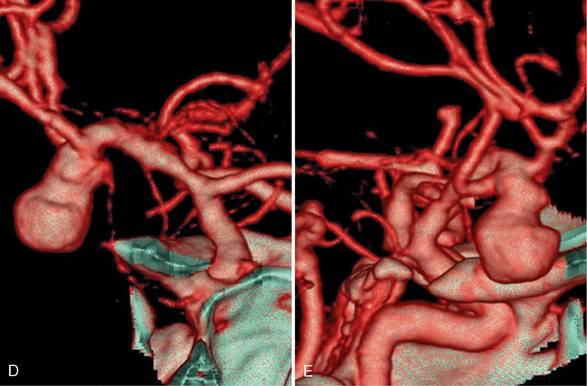
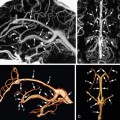
FIGURE 1-5 CTA of ruptured right middle cerebral artery (MCA) bifurcation aneurysm. A, The 0.625-mm collimated axial source images obtained on a 64-slice scanner demonstrate the saccular right MCA aneurysm with adjacent intraparenchymal hematoma. Axial (B) and coronal (C) maximum intensity projections (20-mm thickness with interval of 5 mm and 75% overlap) show more of the aneurysm and adjacent vessels with each slice than the thin source images. A small anterior communicating artery aneurysm is seen on the axial image (arrow, B). Coronal (D) and sagittal (E) volume-rendered images are useful to evaluate the relationship of the MCA branches to the aneurysm.
Pitfalls and Limitations
Several important problems do limit the utility of CT. In patients with renal impairment, the use of iodinated intravenous contrast is limited by concerns about contrast-induced nephropathy, generally identified as an increase in serum creatinine concentration after administration of a contrast agent, without an alternative explanation. Although there are no uniform diagnostic criteria (because creatinine levels are not necessarily precise), the two most important risk factors for developing nephropathy are preexisting renal impairment and diabetes.7,8 Adequate hydration, acetylcysteine, and sodium bicarbonate may help prevent nephropathy in patients with borderline renal function.9,10
Radiologists are frequently asked what to do with patients who are “allergic” to shellfish or iodine. There is a mistaken assumption that iodine in each of these compounds confers cross-reactivity to iodinated contrast agents. However, there is little to no evidence to indicate that the iodine itself triggers adverse reactions to contrast, seafood, or topical povidone-iodine.11 In patients with a history of significant prior contrast reaction, premedication with histamine blockers and corticosteroids can be performed. Patients describing allergies to seafood should be questioned about the nature of the reaction but only insofar as a history of severe allergy to any food increases the risk of contrast reaction.
Pregnancy and lactation generate additional safety considerations for CT. The radiation dose to the fetus during the mother’s head CT has been estimated at 0 to 1 mGy and is from scattered radiation only. It is generally believed that the risk to the fetus of teratogenesis or childhood cancer is negligible at radiation dosages less than 50 mGy.12,13 Because the uterus lies outside the field of view and the radiation dose to the fetus is negligible, it is not clear that it is necessary to place lead shielding over the abdomen/pelvis. However, placing shielding may provide reassurance to the patient. Iodinated contrast material should be avoided if possible during pregnancy because of potential concern for fetal hypothyroidism. For lactating women, the traditional recommendation is to discontinue breast feeding for 12 to 24 hours after contrast agent administration and discard the milk.14
MAGNETIC RESONANCE IMAGING
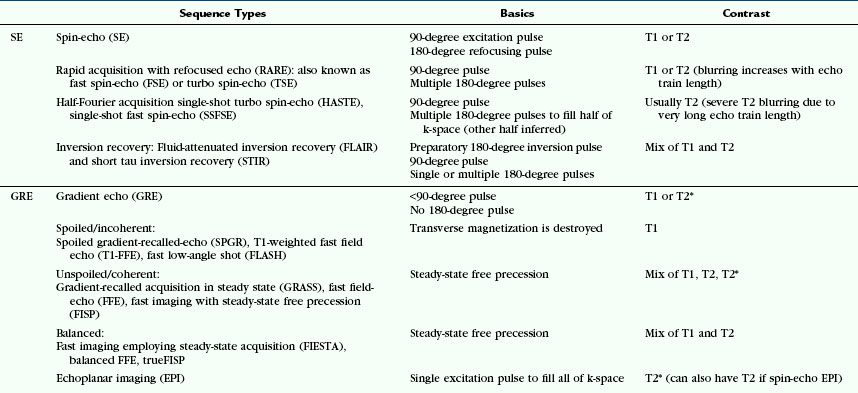
MRI employs an astonishing array of sequences that are acquired by diverse means, are used for different purposes, and are designated by different acronyms by each manufacturer. Table 1-1 offers an overview of the major sequences commonly used in MRI (including their acronyms), which may be a useful reference during review of this chapter.
Basic Concepts
MR Signal Creation
Clinical MRI relies on the hydrogen nucleus. In their native state, the hydrogen nuclei exhibit random orientation and precess or rotate at varying rates. When an external magnetic field (B0) is applied, the hydrogen nuclei begin to precess at a resonance frequency (designated the Larmor frequency) that is proportional to the magnetic field strength. Additionally, the external magnetic field prompts the hydrogen nuclei to align and precess along the axis of the magnetic field, creating a net magnetization vector. By convention, the direction of B0 is designated the longitudinal or z-axis. The plane oriented perpendicular to the z-axis is designated the transverse or x/y-axis.