Abstract
Cardiac imaging is very important for diagnosis, management, and risk stratification of systemic diseases involving the heart such as arterial systemic hypertension, diabetes mellitus and metabolic syndrome, autoimmune connective disorders, thyroid disease, systemic vasculitis. Echocardiography, cardiac MRI and Cardiac CT can be used as complementary imaging according to the clinical picture and the stage of the described diseases the clinical picture and the stage of the described diseases.
Keywords
Systemic diseases, Echocardiography, Cardiac magnetic resonance, Cardiac CT, Nuclear cardiology
15.1
Arterial systemic hypertension
Arterial systemic hypertension is a well established, leading cardiovascular (CV) risk factor for morbidity and mortality in the general population. Myocardial infarction, heart failure, and sudden death are the main fatal and non-fatal complications in hypertensive patients [ ]. The clinical consequences of hypertension on the heart derive from chronic pressure overload, such as to induce left ventricular (LV) structural and functional alterations, which define hypertensive heart disease. The development of LV hypertrophy (LVH) is of hinge importance since it increases the risk for CV outcomes by a factor of 3–5-fold [ ]. Hypertensive heart disease is clinically asymptomatic but manifests at a more advanced stage as angina pectoris, dyspnoea, and palpitation. These symptoms can be attributed to a reduced coronary flow reserve (CFR), impaired diastolic function, and arrhythmias [ , ].
Echocardiographic examination is the first-step imaging technique for diagnosing hypertensive heart disease because of its relatively low cost, prompt availability, and suitability for serial examinations and patient follow-up. Echo-Doppler examination is currently used to detect LV remodelling and LVH [ ] as well as LV diastolic dysfunction (DD) [ ] and also to unmask regional wall motion abnormalities [ ] and the onset of coronary artery disease (CAD).
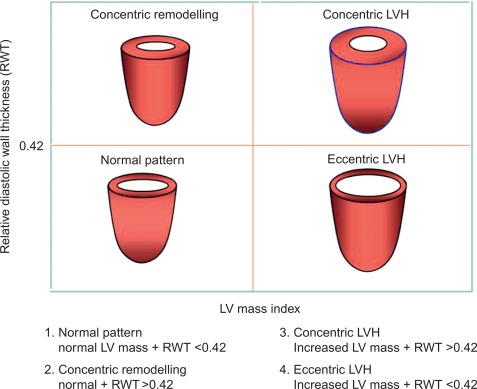
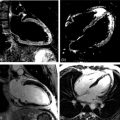
The estimation of LV geometry and LV mass (LVM) has been one of the most studied issues by echocardiography in the epidemiologic studies and treatment trials in the last three decades [ , ]. LV geometric patterns of hypertensive heart are identified according to a classification which combines the values of relative wall thickness (RWT) and LVM index ( Figure 15.1 ) [ ]. LVM (indexed for body surface area [BSA] or, better, for height) identifies LVH according to standardized cut-off point values ( Table 15.1 ) [ ]. LV concentric remodelling and LVH are independent predictors of morbidity and mortality in the general population [ , , ]. Reduction of LVM can be obtained by different kinds of anti-hypertensive treatments [ , ] and improves prognosis in hypertensive patients [ ]. Further information could be added by the calculation of midwall fractional shortening, obtainable by mathematical model from linear measures of LV cavity size and wall thickness at end-diastole and end-systole [ ]. Midwall shortening should be preferred to ejection fraction (EF) in the presence of LV concentric geometry, in which the prognostic power of this parameter has been reported [ , ]. The assessment of LV systolic function in hypertensive heart disease, however, does not add prognostic information to the assessment of LVM, at least in the context of a normal LV systolic function [ ].
| Parameter | Reference range | Mild LVH | Moderate LVH | Severe LVH |
|---|---|---|---|---|
| Women | ||||
| LVM/BSA (g/m 2 ) | 43–95 | 96–108 | 109–121 | ≥ 122 |
| LVM/height (g/m) | 41–99 | 100–115 | 116–128 | ≥ 129 |
| LVM/height 2.7 (g/m 2.7 ) | 18–44 | 45–51 | 52–58 | ≥ 59 |
| Men | ||||
| LVM/BSA (g/m 2 ) | 49–115 | 116–131 | 132–148 | ≥ 149 |
| LVM/height (g/m) | 52–126 | 127–144 | 145–162 | ≥ 163 |
| LVM/height 2.7 (g/m 2.7 ) | 20–48 | 49–55 | 56–63 | ≥ 64 |
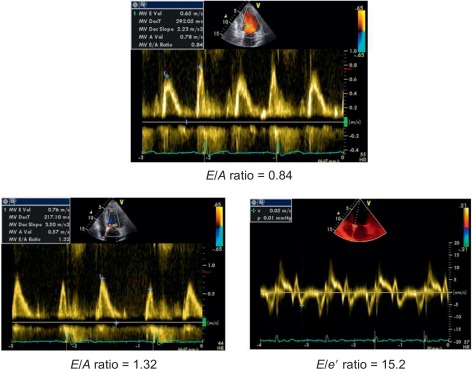
The progression of hypertensive heart towards heart failure includes serial LV structural and geometric abnormalities (mainly myocardial fibrosis) [ ] corresponding to LV concentric remodelling and LVH. In presence of these abnormalities, parallel alterations in LV diastolic properties occur and are globally defined as LV DD. DD includes alterations of both relaxation and filling [ ], precede LV chamber systolic dysfunction, and can per se induce symptoms/signs of heart failure even when EF is still normal (heart failure with normal EF). In this context, the simple Doppler transmitral inflow pattern is not sufficient to stratify the hypertensive prognosis and should be combined with further manoeuvers (Valsalva) applied to the assessment of LV filling and/or additional Doppler parameters (i.e., difference between pulmonary flow atrial reverse and mitral inflow A velocity, ratio between mitral inflow E velocity and early relaxation velocity of the mitral annulus on pulsed tissue Doppler [ E / e ′ ratio] and left atrial volume index) [ ]. E / e ′ ratio is highly feasible and accurate in the clinical setting [ ] ( Figure 15.2 ) and its value is highlighted in the recent ESC/ESH guidelines on arterial hypertension to detect early cardiac organ damage of hypertensive patients [ ] ( Table 15.2 ). The prognostic value of e ′ is recognized in the hypertensive setting [ ]. Recently, the ASCOT Study highlighted the prognostic value of E / e ′ ratio, independent on traditional echocardiographic measurements (including LVM index and RWT) during a mean follow-up of 4.2 years of 980 hypertensive patients [ ].
| Parameter | Upper cut-off value |
|---|---|
| LV mass index (g/m 2 ) | > 95 (women) |
| > 115 (men) | |
| Relative wall thickness (RWT) | ≥ 0.42 |
| Diastolic function | |
| Septal e ′ (cm/s) | < 8 |
| Lateral e ′ (cm/s) | < 10 |
| LA volume index (ml/m 2 ) | ≥ 34 |
| LV filling pressures | |
| E / e ′ (averaged) ratio | ≥ 13 |
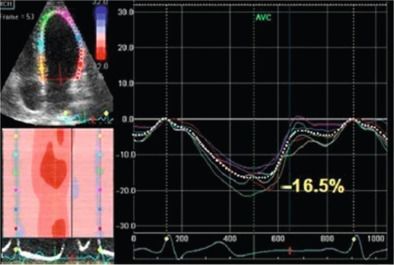
Among the advanced echocardiographic techniques, important insights can be gained by 2-D speckle tracking echocardiography, which allows the quantifying of the regional and global longitudinal strain (GLS) of subendocardial fibres with good accuracy [ ]. An early impairment of GLS has been observed in pre-hypertensive stages [ ] and in firstly diagnosed hypertensives [ ] when EF is still normal ( Figure 15.3 ). GLS progressively deteriorates in hypertensive heart disease, passing from NYHA I to IV class while LV circumferential systolic reduction becomes overt only in NYHA III and IV classes [ ].
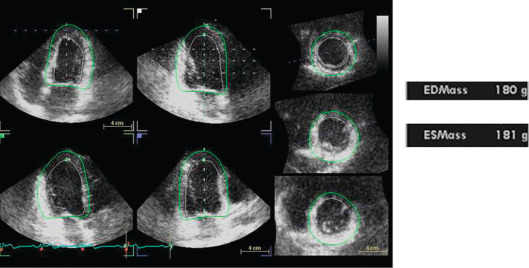
All LVM algorithms (M-mode, 2-D, 3-D) are based upon the subtraction of LV cavity volume from the volume enclosed by LV epicardium (“shell” volume) to obtain a myocardial volume, which is then multiplied by the specific weight of the myocardium (1.055 g/ml). The original ASE formula, which is based on M-mode linear measurements [ ], is still currently used for the estimation of LVM. It may be considered appropriate for evaluating patients with normal LV geometry, but its accuracy is suboptimal (standard error of estimate from 29 to 97 g, 95% confidence interval [CI] 57–190 g) in comparison with post-mortem LVM [ , ]. The calculation of LVM from real-time three-dimensional echocardiography (RT3DE) removes geometric assumptions of LV shape and reduces errors due to foreshortened views [ , ] ( Figure 15.4 ). RT3DE-derived LVM has been validated against post-mortem measurement and cardiac magnetic resonance ( K = 0.92 and 0.91, respectively) [ ]. A much lower LVM underestimation versus cardiac magnetic resonance has been found using RT3DE rather than 2D echocardiography [ ]. The very good reproducibility of LVM with RT3DE (intra-observer variability = 7–12.5%) [ , ] could significantly reduce sample size to assess LVM changes as compared to M-mode/and 2-D echocardiography [ ]. However, nowadays, due to the superior inter- and intra-observer repeatability cardiac magnetic resonance is considered the gold standard in the assessment of LVM and is used to this purpose in modern clinical trials to evaluate the drug capability in reducing LVM [ ].
Another possible application of cardiac magnetic resonance (CMR) is the evaluation of RV free wall mass, as the right sections can also be involved in the hypertrophic process. In fact, systemic hypertension might be associated with concentric right ventricular remodelling independently from the haemodynamic stress. Structural and functional right ventricular adaptation to systemic hypertension tends to parallel the homologous modifications induced by systemic haemodynamic overload on the left ventricle [ ].
Specific procedures are reserved for the diagnosis of myocardial ischemia in hypertensive patients [ ]. This is very challenging because hypertension strongly lowers the specificity of exercise ECG and perfusion scintigraphy. When exercise-ECG is positive (or ambiguous), an imaging test of inducible ischemia [ , ] is requested for a reliable identification of epicardial coronary artery stenosis. Stress echocardiography has higher specificity than exercise ECG or perfusion scintigraphy, with a similar sensitivity. Among the different types of stress, pharmacological stressors (dobutamine, dipyridamole, and adenosine) have higher feasibility than exercise testing, especially vasodilator testing. Stress-induced wall motion abnormalities are highly specific for the diagnosis of epicardial coronary artery stenosis, whereas myocardial perfusion abnormalities are frequently found also in presence of angiographically normal coronary arteries. This can occur in patients with LVH because of coronary microvascular disease [ ]. Recent recommendations suggest the use of dual echo imaging of regional wall motion and CFR on left anterior descending artery to differentiate obstructive CAD (reduced coronary reserve + inducible wall motion abnormalities) from isolated coronary microcirculatory damage (reduced coronary reserve without wall motion abnormalities) [ ]. While the use of stress cardiac magnetic resonance (dobutamine, adenosine, and dipyridamole) has been proven to be very accurate in ischemic heart disease, it is still under development in non-ischemic heart diseases. However, it might be already considered as a possible alternative to echocardiography and nuclear medicine.
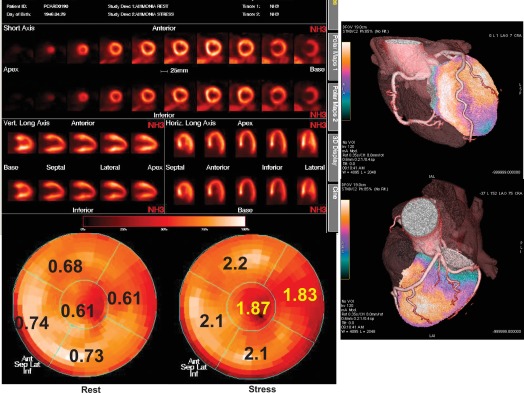
Positron emission tomography (PET) offers the unique capability of measuring absolute myocardial flow (flow per unit of mass) in vivo by means of a regional, tridimensional, non-invasive approach. Using PET, myocardial perfusion abnormalities secondary to microvascular disorders have been investigated in arterial hypertension as well as in hypertrophic cardiomyopathy. In arterial hypertension, regional perfusion at rest is within the normal range, while the coronary reserve and flow response to increase in metabolic demand are blunted ( Figure 15.5 ). These flow abnormalities are independent of the degree of cardiac hypertrophy and the severity of arterial hypertension; appropriate anti-hypertensive therapy is able to improve the perfusion abnormalities after long-term treatment, independently of the effect on myocardial hypertrophy. Hypertrophic cardiomyopathy demonstrates abnormal vasodilating capability, which has been shown to be present in the subclinical form of dilated cardiomyopathy; the reduction of coronary reserve is not related to the presence and extent of the haemodynamic impairment, and involves also non-hypertrophied myocardium in asymmetric hypertrophic cardiomyopathy. These findings indicate a primary involvement of coronary microcirculation in non-advanced forms of dilated and hypertrophic cardiomyopathy [ ].
15.2
Diabetic cardiomyopathy
The first demonstration of a distinct diabetic cardiomyopathy occurred in the early 1990s, when the Framingham Study demonstrated an increase of LVM in diabetic women, independent of the effects of other common risk factors [ ]. Subsequent studies confirmed these results in both genders, pointing out associations of both type 2 diabetes mellitus (DM2) and glucose intolerance (GI) with LV structure abnormalities (LV concentric remodelling/hypertrophy), independent of the influence of relevant covariates [ ]. GI and DM2 were also found to negatively affect midwall systolic mechanics [ ] and LV diastolic filling [ ], even in the presence of normal chamber function [ ], with an impact amplified by the coexistence of hypertension [ ]. These findings have now been complemented by the ability of echo-Doppler techniques to identify, categorize, and quantify alteration of LV function and CFR.
15.2.1
Diabetes and LV diastolic dysfunction
A Doppler pattern of impaired LV relaxation is an early sign of DD (grade I) while more advanced grades (predominant early diastolic filling and rapid velocity deceleration, i.e., restrictive filling patterns) are associated with the most severe LV decompensation [ ]. The crucial point of this grading is the intermediary, pseudonormal pattern, which occurs when LV filling pressure (LVFP) rises to keep cardiac output in the normal range and increases the early filling caused by impaired relaxation. Pseudonormal and normal patterns cannot be distinguished by transmitral inflow because of its preload dependence [ ]. Accordingly, transmitral E / A ratio was found to exhibit ‘U shape’ prognostic behaviour in the Strong Heart Study (high prevalence of DM): subjects with values < 0.6 (abnormal relaxation) and > 1.5 (likely restrictive pattern) were both associated with increased mortality, but the intermediate range (0.6–1.5), encompassing patients with normal or unidentified, pseudonormal patterns, had no significant prognostic impact [ ].
These dynamics are of great importance in DM2 without CAD, when abnormal LV relaxation is manifest but systolic function is still normal. When dyspnoea becomes overt, these abnormalities characterize “isolated” diastolic heart failure. Myocardial fibrosis and apoptosis [ ] are likely the basis of these changes. Over time, diabetics may transition to a pseudonormal pattern. At this stage, accurate evaluation of DD requires additional analysis of Valsalva manoeuver, pulmonary venous flow, and/or left atrial volume determination [ ]. A pseudonormal pattern was unmasked in 28% of diabetics by Valsalva manoeuver ( E / A ratio decrease ≥ 25%) and/or pulmonary venous flow (atrial reverse velocity duration longer than mitral A duration) [ ]. In this context, the combination of pulsed tissue Doppler with transmitral inflow may be very useful to characterize DD and elevated LVFP since early diastolic peak velocity ( E ′) of the mitral annulus reflects the rate of myocardial relaxation and is relatively insensitive to preload effects [ ]. The ratio E / e ′ has been validated as reliable index of LVFP [ ]. A reduction of annular e ′ was demonstrated in recent onset DM2 [ ]. In 25 type 1 diabetics, increased E / e ′ ratio was associated with left atrial enlargement and correlated independently with glycosylated haemoglobin [ ], thus confirming the association between level of glycemic control and DD [ ]. E / E ′ ratio may be, therefore, used to detect and follow the progression of DD in DM.
15.2.2
Diabetes and coronary microvascular dysfunction
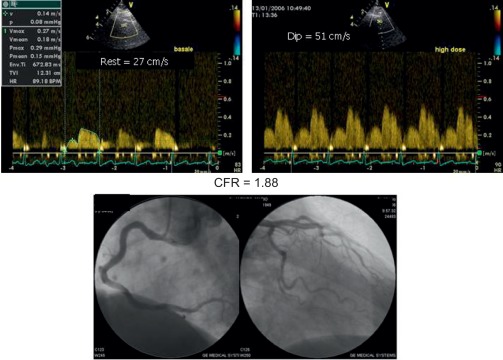
Alterations of myocardial composition and, thus, of diastolic properties and LVFP might be mediated by changes in the coronary microcirculation. Microvascular damage of DM2 [ ] may lead to myocardial cell injury and reactive fibrosis/hypertrophy. Although focal microvascular alterations have not appeared sufficient to account for diffuse interstitial fibrosis [ ], these observations looked at structure but not dynamics of coronary microvessels. Today, the function of coronary circulation may be evaluated by transthoracic echocardiography, by visualizing the distal left anterior descending artery [ , ], and measuring CFR as hyperemic to resting velocities ratio [ , ]. CFR has excellent concordance with intracoronary Doppler flow wire-derived CFR, high feasibility, and reproducibility [ ]. In the absence of epicardial coronary stenosis, impaired CFR indicates coronary microvascular dysfunction [ ]. A reduction of CFR has been documented in both type 1 and 2 DM ( Figure 15.6 ) and appears as a direct consequence of elevated glycemia, as demonstrated by PET [ ]. An alternative explanation is insulin resistance, which alters CFR during cold pressure test, a completely endothelium-dependent stimulus [ ]. Endothelial function, another possible determinant of CFR, is impaired in early DM [ ]. Also, increased cardiac sympathetic activity may account for abnormal CFR in diabetics [ ].
15.2.3
The link of coronary microvascular and diastolic dysfunction in diabetes
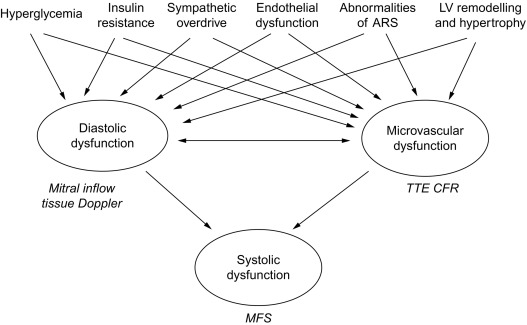
DD is evident in type 1 diabetics free of CAD when CFR impairment is also detectable [ ]. Similar relation between magnitude of CFR reduction and degree of myocardial DD was found also in uncomplicated hypertension without significant CAD [ ], This association is not surprising, since coronary flow occurs predominantly during diastole. Both reduced CFR and DD are associated with insulin resistance [ , ], LV concentric geometry [ , ], sympathetic nervous system disorders [ ], abnormalities of angiotensin–renin system [ ], and endothelial dysfunction [ ]. Therefore, coronary microvascular damage could play a mechanistic role for DD [ ] or even vice versa, considering DD as a main expression of myocardial fibrosis. Determinants of microvascular dysfunction in DM, such as hyperglycemia and insulin resistance, and factors including sympathetic overdrive, endothelial dysfunction, and LV concentric remodelling, also contribute to the development of DD. Systolic contractile failure may be a further consequence, due to impairment of both diastolic properties and coronary microcirculation ( Figure 15.7 ). A comprehensive transthoracic Doppler evaluation of diabetics should include, therefore, the assessment of diastolic function with estimation of LVFP by tissue Doppler, and of coronary microvascular function by CFR test. Analysis of the regional wall motion during stress would be required in patients with suspected CAD, another cause of DD.
15.3
Inotropic reserve in diabetic patients
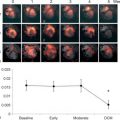
Further documentation of diabetic cardiomyopathy can be obtained by assessing the inotropic response to physical or pharmacological stress in uncomplicated diabetic patients. This issue has been investigated by using Doppler-derived strain rate (SR) imaging, a technique able to produce indexes strongly related to invasively determined myocardial elastance and, therefore, to inform on the real LV inotropic state [ ]. By using colour tissue Doppler, Fang and coworkers, 2003, demonstrated reduction at rest of longitudinal myocardial systolic velocities, and systolic SR [ , ] in multiple wall regions, in a sample of DM2 patients with normal EF and no evidence of CAD. The reduction of SR paralleled increased myocardial density derived by integrated backscatter, indicating interstitial fibrosis. The reduced increment of SR (and strain) at increasing dobutamine stage indicates altered myocardial inotropic reserve in diabetics free of CAD.
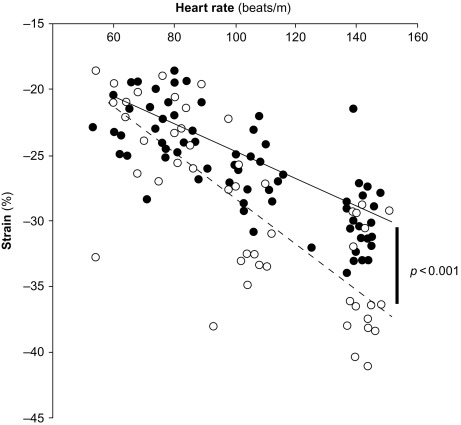
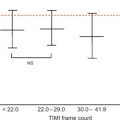
Myocardial contractility can be studied also by assessing variations of pressure/volume relation at increasing heart beating, i.e., the force–frequency relation [ ]. This “force–frequency relation” has been shown to be blunted in isolated myocardial strips of DM2 patients [ ]. In a study of [ ], “regional” (septal) strain–frequency relation, built by plotting all together individuals values of heart rate (HR) and strain both at rest and during dobutamine (low and high doses), simulated a “global” force–frequency relation: HR and strain were closely related in diabetics as in controls, but the slope of the relation was significantly blunted in diabetics, demonstrating that HR increase is unable to track a normal increment of contractility in the diabetic heart ( Figure 15.8 ). It is conceivable that underlying alterations of coronary microvessels, recognized in diabetic patients, might be responsible for their reduced inotropic response to stress [ ].
The incidence of CAD in patients with diabetes is known to be higher than in non-diabetic patients. While the systematic evaluation of these patients is performed by echocardiography, CMR has been proven to have adjunctive value as it allows the detection of unexpected areas of myocardial necrosis by LE technique. The presence of unknown and clinically silent myocardial infarction heavily influences the prognosis of these patients and justifies a more aggressive diagnostic and therapeutic approach.
Diabetic patients are more prone to atherosclerosis and have more CAD, which may stay subclinical longer due to blunted symptomatology. Accordingly, Cardiac CT could be used for early detection of CAD in the absence of symptoms.
15.4
Metabolic syndrome
Obesity, insulin resistance, GI/type 2 diabetes, hypertension, pro-inflammatory state, and prothrombotic state are clustered in the metabolic syndrome (MS), representing critical risk factors for increased incidence of cardio–cerebro-vascular diseases [ ]. Abdominal obesity is the form of obesity most strongly associated with the MS. Insulin correlates univariately with the risk of developing cardiovascular diseases (CVD). Patients with longstanding insulin resistance frequently manifest GI, which might evolve into diabetes-level hyperglycemia. Elevated blood pressure strongly associates with obesity and commonly occurs in insulin-resistant persons. Hypertension thus commonly is listed among metabolic risk factors, even if it is multifactorial in origin.
The presence of dyslipidemia, such as raised triglycerides, low concentrations of HDL cholesterol, increased remnant lipoproteins, elevated apolipoprotein B, small LDL particles, and small HDL particles can also be found.
Finally, a pro-inflammatory state, represented by elevated serum C-reactive protein, is commonly present in persons with MS. Obesity itself is supposed to play a determinant role as excess adipose tissue releases inflammatory cytokines that may elicit higher serum C-reactive protein levels. Some patients manifested a pro-thrombotic state, characterized by increased plasma plasminogen activator inhibitor-1 and fibrinogen. Fibrinogen rises in response to a high-cytokine state.
MS is associated with a 2-fold increase in the relative risk of coronary heart disease and stroke events [ ]. Recently, MS has also been linked to increased prevalence of aortic valve calcification [ , ], faster progression of calcific aortic stenosis [ ], increased arterial stiffness [ ], and faster degeneration of aortic bioprosthetic valves [ ]. Moreover, recent experimental studies [ , ] reveal that, among animals with sustained pressure overload, those with insulin resistance induced by a high carbohydrate/high-fat diet have more severe LVH and dysfunction compared with animals fed with a standard diet. These findings suggest that not only valvular lesion, but also LV remodelling and function might be negatively influenced by the MS.
With regard to echocardiographic parameters, hypertensive patients with MS exhibited higher LVM (even normalized by BSA), RWT, left atrial size, and greater prevalence of LVH, lower mid-wall fractional shortening, and a longer E -wave deceleration time than subjects without MS. These results were independent from other variables such as age, gender distribution, severity and duration of hypertension, and previous anti-hypertensive therapy. In particular, after adjustment for these covariates, the likelihood of LVH was 2.89-fold higher in subjects with MS than in those without it, when LVM was indexed by height 2.7. Moreover, it is noteworthy that the relationship between MS and LVM was confirmed in multivariate regression models including MS together with its individual components, as independent variables; this suggests that MS may have a deleterious effect on cardiac structure over and above the potential contribution of each single component of this syndrome, and that the confluence of abnormalities that comprise MS may have a synergistic negative impact on LVM independently from patients with or without hypertension are considered [ , ]. In the Strong Heart Study, a longitudinal investigation conducted in American-Indian communities, a subset of the study population, including 1436 non-diabetic participants without prevalent CVD (61.2% of which had high BP), was examined to analyse the impact of the MS on cardiac structure and function. Subjects with MS showed greater LV dimension, mass and RWT, and left atrial diameter, and a higher prevalence of LVH, with lower mid-wall shortening than those who did not have MS [ ]. Cuspidi et al. [ ], in untreated middle-aged hypertensives, found that patients with MS had a more pronounced cardiac and extra-cardiac involvement than those without it. For example, the latter might be explained by insulin resistance and the accompanying compensatory hyperinsulinaemia, which are regarded as the patho-physiological key features underlying the MS [ ]. Despite conflicting results [ ], it is believed that the trophic effects of insulin on myocardial could be mediated, at least in part, by the insulin-like growth factor-1 receptors [ ]. It has also to be considered that insulin may affect LVM indirectly by increasing sodium retention [ ] or endothelin-1 levels [ ] or by inducing sympathetic activation [ ] or by biological mediators of LVH, such as angiotensin II secreted from white adipose tissue, a potent growth factor in myocardial tissue [ ], and leptin, whose mitogenic effect in cardiomyocytes has been recently evaluated with discrepant conclusions [ ].
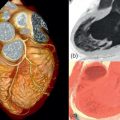
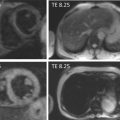
Considering these pathologic aspects, there are several findings, which are currently investigated by imaging techniques such as cardiac volumes, mass, systolic and diastolic function, arterial intima thickness, etc. While echocardiography is routinely used to evaluate these aspects, it is notable that some other measurements are noteworthy for a better comprehension of the disease itself. Namely, the measurement of epicardial and pericardial fat by echo or more efficiently by MRI suggests new insights on the disease and its intrinsic mechanisms [ ] ( Figure 15.9 ).
In patients with high likelihood of CAD, myocardial perfusion abnormalities at gated single-photon emission computed tomography (g-SPECT) are associated with a poor prognosis [ ]. In fact, the annual risk of cardiac death or non-fatal myocardial infarction is < 1% in the case of a normal stress g-SPECT, whereas the risk increases up to 8% with an increasing degree of perfusion abnormalities. Furthermore, the magnitude of perfusion abnormalities is the single most important indicator of an unfavourable outcome and provides independent and incremental information within respect to clinical, stress electrocardiographic, and coronary angiographic findings [ ]. In this scenario, and in the view of using SPECT to predict CAD, reversible myocardial perfusion defects in patients without significant coronary stenoses are regarded as a “false-positive” result. Although these false-positive defects occur in a low number of patients studied by g-SPECT [ , ], their physiological meaning and prognostic implication are very important.
A functional and/or structural impairment in coronary microcirculation is a possible interpretation of these findings. Zeiher et al. [ ] showed that an endothelial dysfunction of coronary microcirculation is associated with a high incidence of reversible defects at stress myocardial perfusion imaging in the absence of coronary stenosis. According to these authors, this feature may represent a stenosis-independent abnormality in blood flow distribution rather than the effect of technical artefacts. An abnormal flow reserve has been documented using PET in the myocardium of hypertensive patients in the absence of coronary stenosis [ ] and has been attributed to the hypertrophy of the tunica media of small resistance vessels. Abnormalities in coronary blood flow and reserve have also been observed using PET in the myocardium perfused by normal coronary arteries of patients with coronary stenoses in remote vessels [ ]. Furthermore, a reduction in coronary blood flow reserve has been documented in diabetic patients with angiographically normal coronary arteries by intra-coronary Doppler [ ], trans-esophageal Doppler echocardiography [ ], and PET [ ]. In addition, the angiography was normal in 11–63% of diabetics with positive perfusion studies [ ]. Abnormal values of myocardial blood flow have also been found in patients with dilated cardiomyopathy [ ]. Finally, patients with chest pain and reversible myocardial perfusion defects at stress SPECT, but without obstructive CAD, have lower flow-mediated dilation, that is indicative of endothelial dysfunction, as compared with the patients with normal myocardial perfusion findings [ ]. In agreement with the above studies, stress-induced myocardial perfusion abnormalities observed by g-SPECT in patients with normal or near normal coronary arteries can reflect a functional and/or structural impairment in coronary microcirculation. As a matter of fact, the correlation between CV risk factors and the extent of perfusion defects was very close. In this view, exposition to multiple risk factors could favour the development of coronary microvascular alterations that would be at the basis of “false” myocardial perfusion scans, as showed by a previous study [ ] in which coronary blood flow and reserve were quantified in patients with normal epicardial coronary arteries by myocardial contrast echocardiography and by intra-coronary Doppler.
Finally, the “real” nature of myocardial perfusion defects in the absence of coronary stenoses is suggested by the effect of perfusion abnormalities on event-free survival. Although the prognosis of patients with normal coronary arteries is good, an extensive myocardial perfusion abnormality after stress was indicative of a slightly worsened outcome. A further suggestion of the “real” nature of perfusion abnormalities is the substantial concordance of the site of coronary lesions in the follow-up with respect to the location of early perfusion defects [ ]. Finally, similar results were obtained by stress echocardiography in a group of 457 patients with angiographically non-significant stenoses and preserved LV function [ ]: the 7-year survival was worse in those patients with “false” positive test compared to those with a true negative test.
Related posts:

Stay updated, free articles. Join our Telegram channel

Full access? Get Clinical Tree


