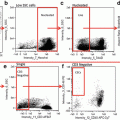
Fig. 1
Dotplots from FACSAria II. THP1 cells treated with TRAIL, 100 ng/ml for 20 h. (a) FSC-W versus FSC-H, region P1 denotes singlet events. (b) FSC/SSC plot. (c) TMRE/Sytox blue plot, P2 TMRE positive cells, P4 Sytox Blue-positive (dead) cells. (d) TMRE/Annexin V plot, P5 Annexin V-positive cells. (e) TMRE/caspase 3/7 plot, P3 caspase-positive cells. (f) Annexin V/caspase plot. (g) Sytox Blue/caspase 3/7 plot. (h) Sytox Blue/Annexin V plot
2 Materials
2.1 Tissue Culture Medium
RPMI-164 supplemented with l-glutamine, antibiotics, and 10 % fetal bovine serum (FBS). Complete culture medium is stored at +4 °C.
2.2 TMRE (Tetramethyl-rhodamine, Ethyl Ester) Solution
Stock solution should be prepared at a concentration of 50 μM in DMSO and could be stored at room temperature. Final concentration of TMRE depends on the particular cell type and is in the range of 10–100 nM.
2.3 Caspase 3/7 Sensor
CellEvent™ Caspase 3/7 Green reagent is purchased from Life Technologies Inc. (Grand Island, NY, USA) and stored at the room temperature (in the dark) (see Note 1 ).
2.4 Annexin V
Annexin V conjugated with Alexa-647 is used for the current protocol. Stock solution is stored at +4 °C in the dark (see Note 2 ).
2.5 Annexin V Binding Medium
To obtain strong signal from Annexin V high concentration of Ca++ is required. It is achieved by adding CaCl2 from stock solution (500 mM) to the culture medium. CaCl2 stock solution is prepared in sterile deionized water and stored at room temperature.
2.6 Sytox Blue (SB)
This dye cannot penetrate plasma membrane so it is only staining nuclei in the cells with disrupted membrane. Sytox Blue can be purchased from different vendors. For our purposes, we used SB from a stock solution of 1 mM in DMSO. Stock solution is kept at +4 °C for indefinitely long time.
3 Methods
This procedure is typically performed in 5 mL polystyrene round-bottom FACS sterile tubes with caps using 0.5–1 ml of cell suspension. For ImageStream analysis 50–70 μl of stained suspension is taken. The optimum concentration for imaging flow cytometry analysis is ~5 × 10⁶ cells per 1 mL volume. If cell concentration is significantly less, larger volume might be recommended. When large files obtained by imaging flow cytometry are necessary, cells are concentrated two- to fivefold immediately before ImageStream analysis. Microcentrifuge tubes are used for ImageStream analysis. Special staining for ImageStream in 1.5 mL microcentrifuge tubes should be avoided, since small volume does not guarantee cell viability for long enough time (see Note 3 ).
3.1 Cell Preparation
1.
Harvest cells—use lab-specific procedures for corresponding cell lines or primary cell isolations. Harvesting procedures will vary greatly depending on cell type (e.g., if cell is adherent or non-adherent). Cell suspension is finally prepared in culture medium.
2.
Centrifuge samples at 400 × g for 4–5 min at room temperature and decant the supernatant. This speed is sufficient to pellet most suspension cell lines. If the cell of interest requires different centrifugation parameters, modify as required (see Note 4 ).
3.
Resuspend cells in ~0.5 mL of fresh culture medium to achieve concentration of 1–2 × 10⁶ cells per ml.
3.2 TMRE and Caspase 3/7 Staining
1.
Add TMRE from stock solution at a final concentration 50–100 nM. Typical stock solution is 50–100 μM in DMSO.
2.
Add caspase 3/7 reagent—one drop per 0.5 ml is recommended, proper concentration could be titrated.
3.
Place vial with cells into CO2 incubator (37 °C) for 30 min.
3.3 Application of Annexin V Stain
1.
Add CaCl2 from the stock solution to the sample to achieve final concentration of 3 mM (see Note 5 ).
2.
Add Annexin V according to the manufacturer’s recommendations (e.g., 5 μL Annexin V-Alexa Fluor 647 if using from Life Technologies). The volume might vary depending on the supplier.
3.
Incubate tubes in the dark for 15 min at room temperature (not less than 23 °C) or in CO2 incubator (37 °C).
3.4 Application of Sytox Blue Stain
1.
Add ~0.5 μl Sytox Blue to the sample and take sample for analysis within 2 min.
3.5 Acquisition and Analysis: Flow Cytometry Platform
The analysis procedure described below is based on acquisition with a FACS Aria cells sorter (Becton Dickinson) and analyzed with FACSDiva software. It could be performed in the similar way with any instrument equipped with 405/407, 488, 561, and 635/640 lasers. Consequently caspase 3/7 is viewed in FITC channel (bandpass 530/30), TMRE in PE channel (yellow–green laser; bandpass 575/25), Sytox Blue in Pacific Blue channel (bandpass 450/50), and Annexin V-Alexa 647—in APC channel (bandpass 660/20) (see Note 6 ).
1.
2.
Set forward scatter and side scatter parameters to visualize debris. To analyze, gate on cell population based on forward scatter width and height parameters to exclude debris and cell doublets.
3.
Data analysis is performed in a standard way for flow cytometry. It is important to notice that intensity of staining (particularly for TMRE and caspase substrate) might be heterogeneous in the entire population and populations with intermediate intensity of staining represent certain stages of apoptotic execution (see Note 10 ).
3.6 Acquisition and Analysis Using ImageStream Platform
The analysis procedure described below is based on the ImageStream X Mark II platform and IDEAS software (Amnis Corporation, EMD Millipore). Original (uncompensated) images acquired with an ImageStream™ are stored in a raw image file (*.rif). Single-stained controls are used to produce a compensation matrix (stored as *.ctm file) and, subsequently, compensated image files (*.cif) are generated. Data analysis is performed using *.cif file and saved as *.daf file.
1.
2.
Switch off bright-field channel and adjust laser power to achieve a bright signal without saturated pixels for each channel. Acquire at least 200 bright images for each compensation control and create compensation matrix (*.ctm file). Compensation matrixes can be stored and applied to other data files employing the same probes and acquired with same lasers power (see Notes 11 and 13 ).
3.


Acquire your samples. At least 5000 events should be acquired (10–20 K events is preferable). Recording files containing more than 20,000 pictures should be avoided, since post-acquisition processing of large files is rather slow.
Stay updated, free articles. Join our Telegram channel

Full access? Get Clinical Tree


