Fig. 1.1
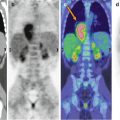
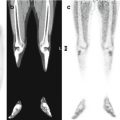
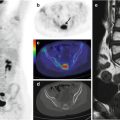
Coronal CT (a), PET (b), and PET/CT fusion (c) images and (d) maximal intensity projection (MIP) show the physiological biodistribution of 18F-FDG (Discovery ST-E PET/CT system, General Electric Healthcare, Milwaukee, WI. Images collected 60 min after intravenous injection of 18F-FDG. At the time of the tracer injection, the patient had fasted for over 6 h, and his glucose blood level was 94 mg/dl. The data was acquired in 3D mode, with attenuation correction calculated by coregistered CT images)
References
1.
Shepherd PR, Kahn BB (1999) Glucose transporters and insulin action: implications for insulin resistance and diabetes mellitus. N Engl J Med 341:248–257PubMedCrossRef
Stay updated, free articles. Join our Telegram channel

Full access? Get Clinical Tree


