Age at identified
Year
All years
1999
2000
2001
2002
2003
2004
2005
2006
2007
2008
Incidence rate/100,000 person-years
−20
0.18
0.18
0.00
0.19
0.49
0.20
0.20
0.00
0.11
0.32
0.19
20–29
1.43
0.78
1.08
1.22
2.48
1.12
1.82
1.36
1.23
1.41
1.39
30–39
1.97
2.62
2.37
1.85
3.45
3.96
4.10
3.54
3.25
2.41
2.95
40–49
2.42
2.98
4.44
3.62
6.76
2.94
4.24
4.86
4.83
3.31
4.04
50–59
2.25
2.96
2.15
2.94
6.20
4.23
4.90
5.04
4.55
4.17
3.94
60–69
2.52
2.34
2.59
2.56
4.92
3.51
4.34
4.25
3.44
3.43
3.39
70–79
1.04
1.30
2.18
1.63
4.55
3.34
4.89
4.91
3.98
2.50
3.03
80–
0.54
2.15
1.45
0.00
0.44
1.65
2.89
2.58
2.80
2.67
1.72
Crude rate
1.54
1.91
2.03
1.75
3.66
2.62
3.42
3.32
3.02
2.53
2.58
Age-adjusted rate
1.56
1.80
1.92
1.81
3.71
2.57
3.26
3.18
2.89
2.43
2.51
6.3 Other Data on the Incidence of Osteonecrosis
The Research Committee on Idiopathic Avascular Necrosis of the Femoral Head was established in 1975. The committee has reported five nationwide surveys on the prevalence of ON in Japan, which showed an annual increase. The prevalence was 6,700–8,200 (95 % confidence interval) in 1994 [8] and 10,100–12,800 (95 % confidence interval) in 2004 [9].
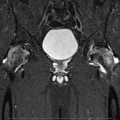
Previously, the incidence of nontraumatic or steroid-associated ON has been reported in disease-limited populations, such as systemic lupus erythematosus (SLE), organ transplantation, and sickle cell disease. Those reported data are summarized in Table 6.2. For example, in SLE patients, an MRI study showed the incidence of ONFH to be 31.1 % (14 of 45 patients) in 1 year [10], while in renal allograft recipients, osteonecrotic changes on MRI have been detected in 25.5 % of the patients (13 of 51 patients) [11].
Table 6.2
Reported incidence of nontraumatic ON of the femoral head
Population | Reference | Year of publishing | Diagnostic method | No. of people | Incidence (per 100 person-years) |
|---|---|---|---|---|---|
SLE (high dose) | Nakamura et al. [12] | 2010 | MRI | 169 | 34.6 |
Nagasawa et al. [10] | 2005 | MRI | 45 | 31.1 | |
Oinuma et al. [13] | 2001 | MRI | 72 | 44.4 | |
(Low dose)
Stay updated, free articles. Join our Telegram channel
Full access? Get Clinical Tree
 Get Clinical Tree app for offline access

|

