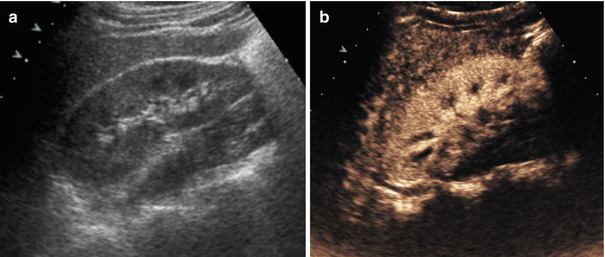
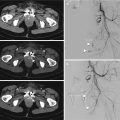
Fig. 24.1
Young male. Kick on left flank, subcapsular renal hematoma. (a) Baseline ultrasound (US) shows a hyperechoic oval pseudo-mass imprinting the renal profile. (b) Contrast-enhanced ultrasound (CEUS) depicts subcapsular hematoma well
The findings of abdominal lesions on CEUS are similar to those of CE-CT. On CEUS images, parenchymal traumatic lesions appear as a perfusion defect represented by a hypoechoic area, which persists unchanged during all the acquisition phases, with poorly defined or well-defined margins with or without interruption of the anatomic profile of the capsule of a solid organ [14].
- (a)
- (b)
- (c)
- (d)
Focal hyperechoic spots within the lesion represent the presence of microbubbles of contrast medium and indicate active intralesional bleeding. If the microbubbles are arranged along the lacerated organ, the resultant outline is identified as a sign of intraperitoneal or retroperitoneal active bleeding.
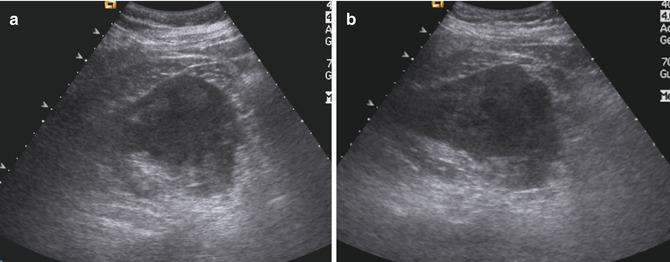
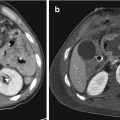
Fig. 24.2
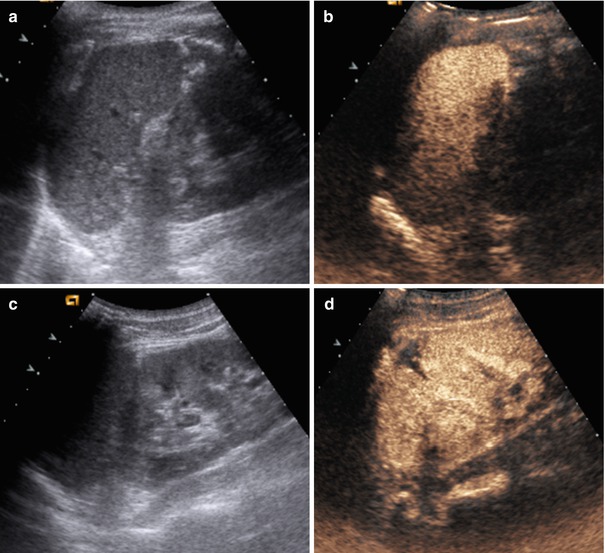
Car accident. (a, b) Patient with acute urinary retention. On baseline US, in the left kidney there is a solid hypoechoic mass, non-homogeneous, of approximately 8 cm, which compresses the renal profile
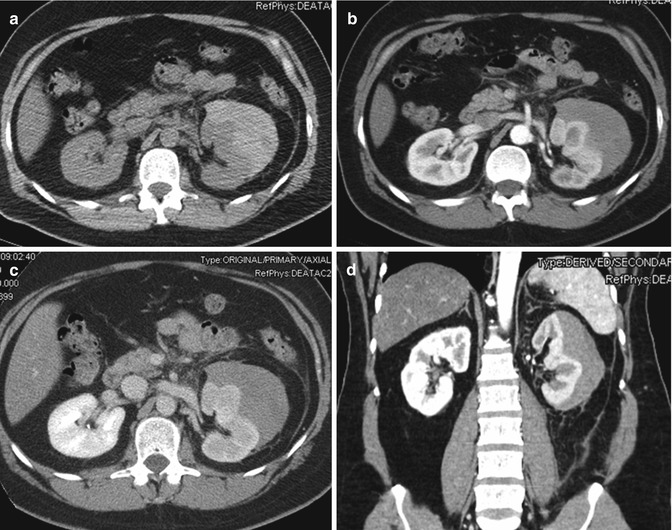
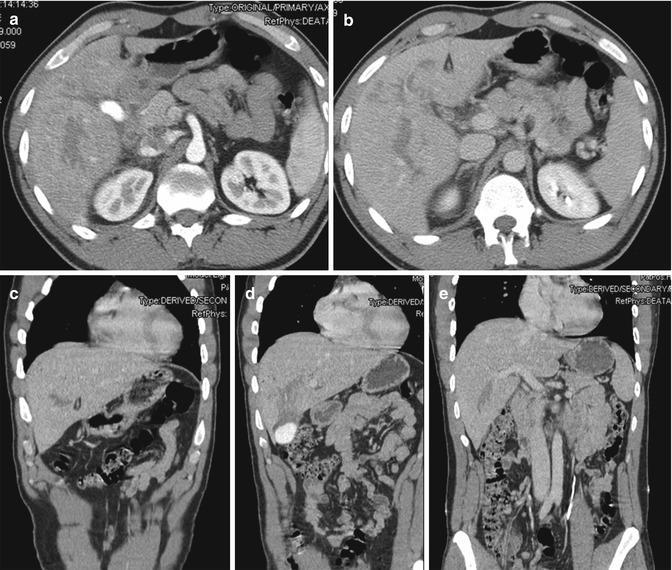
Fig. 24.3
Same patient as Fig. 24.2. Multi-detector computed tomography (MDCT) performed on same day shows a large subcapsular hematoma in the left kidney, with parenchymal compression and delayed contrast medium elimination. There are no signs of active vascular disease. (a) Nonenhanced CT shows hyperdense mass compressing the renal profile. (b–d) Contrast-enhanced CT scan shows a renal hematoma that appears hypodense as well as the contiguous renal parenchyma
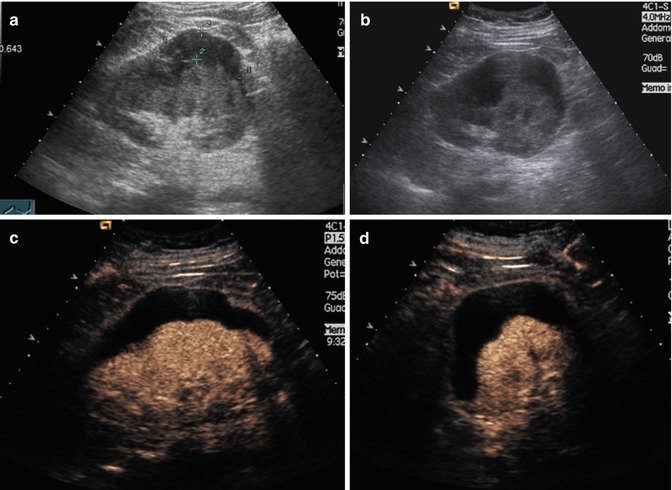
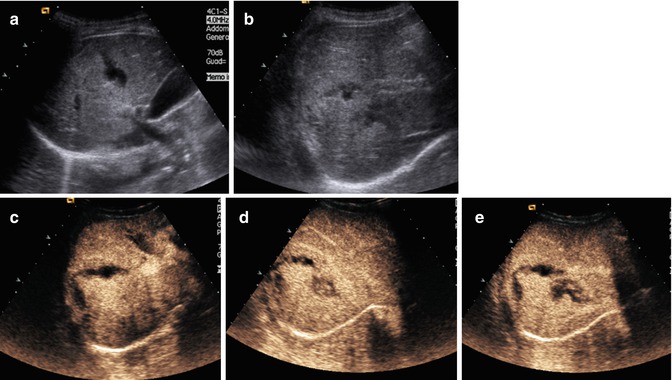
Fig. 24.4
Same patient. Follow-up examination 5 days later. Baseline US (a, b) shows a slight reduction in hematoma thickness (about 6 cm), that is much better seen with CEUS (c, d)
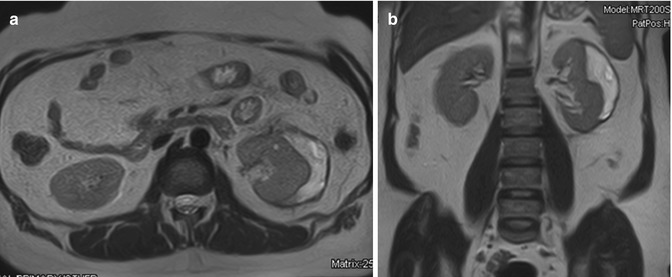
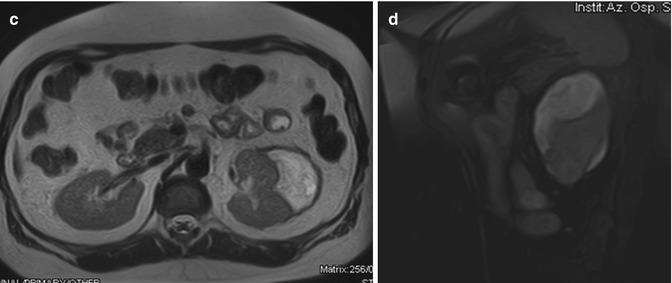
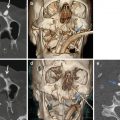
Fig. 24.5
Same patient. Follow-up magnetic resonance imaging (MRI) 1.5 months later: Compared to previous controls, there is a further significant reduction in the subcapsular hematoma thickness of the left kidney. HASTE T2-weighted sequences axial (a) and coronal (b); fat-sat VIBE T1-weighted sagittal scan (c). The hematoma appears hyperintense with some small hyperintense areas inside resulting from the different stages of the degradation of hemoglobin
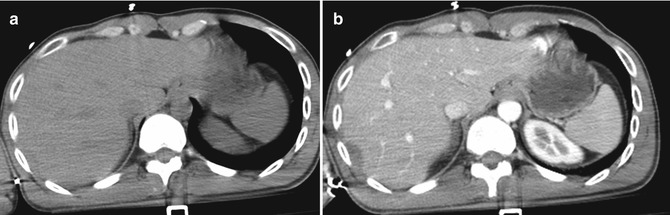
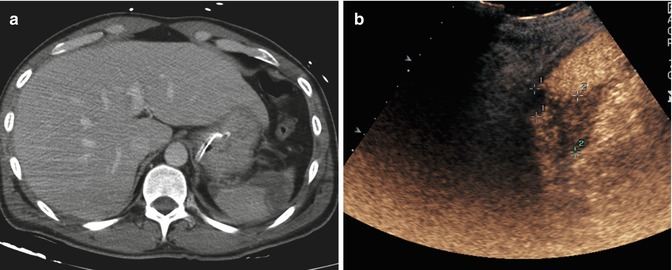
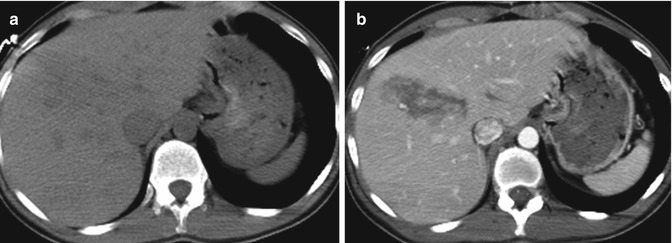
Fig. 24.6
Male. Car accident. Subcapsular hepatic hematoma. (a) Nonenhanced CT shows a slightly hyperdense subcapsular hepatic area. (b) Contrast-enhanced CT depicts well the same zone as a subcapsular hepatic hematoma
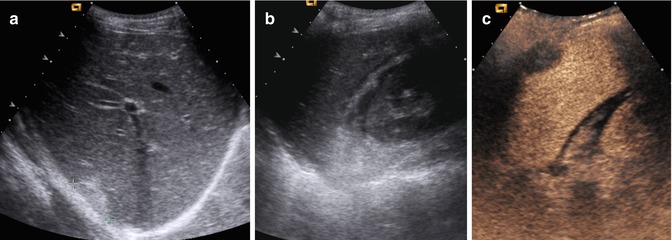
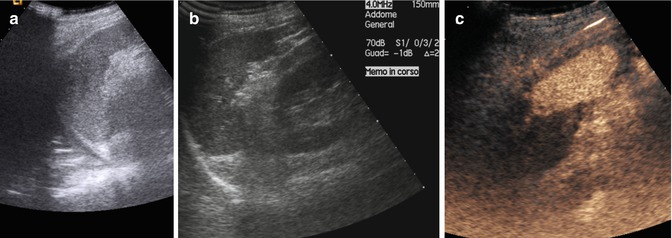
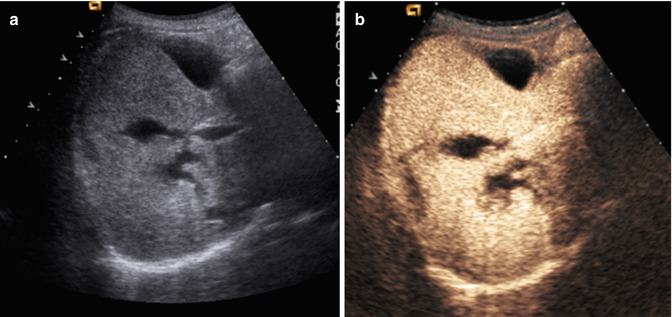
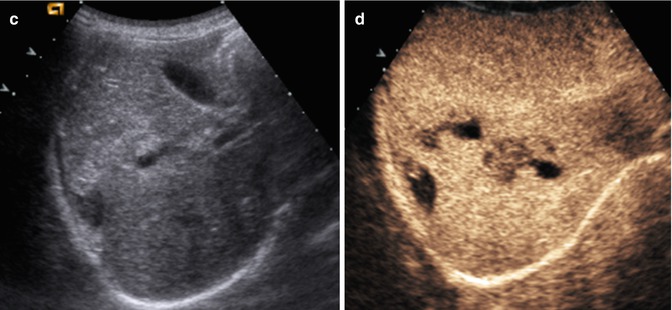
Fig. 24.7
Follow-up examinations with US and CEUS. (a, b) Baseline US shows a hyperechoic subcapsular lenticular area. (c) CEUS depicts the subcapsular hematoma well. Free fluid in the Morrison space is shown well on both US and CEUS
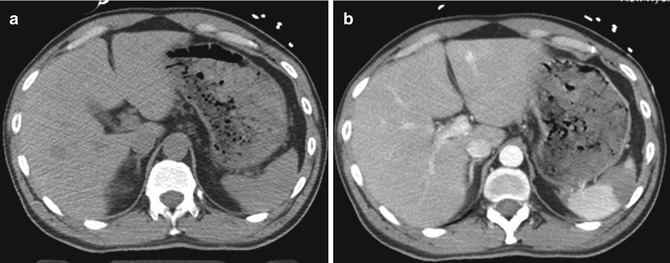
Fig. 24.8
Deep splenic hematoma, not appreciable in nonenhanced CT (a), is well defined in contrast-enhanced CT (b)
Fig. 24.9
Follow-up 3 days later. Contrast-enhanced CT (a) and CEUS (b) depict well a laceration area of the lower spleen pole, contacting the splenic capsule
Fig. 24.10
Follow-up examinations, 1 week later. At the US baseline (a, b), the spleen seems normal. With CEUS (c), the persistence of splenic injury is evident
Fig. 24.11
A 16-year-old girl who fell from a scooter (a, b). Baseline US shows a fuzzy hyper-echogenic area at the VIII and V liver segments
Fig. 24.12
CEUS (a–d) appreciates several lacero-contusive areas surrounded by nonhomogeneous parenchyma; these areas are poorly defined
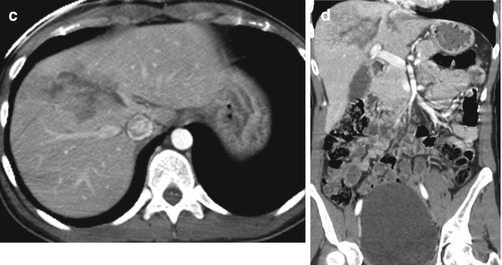
Fig. 24.13
Contrast-enhanced CT (a–d) confirms the lesions demonstrated by CEUS
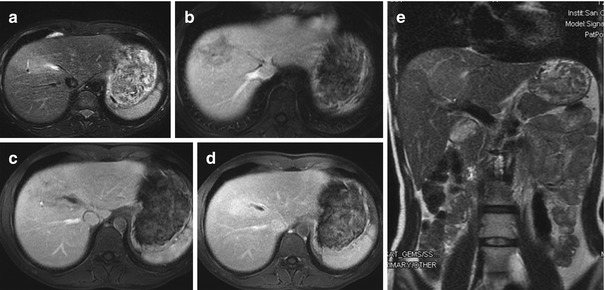
Fig. 24.14
Follow-up with MRI 20 days later (a–e). The lesion described at CEUS and CT at the VIII–V liver segment appears dimensionally reduced, and it is associated with an adjacent area of altered perfusion
Fig. 24.15
Trauma on the right flank, double traumatic lesion of the right kidney. (a) Baseline US is negative for traumatic kidney lesions. (b) CEUS shows well a traumatic lesion of the right kidney and a thin fluid collection surrounding the kidney
Fig. 24.16
CT (a, b) confirms right renal parenchymal lesion with peri-renal fluid collection
Fig. 24.17
Follow-up examination 1 month later. (a) US shows a marked improvement in the parenchymal lesion and the complete disappearance of peri-renal fluid. (b) CEUS best depicts both data
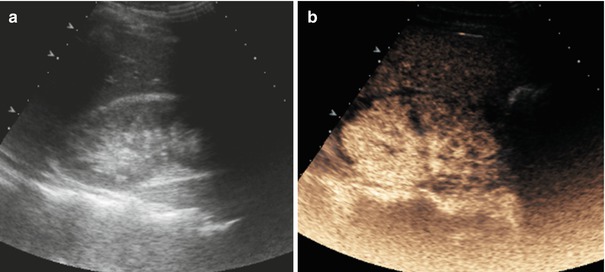
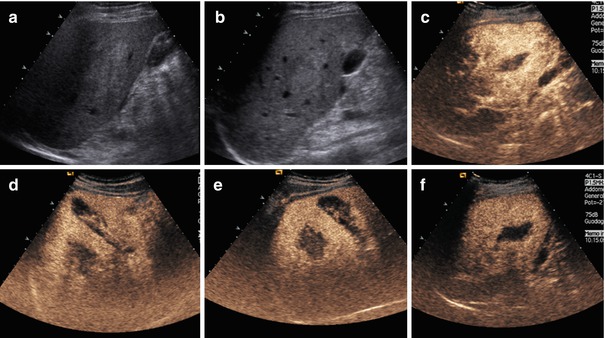
Fig. 24.18
(a, b) Baseline US shows only a diffuse hyper-echogenicity affecting the right lobe. (c–f) CEUS depicts well a large irregular lacerative lesion of the right lobe of the liver, reaching the capsular surface
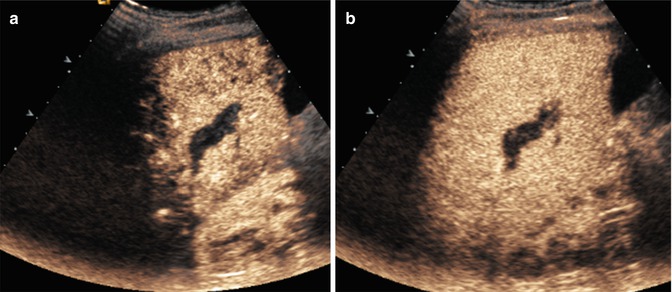
Fig. 24.19
Follow-up with CEUS, 5 days later (a, b). Lesion appears considerably reduced in size
Fig. 24.20
Contrast-enhanced CT (a–e) confirms the size of the injuries depicted by CEUS
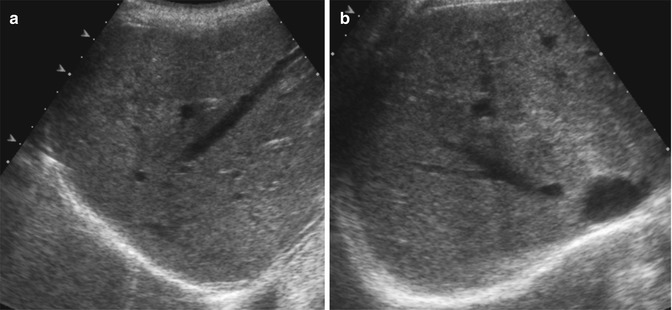
Fig. 24.21
Hepatic laceration. (a, b) Baseline US shows a parenchymal laceration of the right lobe that reaches the capsule. (c–e) CEUS better depicts the morphology and size of the laceration
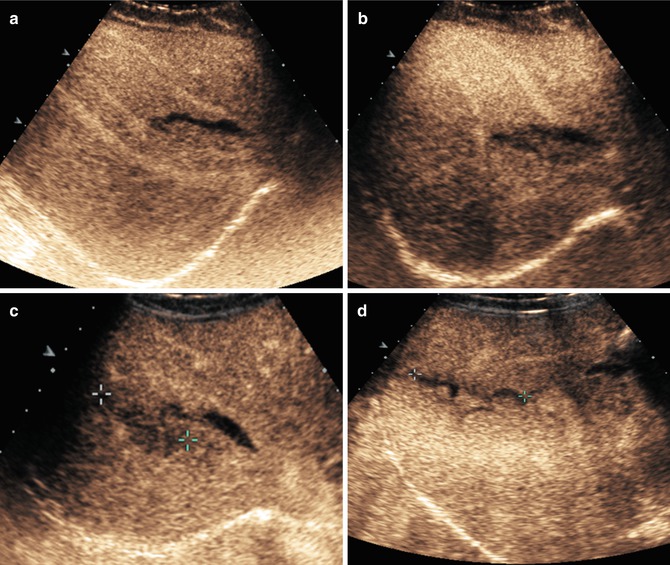
Fig. 24.22
Follow-up with US and CEUS after 2 and 6 days. (a, b) After 2 days, US baseline and CEUS imaging are essentially unchanged. (c, d) After 6 days, however, the lesion is better circumscribed than on the previous examination and the surrounding parenchyma is more regularly perfused
Fig. 24.23
Follow-up with MRI after 1 month. In HASTE T2-weighted images (a, b) and VIBE T1-weighted images (c–g) after contrast media administration, the results of the right lobe laceration are still apparent, with persistent linear parenchymal hypointensity, reaching the capsule, that appears thickened. There is still a thin, peri-hepatic fluid collection, best seen in T2 images
Fig. 24.24


Car accident (a–d). Splenic laceration and small laceration of the upper left kidney. Baseline US (a, c) shows slight hyper-echogenicity of the spleen and of the upper lobe of the kidney. CEUS (b, d) depicts well a small splenic laceration of the lower splenic pole and a hypo-echoic area of the upper pole of the left kidney
Related posts:
Stay updated, free articles. Join our Telegram channel
Full access? Get Clinical Tree
