Fig. 10.1
Classification of common incidental bone lesions according to signal intensity on STIR images
10.2.1.1 Tumorlike Bone Lesions
10.2.1.1.1 Juvenile/Solitary Bone Cyst
Juvenile or solitary bone cysts are tumorlike lesions of unclear etiology (Table 10.1). They are sharply demarcated and contain fluid, making them appear bright on T2-weighted images (Fig. 10.2). On T1-weighted images, these cysts have intermediate to low signal intensity. Complications such as pathologic fracture or intralesional hemorrhage may result in an inhomogeneous appearance. Fluid levels or septa may also be present. Thinning of surrounding bone is common. A contrast-enhanced examination is only necessary in cases where a solid lesion cannot be ruled out with certainty. Simple bone cysts typically do not enhance (Lokiec and Wientroub 1998).
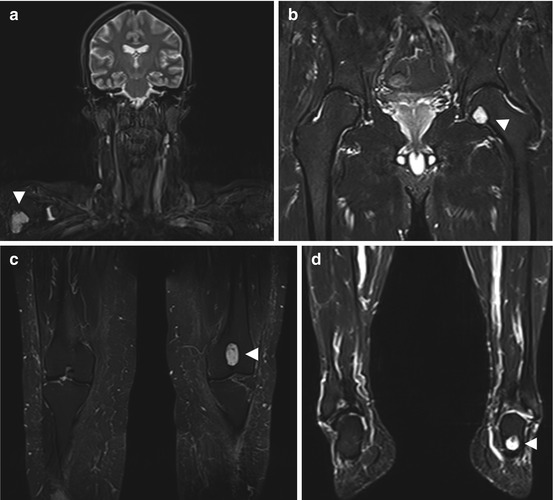
Table 10.1
Juvenile/solitary bone cyst
Prevalence | 3 % of all primary bone lesions |
Age predilection | Occurs at any age, most commonly between 10 and 20 years |
Sex predilection | M:F ratio of 2–3:1 |
Location | Typically metaphyseal, may extend to diaphysis |
60–80 % humerus and femur | |
20–40 % calcaneus, talus, iliac bone | |
Type of lesion | Benign |
Signs and symptoms | Asymptomatic incidental finding |
Pathologic fracture (66 %) | |
Differential diagnosis | Aneurysmal bone cyst, enchondroma, nonossifying fibroma |
Fig. 10.2
Incidental screening findings (STIR). Solitary bone cysts (arrowheads) in different locations: in the right humeral head in a 46-year-old female subject (a), in the left femoral head in a 52-year-old male subject (b), in the left distal femoral metaphysis in a 43-year-old female subject (c), and in the left calcaneus in a 65-year-old male subject (d)
Clinical Management
Solitary bone cysts are benign lesions with no risk of malignancy. They usually stop growing with skeletal maturity and require no further diagnostic evaluation (Lokiec and Wientroub 1998).
10.2.1.1.2 Intraosseous Hemangioma/Lipoma
Hemangiomas are benign tumors composed of small blood vessels that are commonly found in the vertebral bodies (Table 10.2) but also occur in the appendicular skeleton (Rigopoulou and Saifuddin 2012). The vascular components have high T1 and T2 signal intensity, while thickened trabeculae have low signal intensity (Fig. 10.3). The thickened trabeculae are typically oriented vertically, resulting in a corduroy appearance on sagittal images and a polka dot pattern on axial images (Friedman 1996). A fat-suppressed pulse sequence allows differentiation of intraosseous hemangioma from lipoma, which has the same signal intensity as subcutaneous fat (Fig. 10.4) (Williams et al. 1993; Blacksin et al. 1995). Following IV injection of contrast medium, the vascularized components of a hemangioma enhance strongly, while a lipoma does not enhance at all (Williams et al. 1993; Blacksin et al. 1995).
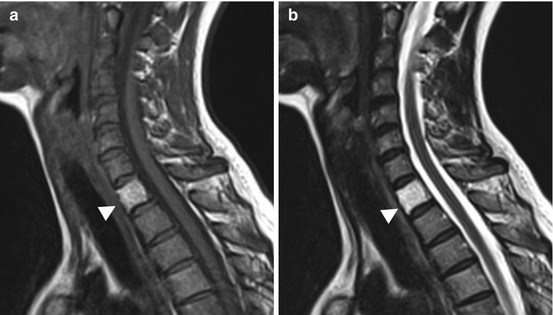
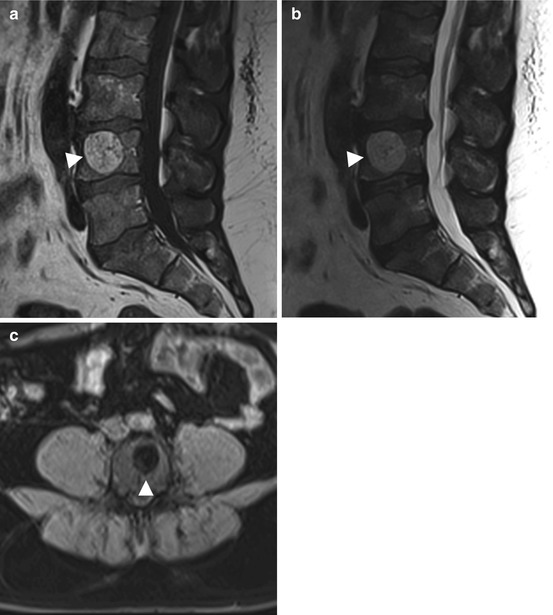
Table 10.2
Intraosseous hemangioma/lipoma
Hemangioma | Lipoma | |
|---|---|---|
Prevalence | 10 % | 0.1 % |
Age predilection | Occurs at any age, with a peak at ages 20–60 | 5–75 years |
Sex predilection | M:F ratio of 1:1.5–2 | M:F ratio of 1:1 |
Location | Spine, 28 % | Metaphysis of long bones, 60 % |
Skull, 20 % | Calcaneus | |
Ribs, clavicle, mandible | Ribs | |
Long bones | Pelvis | |
May be multifocal | Spine | |
Type of lesion | Benign | Benign |
Signs and symptoms | Asymptomatic incidental finding | Asymptomatic incidental finding |
Rarely pathologic fracture, spinal compression syndrome | Pain, swelling |
Fig. 10.3
Incidental screening finding. Vertebral hemangioma in a 45-year-old male subject. The hemangioma (arrowhead) involves the entire vertebral body, which has high signal intensity on sagittal T1w TSE image (a) and sagittal T2w TSE image (b)
Fig. 10.4
Incidental screening finding. Intraosseous lipoma (arrowhead) in L4 in a 65-year-old subject. The lesion has the same signal intensity as fat on all pulse sequences, i.e., high signal intensity on T1w (a) and T2w (b) images (both sagittal TSE) and low signal intensity on fat-suppressed image (axial T1w TSE) (c)
Clinical Management
When a small asymptomatic lipoma or hemangioma is detected, no diagnostic or therapeutic procedures are required. Malignant transformation has not been described for hemangioma and is extremely rare in lipoma. Lesions that are symptomatic or pose a risk of pathologic fracture can be treated by curettage and bone grafting.
10.2.1.2 Cartilage-Forming Bone Tumors
10.2.1.2.1 Osteochondroma (Osteocartilaginous Exostosis)
Osteochondroma is a sessile or pedunculated bone tumor composed of normal cortical and medullary bone (Table 10.3). It is typically contiguous with the cortex and medullary cavity of the underlying parent bone (Fig. 10.5a, b), and its bony portions have the same signal intensity as the parent bone (Fig. 10.5c, d) (Greenspan 1989; Unni 2001). Osteochondromas have an overlying hyaline cartilage cap approx. 1 – 3 mm in thickness. The cap has the characteristic MR signal intensity of well-differentiated cartilage tumors, i.e., intermediate signal intensity on T1-weighted images and very high signal intensity on T2-weighted images (Fig. 10.5d). The cap is often surrounded by a delicate band of low signal intensity, which corresponds to perichondrium (Mehta et al. 1998).
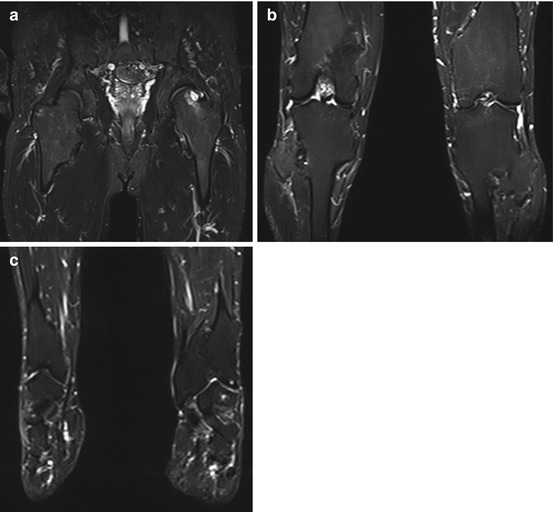
Table 10.3
Osteochondroma (osteocartilaginous exostosis)
Prevalence | Most common benign tumor |
12 % of all bone tumors | |
45 % of all benign bone tumors | |
Age predilection | 10–35 years |
Sex predilection | M:F ratio of 1.8–2:1 |
Location | Any bone that undergoes endochondral ossification |
Metaphysis of long bones | |
Femur, tibia, humerus, hands and feet | |
Rarely pelvis, scapula | |
Type of lesion | Benign; malignant transformation very rare |
Stops growing with skeletal maturity | |
Signs and symptoms | Often painless swelling |
Symptoms due to compression of nerves or vessels or limitation of joint motion | |
Differential diagnosis | Parosteal osteosarcoma, chondrosarcoma, juxtacortical myositis ossificans |
Fig. 10.5
Incidental screening finding (STIR). Thirty-nine-year-old male subject with multiple sessile and pedunculated osteochondromas in the proximal femoral metaphysis (a), the distal femoral metaphysis and proximal tibial metaphysis (b), and the distal tibial and fibular metaphysis (c) causing bone and joint deformities
Clinical Management
Most osteochondromas are asymptomatic incidental findings or present with a several-year history of painless swelling. Secondary chondrosarcoma arising in a solitary osteochondroma is very rare (1–2 %) (Ahmed et al. 2003). Therefore, further diagnostic tests need not be obtained unless the MRI findings are indeterminate. A cartilage cap thickness exceeding 2 cm on is considered an important marker of malignant transformation (Ahmed et al. 2003). In individuals with hereditary multiple osteochondroma, an autosomal dominant disorder associated with bone and joint deformities (Fig. 10.6), the risk of malignant transformation can be as high as 9 % (Altay et al. 2007). Surgical resection with wide margins is the best treatment option for patients with symptomatic osteochondroma (Ayerza et al. 2007).
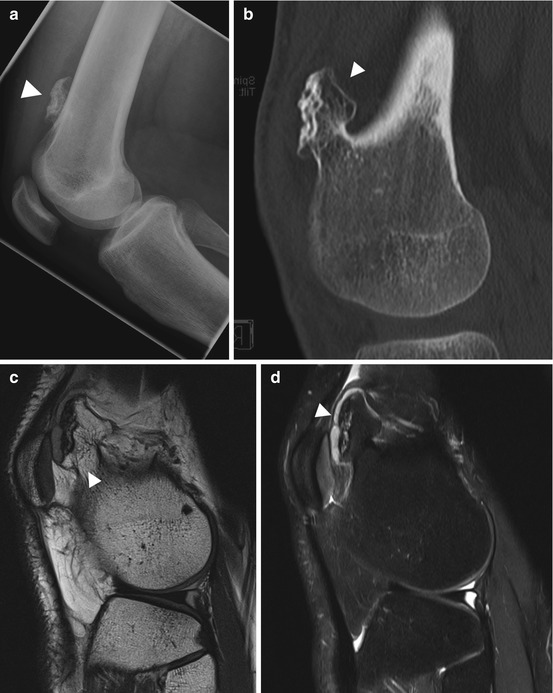
Fig. 10.6
Diagnostic workup. Same subject as Fig. 10.5. Conventional radiograph (a) shows a sessile osteochondroma (arrowhead) extending from the cortex of the distal femoral metaphysis. CT scan (b) demonstrates the cortical and medullary portions of the lesion to be continuous with the parent bone (arrowhead). On MRI, the thickness of the cartilage cap – an important criterion of malignancy – can be measured. The cap (arrowhead) has intermediate signal intensity on sagittal PD image (c) and high signal intensity on sagittal fat-suppressed T2w image (SPAIR) (d)
10.2.1.2.2 Chondroma/Enchondroma
Enchondroma is a well-defined osteolytic lesion with a chondroid matrix. It typically contains calcifications arranged in an arc-and-ring pattern, giving rise to the characteristic popcorn appearance on conventional radiographs (Greenspan 1989; Unni 2001) (Table 10.4). On MRI, an enchondroma appears as a sharply demarcated, lobulated lesion of low to intermediate T1 and high T2 signal intensity (Fig. 10.7a). Calcifications within the matrix may appear as signal voids on all pulse sequences. On fat-suppressed T1-weighted images acquired after contrast medium administration, enhancement is predominantly peripheral and occurs in arcs or rings (Fig. 10.7d). This pattern may be obscured by the high signal intensity of hyaline cartilage on these images (Aoki et al. 1991; Geirnaerdt et al. 1993).
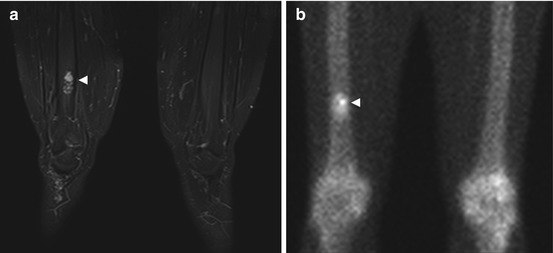
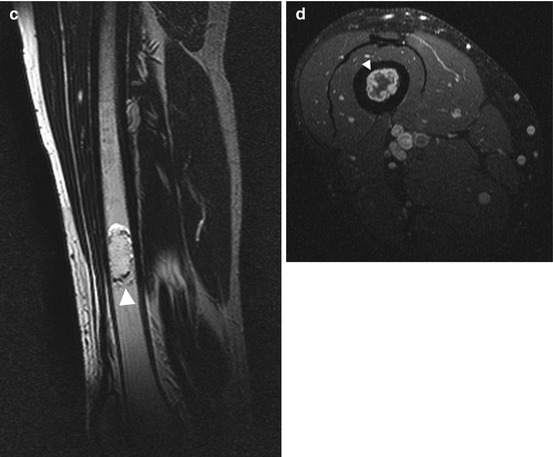
Table 10.4
Chondroma/enchondroma
Chondroma/enchondroma | Arises in cortical bone |
Arises in the intramedullary cavity | |
Prevalence | Second most common benign tumor |
2–20 % of all bone tumors | |
12–24 % of all benign bone tumors | |
Multiple lesions in Ollier disease, Maffucci syndrome, and metachondromatosis | |
Age predilection | 15–40 years |
Sex predilection | M = F |
Location | Metaphyseal and terminal diaphyseal regions |
Short tubular bones of hands and feet (60 %) | |
Long bones (25–40 %), most commonly the femur and humerus | |
Type of lesion | Benign; malignant sarcomatous transformation in rare cases |
Signs and symptoms | Asymptomatic incidental finding |
Pain, swelling, pathologic fracture | |
Differential diagnosis | Bone infarct, epidermoid, chondrosarcoma |
Fig. 10.7
Incidental screening finding (STIR) and diagnostic workup. Forty-five-year-old male subject with a sharply demarcated, lobulated lesion of high signal intensity (arrowhead) in the right distal femoral shaft (a). Diagnostic workup with scintigraphy and contrast-enhanced MRI. Tc-99m scan demonstrates high metabolic activity of the lesion (arrowhead) (b). On supplementary MRI, the lesion has the characteristic appearance of an enchondroma: hyperintense cartilage surrounded by a thin rim of hypointense perichondrium (arrowhead) (sagittal T2w TSE) (c) with a strong peripheral ring-and-arc pattern of enhancement (arrowhead) on axial contrast-enhanced image (T1w TSE) (d)
Clinical Management
Enchondroma is a common incidental finding (Hong et al. 2011), and if the diagnosis is clear, no further investigation or treatment is required. Symptomatic lesions can be treated by curettage and bone grafting. Although malignant transformation to chondrosarcoma is rare, regular radiologic follow-up is recommended (Müller et al. 2003). Vanel et al. (2013) have recently suggested that the presence of cartilaginous islands in the periphery of an unclear lesion has the potential to serve as a new MRI criterion for differentiating between enchondroma and chondrosarcoma. Detection of multiple enchondromas may suggest enchondromatosis (e.g., Ollier disease), which is associated with a 15–50 % risk of malignant transformation (Goodman et al. 1984).
10.2.1.3 Fibrous Bone Tumors
10.2.1.3.1 Fibrous Dysplasia (Jaffé-Lichtenstein Disease)
Fibrous dysplasia is a benign chronic disorder of bone development in which the normal medullary space is replaced by fibrous tissue, causing expansion and distortion of the bone. Monostotic fibrous dysplasia involves a single long bone and is far more common than the polyostotic form (85 vs. 15 %). The latter typically affects the skull and facial bones (Ippolito et al. 2003) (Table 10.5). On MRI, fibrous dysplasia is visualized as an expansive mass in the medullary space. The mass has homogeneous low signal intensity on T1-weighted images (Fig. 10.8b) and intermediate to high signal intensity on T2-weighted images (Fig. 10.8a). It is surrounded by a low-signal-intensity rim. Active portions show strong homogeneous enhancement after IV contrast medium administration (Jee et al. 1996).
Table 10.5
Fibrous dysplasia (Jaffé-Lichtenstein disease)
Prevalence | Most common skeletal anomaly in children and young adults but also occurs in adult life; occurs in patients with McCune-Albright syndrome and Mazabraud syndrome |
Age predilection | 5–50 years, with a peak at 10–20 years |
Sex predilection | M = F |
Location | Craniofacial bones |
Metaphysis of long bones (femur, tibia) | |
Ribs | |
Type of lesion | Benign; malignant sarcomatous transformation extremely rare |
Signs and symptoms | Monostotic form typically asymptomatic, pathologic fracture |
Polyostotic form often presents with symptoms in childhood (2/3 of cases) | |
Differential diagnosis | Neurofibromatosis, Paget disease, juvenile bone cyst |
Fig. 10.8
Incidental screening finding (STIR) and diagnostic workup. Thirty-five-year-old male subject with an expansive mass of the left zygomatic arch (arrowhead). The mass has high signal intensity on STIR image (a) and low signal intensity on axial T1w TSE image (b). Diagnostic workup with CT demonstrates the characteristic appearance of fibrous dysplasia with incomplete mineralization of the fibrous matrix (c)
Clinical Management
A skeletal survey with conventional radiographs is recommended to identify monostotic or polyostotic fibrous dysplasia. Computed tomography can be helpful in assessing skull involvement and identifying possible mass effects on intracranial and orbital structures (Chapurlat and Orcel 2008). Monostotic lesions usually stop growing during puberty, and in subjects with small asymptomatic lesions, further clinical evaluation is not necessary. Malignant sarcomatous transformation is extremely rare. In subjects with a risk of pathologic fracture from a large monostotic lesion, treatment is required. Lesions due to polyostotic fibrous dysplasia can continue to grow after puberty. The polyostotic form is often associated with endocrine disorders such as hyperthyroidism, hyperparathyroidism, or diabetes mellitus, which is why clinical workup is recommended (Chapurlat and Orcel 2008).
10.2.1.4 Bone-Forming Tumors
10.2.1.4.1 Osteoma
Osteomas are circumscribed sclerotic lesions that resemble mature cortical bone and arise juxtacortically (Table 10.6). The lesions have low signal intensity on T1- and T2-weighted images (Fig. 10.9a–c) and do not enhance after IV administration of contrast medium (Greenspan 1993).
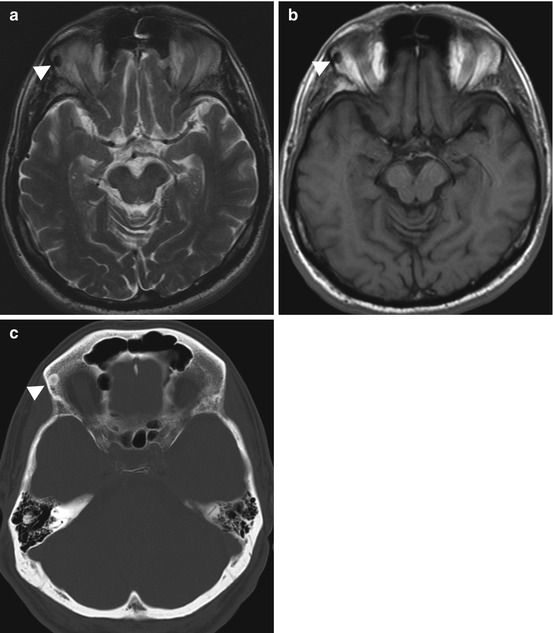
Table 10.6
Osteoma
Prevalence | 0.4 % |
Age predilection | 10–79 years, with a peak at 40–50 years |
Sex predilection | M = F |
Location | Paranasal sinuses (frontal, ethmoid) |
Skull, mandible | |
Multiple osteoma in Gardner syndrome | |
Type of lesion | Benign |
Signs and symptoms | Small lesions: typically asymptomatic and detected incidentally |
Expansion of bone, pain, sinusitis, mucocele, exophthalmos, double vision, visual disturbance | |
Differential diagnosis | Parosteal osteosarcoma, osteochondroma, enostoma |
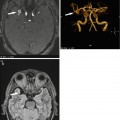
Fig. 10.9
Incidental screening finding and diagnostic workup. Sixty-five-year-old male subject with a sharply delineated, oval lesion (arrowhead) in the right orbital roof. The lesion has low signal intensity on axial T2w TSE image (a) and axial T1w SE image (b). Diagnostic workup with CT (c) demonstrates a homogeneously calcified lesion, consistent with an osteoma
Clinical Management
Most osteomas are asymptomatic and can be left alone. For symptomatic osteomas, en bloc resection is currently recommended (Haddad et al. 1997).
10.2.1.4.2 Osteoid Osteoma
An osteoid osteoma consists of a highly vascularized nidus, which is typically found in the cortex. Medullary or subperiosteal osteoid osteoma is less common. The nidus is less than 1.5 cm in size. A larger variant, known as osteoblastoma, commonly involves the spine. The lesion is rounded or spindle-shaped, and the nidus is surrounded by sclerotic bone (Greenspan 1993) (Table 10.7).
Table 10.7
Osteoid osteoma
Prevalence | 4 % of all primary bone tumors |
12 % of all benign bone tumors | |
Age predilection | 10–35 years |
Sex predilection | M:F ratio of 3:1 |
Location | Metaphysis, diaphysis |
Femur, tibia, phalanges, spine (posterior elements) | |
Type of lesion | Benign, no size increase |
Signs and symptoms | Circumscribed pain, often most severe at night, readily controlled by nonsteroidal anti-inflammatory drugs (NSAIDs) (often within 30 min) |
Localized swelling, tenderness | |
Spinal osteoid osteoma causes painful scoliosis | |
Differential diagnosis | Osteoblastoma, bone island, Brodie abscess |
The nidus is isointense to muscle on T1-weighted images with intermediate to high signal intensity on T2-weighted images (Fig. 10.10a, b). It enhances strongly after IV contrast medium administration. The sclerotic rim is dark on all pulse sequences. Perifocal bone marrow and soft tissue edema may be present and is best seen on fat-suppressed T2-weighted or STIR images or on contrast-enhanced T1-weighted images (Assoun et al. 1994).
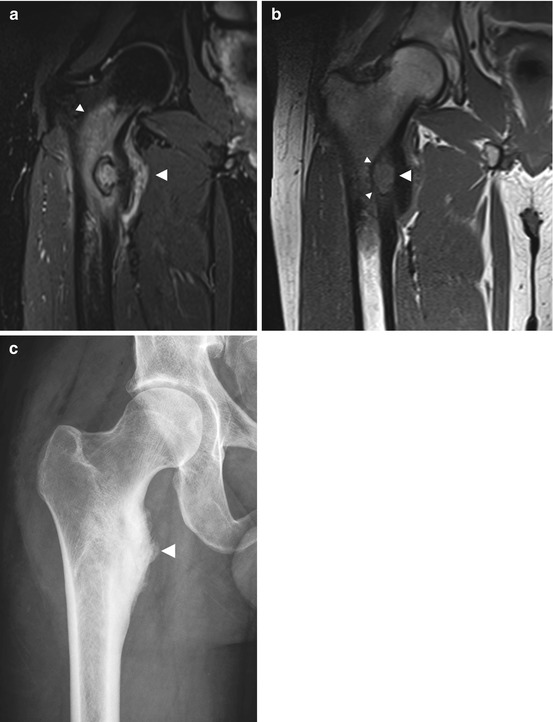
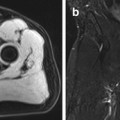
Fig. 10.10
Incidental screening finding (STIR) and diagnostic workup. Twenty-three-year-old male subject with distention of the right proximal femoral shaft (large arrowhead) and extensive medullary cavity edema (small arrowheads) (a). Sagittal T1w TSE image (b) reveals a central nidus isointense to muscle (large arrowhead). The lesion is surrounded by a low-signal-intensity zone of sclerosis (small arrowheads). Workup using conventional radiography confirms marked reactive sclerosis (arrowhead) of the femoral shaft (c)
Clinical Management
Osteoid osteoma is often asymptomatic. Conventional radiographs are recommended for confirming the diagnosis and are necessary for treatment planning if surgery is contemplated (Fig. 10.10c). CT is the modality of choice for identification of the nidus (Frassica et al. 1996). In intra-articular osteoid osteoma, MRI can identify complications such as joint effusion and synovitis. Supplementary diagnostic information is obtained by bone scintigraphy and angiography. Initial treatment may be conservative: nonsteroidal anti-inflammatory drugs (NSAIDS) may be given, as many osteoid osteomas resolve spontaneously after 2–7 years (Winkelmann et al. 2003). Minimally invasive interventions include CT-guided radiofrequency ablation (Hoffmann et al. 2010) and CT-guided removal (Fenichel et al. 2006).
10.2.2 Bone Marrow Disorders
10.2.2.1 Conversion and Reconversion
Conversion of red-to-yellow marrow refers to the shift in bone marrow composition from highly cellular, hematopoietically active marrow (red) to inactive fatty marrow (yellow). This conversion begins in the distal phalanges of the hands and feet and then progresses proximally. Conversion is best appreciated on unenhanced T1-weighted images. In the long bones, fatty degeneration starts in the apo- and epiphyses, progressing first to the diaphyses and then to the metaphyses. In the vertebral bodies, fatty degeneration begins near the central venous plexus and slowly progresses into the periphery. In adults, hematopoietic marrow is still present in the proximal metaphyses of the humerus and femur, the pelvis, the vertebrae, the ribs and sternum, the scapula, the calcaneus, and flat bones of the skull. With age, the physiologic process of red-to-yellow marrow conversion slowly leads to a progressive increase in the proportion of fatty marrow. The adult pattern is characterized by a balanced distribution of red and yellow marrow but varies from person to person and is affected by a variety of factors (Vogler and Murphy 1988; Ricci et al. 1990).
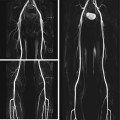
Reconversion is the repopulation of yellow marrow by hematopoietic cells. This process follows the pattern of red-to-yellow marrow conversion in reverse, meaning that it progresses from the center toward the periphery. In the long bones, reconversion begins symmetrically, progressing from the metaphyses into the diaphyses. From here it may even continue into the epiphyses if the demand for red cells is strong enough. Bone marrow reconversion is triggered by conditions associated with an increased demand for red cells. This includes anemia or blood loss, competitive sports, time spent at high altitudes, heavy smoking, cyanotic heart disease, and chemotherapy. Reconverted bone marrow may have very high signal intensity on STIR images (Fig. 10.11a) and very low signal intensity on T1-weighted images (Fig.10.11b), making it difficult to differentiate reconversion from diffuse infiltrative neoplastic conditions.
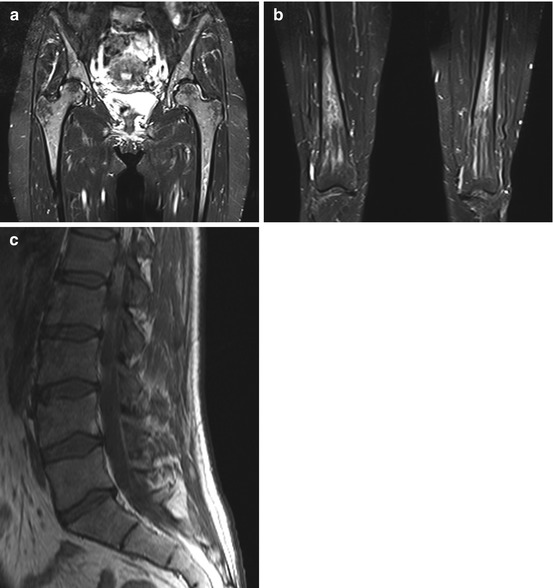
Fig. 10.11
Incidental screening finding (STIR). Forty-nine-year-old female subject with hematopoietically active bone marrow in the pelvic and thigh bones. The active marrow has high signal intensity on STIR images (a, b). T1w TSE image shows low signal intensity of spinal marrow (c). Diagnostic workup in this subject revealed chronic anemia due to hypermenorrhea
STIR sequences are very useful for detecting bone marrow pathology (Mehta et al. 1995; Mahnken et al. 2005; Schmidt et al. 2007). On STIR images, normal yellow marrow appears black, while hematopoietic marrow and lesions are of high signal intensity. STIR sequences have high sensitivity but poor specificity. Bone marrow pathology may be associated with decreased or increased cellularity (Fig. 10.12). When cellularity is decreased, yellow marrow predominates, making for a dark appearance on STIR images and a bright appearance on T1-weighted images. Conversely, pathology associated with increased cellularity is bright on STIR images and dark on T1-weighted images. A notable exception is storage disorders with excessive deposition of iron or calcium. These deposits produce a loss of signal intensity on both STIR and T1-weighted images. Two conditions associated with malignant cell infiltration of the bone marrow, metastasis and multiple myeloma, can commonly be detected incidentally on screening MRI (Delorme and Baur-Melnyk 2011; Kwee et al. 2011; Collins 2010). The other bone marrow pathologies listed in Fig. 10.12 are encountered less frequently.
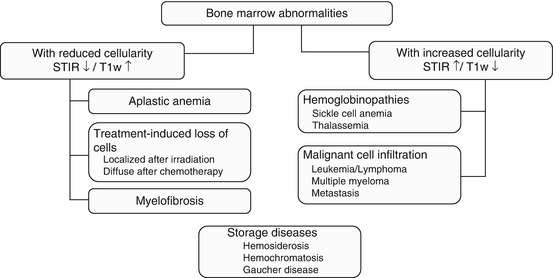
Fig. 10.12
Classification of bone marrow abnormalities by cellularity and MRI signal intensity
10.2.2.2 Bone Metastases
The bone marrow is the third most common site of metastatic disease. At autopsy, bone metastases have been found in 30–70 % of patients with a malignant tumor (Papac 1994). The skeleton may be affected by single or multiple osteolytic or osteoblastic metastases of variable size. Bone metastases are common in patients with breast, lung, prostate, thyroid, and renal cancer. Normally, malignant cells spread hematogenously to sites of residual hematopoietic bone marrow in the spine, ribs, pelvis, skull, humerus, and femur. Metastatic growth destroys the cortical layer, resulting in invasion of soft tissues. Vertebral metastases tend to destroy the pedicles or endplates. Some primary malignancies, such as cancer of the prostate or urinary bladder (Fig. 10.13), produce factors that stimulate bone-forming cells. These give rise to osteoblastic metastases, which are characterized by the formation of new bone. Other tumors, including renal cell cancer or thyroid cancer, secrete factors, such as TGF or PDGF, that stimulate osteoclast activity, which leads to osteolytic destruction of the bone matrix. In breast cancer, both osteolytic and osteoblastic bone metastases can occur (Fig. 10.14). The MR signal intensities of osteoblastic and osteolytic metastases on different pulse sequences are summarized in Table 10.8. With its high sensitivity and diagnostic accuracy, the coronal STIR sequence appears to become the first-line tool to search for bone metastases – preferred over other imaging modalities such as skeletal scintigraphy or PET-CT (Mehta et al. 1995; Mahnken et al. 2005; Schmidt et al. 2007; Papac 1994; Chiewvit et al. 2009).
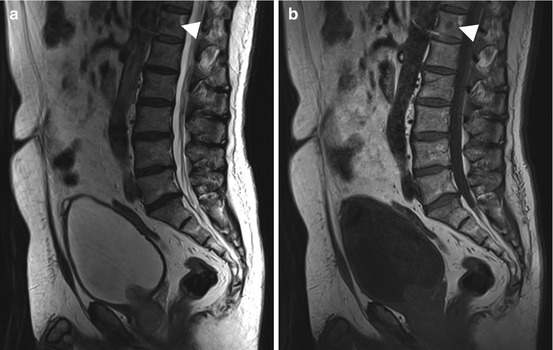
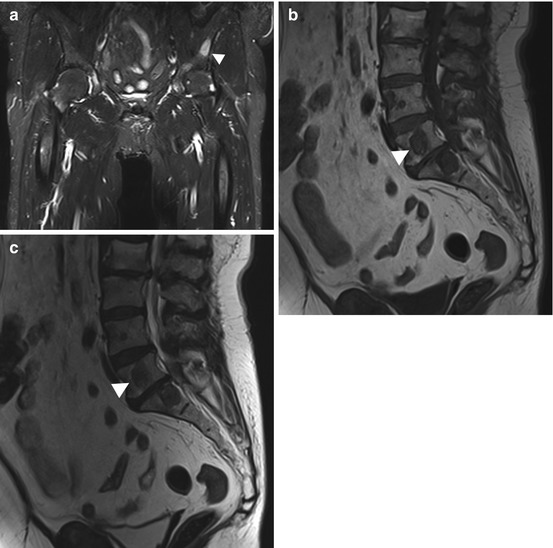
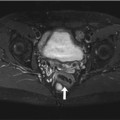
Fig. 10.13
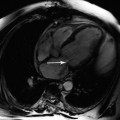
Incidental screening finding. Sixty-six-year-old male subject with an inhomogeneous mass in the prostate. The mass extends through the bladder base into the bladder on sagittal T2w TSE image (a). In addition, this image and the corresponding T1w image show a low-signal-intensity round lesion (arrowhead) in the center of T12 (a, b). Workup yielded the diagnosis of osteoblastic metastasis from prostate cancer
Fig. 10.14
Incidental screening finding. Sixty-four-year-old female subject with a high-signal-intensity lesion (arrowhead) in the left iliac bone (STIR) (a). In addition, there are multiple round lesions in L3 through L5 (arrowhead indicates L4 metastasis), which have low signal intensity on sagittal T1w TSE image (b) and sagittal T2w TSE image (c). Workup yielded the diagnosis of multiple osteolytic and osteoblastic metastases from breast cancer
Table 10.8
Signal intensities of osteolytic and osteoblastic metastases on different pulse sequences
Osteolytic | Osteoblastic | |
|---|---|---|
T1-weighted sequence | ↓ | ↓ |
T2-weighted sequence | ↑ | ↓ |
STIR | ↑ | ↓ |
T1-weighted sequence after IV contrast medium | Variable enhancement | Variable enhancement |
Clinical Management
Incidentally detected bone metastases require prompt diagnostic workup to identify and treat possible complications and detect the primary tumor. Complications of vertebral metastases include pathologic fractures and neurologic problems. The search for the primary tumor is best undertaken using a whole-body screening modality such as CT or MRI (Schmidt et al. 2007; Papac 1994).
10.2.2.3 Multiple Myeloma/Plasmacytoma
Multiple myeloma, or plasmacytoma, is the most common primary malignant bone tumor, occurring predominantly in men between 40 and 80 years of age. It is a hematologic disorder characterized by an uncontrolled proliferation of abnormal plasma cells. The neoplastic plasma cells invade the bone marrow, and by secreting nonfunctional monoclonal immunoglobulins, they suppress benign polyclonal plasma cells. The simultaneous release of osteoclast-stimulating factors and inhibition of osteoblast activity result in osteolytic demineralization and destruction of normal bone. Bone involvement may be diffuse, or multiple sharply demarcated osteolytic lesions of variable size may be present. Multiple myeloma affects bones containing red marrow, most commonly the spine, ribs, pelvis, skull, humerus, and femur. Unlike vertebral metastases, myeloma lesions generally only involve the posterior elements of the vertebral bodies in advanced disease. On MRI, the osteolytic lesions have high signal intensity on STIR and T2-weighted images (Fig. 10.15b, c) and intermediate to low signal intensity on T1-weighted images (Fig. 10.15a) (Baur-Melnyk et al. 2005; Delorme and Baur-Melnyk 2011).
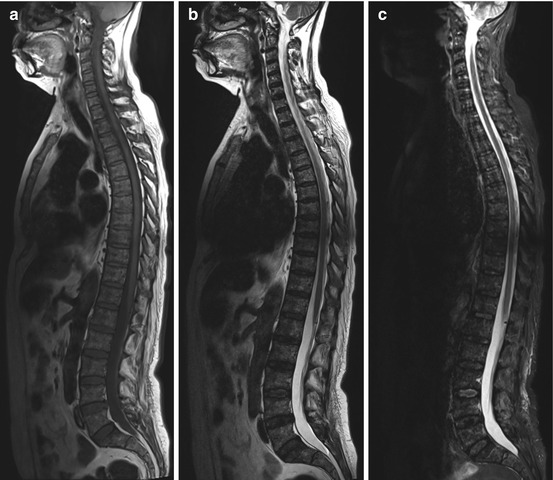
Fig. 10.15
Incidental finding at screening. Fifty-seven-year-old female subject with multiple focal lesions diffusely distributed within the bone marrow. The lesions are predominantly hypointense on T1w image (a) and hyperintense on T2w image (b) and on STIR image (c). This is the so-called salt-and-pepper pattern of diffuse plasmacytoma
Clinical Management
A subject whose MRI findings point to plasmacytoma requires further diagnostic evaluation. The baseline workup includes comprehensive blood and urine tests and immunoelectrophoresis. The Durie-Salmon system classifies multiple myeloma into one of three stages based on the number of osteolytic bone lesions, hemoglobin and calcium blood levels, and immunoglobulin production. Whole-body MRI is very sensitive for evaluating bone marrow infiltration compared with traditional imaging modalities such as conventional radiographs (Baur-Melnyk et al. 2005; Delorme and Baur-Melnyk 2011). MRI protocols including coronal STIR sequences and T1- and T2-weighted sequences for spinal imaging have been established for the staging and monitoring of treatment in the clinical setting.
10.2.3 The Joints
Though the body’s major joints are typically depicted on MR images acquired with a whole-body protocol, whole-body MRI has several limitations. The elbows, for example, tend to be located outside the homogeneous magnetic field. A detailed evaluation of the internal joint structures is usually not possible with the pulse sequences included in whole-body MRI protocols. Furthermore, the protocol does not include the specific slice orientations for optimal evaluation of individual joints (e.g., shoulder: parasagittal, paracoronal; knee: aligned along long axis of cruciate ligament). Nevertheless, the coronal TIRM sequence in particular is an excellent screening sequence for detecting joint abnormalities. The most important morphologic imaging features of joint abnormalities include joint effusion and subchondral bone edema. They are conspicuous due to their high signal intensity (Fig. 10.16). The differential diagnosis of these findings includes acute arthritis (bacterial, rheumatoid) and aseptic bone necrosis. In both cases, clinical signs and symptoms will be present to assist in making a diagnosis, unless a subject has very early disease at the time of imaging. For this reason, only rarely are the findings truly incidental.
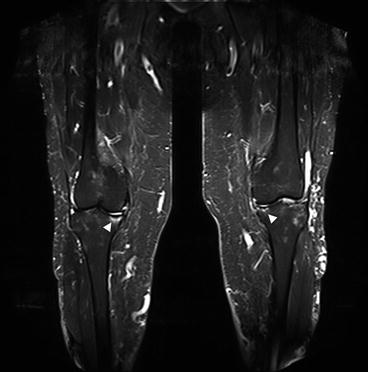
Fig. 10.16
Bilateral medial gonarthrosis, more marked on the right. Image shows loss of height of the joint space, subchondral bone edema (arrowheads) of the medial tibial condyle, joint effusion, and mild varus deformity
A variety of cystic lesions can affect the joints and are particularly common in and around the knee (Perdikakis and Skiadas 2013). These lesions should not be confused with dilated anatomic recesses caused by joint effusion. In a screening population with a large proportion of middle-aged and older individuals, joint effusion is a common incidental finding and often occurs bilaterally. When larger structural lesions are absent, joint effusion is most likely due to arthrosis – and a distinction must be made between inactive and activate disease. In active disease, there is concomitant synovitis, seen on imaging as a large effusion (Fig. 10.17).
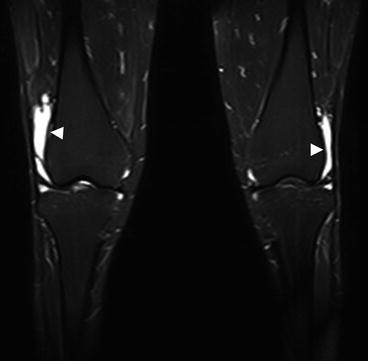
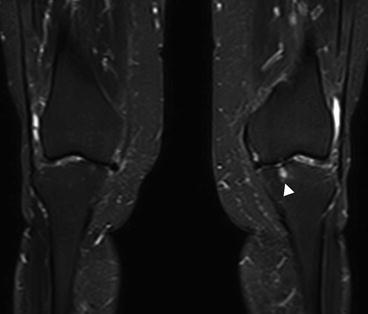
Fig. 10.17
Extensive bilateral knee joint effusion (arrowheads) with otherwise only mild secondary signs of arthrosis
Another common finding is bone marrow edema of variable degree, typically located in the metaphysis and/or epiphysis. The underlying cause is frequently not apparent in the initial screening. One possible cause is early aseptic b one necrosis such as transient osteoporosis of the proximal femur. More extensive edema may also point to bone necrosis or trauma such as contusion or even fracture (Fig. 10.18).
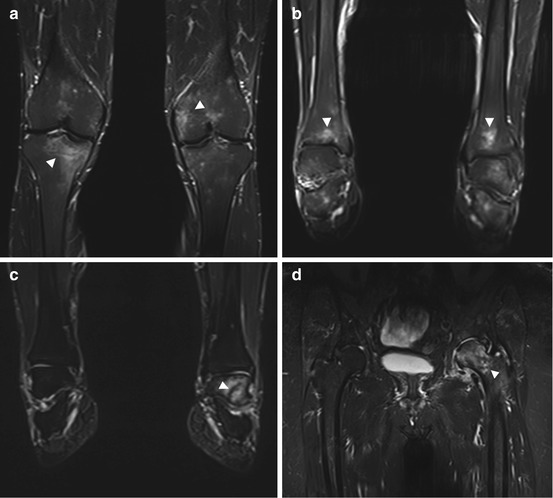
Fig. 10.18
Bone marrow edema (arrowheads) in different locations: in both knees (a), in both ankle joints (b), in the left ankle joint (c), and in the left femoral head and neck (d). The underlying causes are multifarious (e.g., overuse, arthrosis, trauma) and remain unclear in these cases
An occasional osteochondral lesion with or without displacement of an osteochondral fragment can be seen in younger, physically active individuals. These lesions are known as osteochondritis dissecans and typically involve the stress-bearing areas of the femoral or tibial condyle. Quatman et al. (2012) have shown that MRI is a useful noninvasive tool for the diagnosis and evaluation of osteochondritis dissecans. The terminal stage involves the formation of loose bodies, i.e., the complete detachment of an osteochondral fragment (Fig. 10.19).
Get Clinical Tree app for offline access
Fig. 10.19
Circumscribed focal osteochondral defect (arrowhead


Related posts:

Stay updated, free articles. Join our Telegram channel
Full access? Get Clinical Tree
