Type of lesion
Morphology
Entity
Prevalence
Age predilection
Sex predilection
Benign
Cystic
Liver cysts
2.5–18 %
<40 years
Women
Liver hemangioma
7 %
<50 years
Women
Solid
Focal nodular hyperplasia (FNH)
2–8 %
20–50 years
Women
Hepatocellular adenoma
>5 %
30–40 years
Women
Malignant
Solid
Metastasis
Approx. 50 % in cancer patients
<40 years
Depends on the primary tumor
Hepatocellular carcinoma (HCC)
Rare
<40 years
Men
Cholangiocellular carcinoma (CCC)
Rare
<40 years
–
In the screening situation, we can roughly distinguish three categories of focal liver lesions: benign cysts and cyst-like lesions, benign solid masses, and solid malignancies (Table 8.1). Lesions with a cystic appearance such as dysontogenetic cysts, echinococcal cysts, and cavernous hemangiomas can be diagnosed with confidence on the basis of an unenhanced MRI examination (including conventional T1- and T2-weighted sequences), and treatment recommendations can be made accordingly. This is not the case for solid liver lesions such as focal nodular hyperplasia, hepatocellular adenoma, metastasis, hepatocellular carcinoma, or cholangiocellular carcinoma. In most instances, a contrast-enhanced study is necessary to characterize solid liver lesions and estimate their total extent.
8.1.2 Pulse Sequence Protocols and Characterization of Focal Liver Lesions
An example of a standard protocol for non-contrast-enhanced imaging of the liver as part of a whole-body MRI examination is presented in Table 8.2.
Table 8.2
Short standardized protocol for non-contrast-enhanced liver imaging in the setting of whole-body MRI screening
TR (ms) | TE (ms) | Flip angle | Slice thickness (mm) | Matrix | Acquisition time (min) | |
|---|---|---|---|---|---|---|
T1w FLASH 2D FS | 251 | 4.13 | 70 | 6 | 129 × 256 | 1:17 |
T2w TSE BLADE FS | 2,720 | 116 | 150 | 6 | 129 × 256 | 1:16 |
VIBE Dixon | 17.48 | 2.4/4.8 | 10 | 5 | 126 × 224 | 0:19 |
DWIa | 1,700 | 72 | 6 | 115 × 192 | 2:55 |
Most benign and malignant hepatic lesions have lower T1 and higher T2 signal intensity compared with healthy liver tissue. The T2 signal intensity relative to splenic tissue allows characterization of most focal liver lesions as benign or malignant. For example, isointensity to normal spleen on T2-weighted images is always suspicious for malignancy. High T2 signal intensity relative to the spleen and sharp demarcation from surrounding parenchyma indicate a cyst or hemangioma. Liver masses with lower signal intensity on T2-weighted images than normal spleen include focal nodular hyperplasia (FNH), hepatocellular adenoma, and hepatocellular carcinoma (HCC). Non-contrast-enhanced images, especially T2-weighted turbo spin echo (TSE) images, provide the most important information for detecting and characterizing focal liver lesions. In the screening situation, it is therefore most important to ensure high-quality T2-weighted TSE imaging. Respiratory-triggered diffusion-weighted imaging (DWI) of the liver is a new MRI technique that improves detection of focal lesions and provides supplementary information for their characterization (Holzapfel et al. 2008). In contrast, T1-weighted pulse sequences provide anatomic orientation, while offering little additional information for lesion characterization (except for focal hepatic steatosis).
The flow chart presented in Fig. 8.1 summarizes the strategy we propose for the differentiation and management of focal liver lesions detected by non-contrast-enhanced screening MRI.
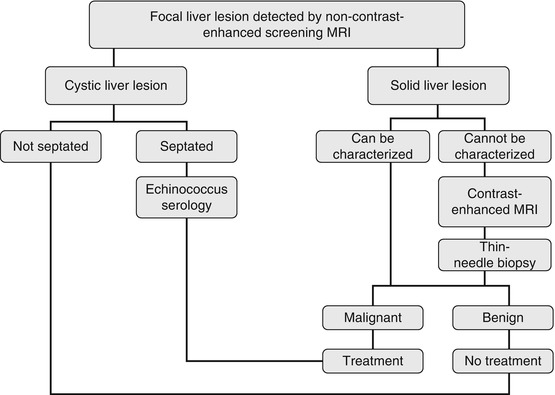
Fig. 8.1
Diagnostic and therapeutic management of focal liver lesions detected by non-contrast-enhanced screening MRI
8.1.3 MRI Morphology of Cystic Liver Lesions
Typical cystic lesions are sharply delineated and have high signal intensity compared to surrounding liver and spleen on T2-weighted images. Examples are congenital cysts of the liver, hemangiomas, and inflammatory lesions such as echinoccocal cysts and abscess. Cystic liver lesions are benign and are treated as such. Standard non-contrast-enhanced T1- and T2-weighted datasets do not allow reliable differentiation between hepatic cysts and hemangiomas since both have long T2 relaxation times (>130 ms). Hemangiomas generally have a sharp but irregular outline and tend to develop central fibrosis, which appears bright on T1-weighted images. DWI with calculation of apparent diffusion coefficients (ADC) may provide supplementary information for differentiating between these two entities (Sun et al. 2005).
8.1.3.1 Hepatic Cysts
Liver cysts are fluid-filled spaces that are found within the parenchyma or bulge from the liver capsule (Sun et al. 2005). A simple liver cyst (or bile duct cyst) is a benign congenital fluid-containing lesion with an epithelium-lined wall. Liver cysts may be single or multiple (Fig. 8.2). The presence of multiple cysts may suggest autosomal dominant polycystic liver disease. Simple cysts are the most common benign liver lesions. In autopsy series, a prevalence of over 18 % with a preference for women has been found (Carrim and Murchison 2003). Hepatic cysts become increasingly common after age 40 (Caremani et al. 1993). Depending on the imaging modality used, liver cysts are incidentally detected in 2.5–18 % of examinations (Gaines and Sampson 1989; Carrim and Murchison 2003). Virtually all liver cysts are asymptomatic. An occasional large cyst with mass effect may present with dragging pain in the upper abdomen. Rare complications such as intracystic hemorrhage or rupture with peritoneal seeding cause severe abdominal pain of sudden onset. If MRI shows internal septation or an irregular contour, a hydatid cyst (echinococcus cyst) must be ruled out by laboratory testing (Fig. 8.3).
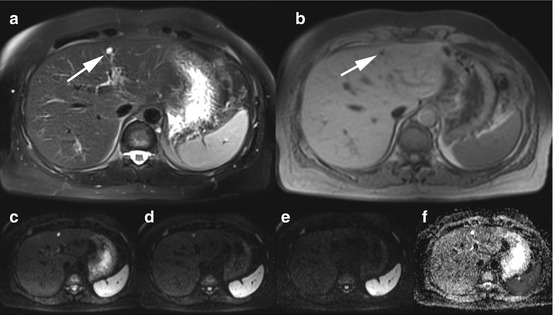
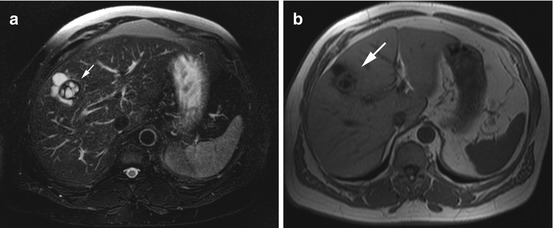
Fig. 8.2
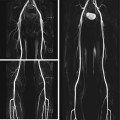
A 37-year-old male subject with incidental simple liver cyst in segment IV (arrow). (a) Fat-saturated T2w TSE image (a) and fat-saturated 2D T1w FLASH image (b) show sharply demarcated, cystic lesion in segment IV. Liver cysts and hemangiomas cannot be differentiated without injection of contrast medium. (c–f) On diffusion-weighted images, acquired with different b values (diffusion gradients), the liver lesion has high signal intensity at b = 0 (c), moderately high signal intensity at b = 400 (d), and the same signal intensity as hepatic parenchyma at b = 800 (e). (f) Liver cysts have a mean ADC value of (3.14 ± 0.31) × 10–3 mm2/s (Sun et al. 2005)
Fig. 8.3
A 50-year-old Mediterranean man with an echinococcal cyst of the liver suggested by MRI appearance (arrow) and confirmed by serology. Fat-saturated T2w TSE image (a) and 2D T1w FLASH image (b) show a septated cystic mass with sharp margins in segment VIII
Clinical Management
Small, asymptomatic liver cysts that are not caused by parasites can be left alone. For nonparasitic liver cysts that become symptomatic, elective surgery should be contemplated. All parasitic cysts must be excised (echinococcus serology) (Rückert et al.).
Complications such as hemorrhage, rupture, or penetration into adjacent structures are not usually encountered in the screening situation but would require emergency surgery.
8.1.3.2 Liver Hemangioma
A hemangioma is a benign proliferation of blood vessels that may occur in any vascularized tissue in the body. Among the parenchymal organs of the upper abdomen, the liver is the most common site of hemangiomas. A typical liver hemangioma is a small, blood-filled tumor less than 3 cm in size (Fig. 8.4). Cavernous hemangiomas have a prevalence of 7 % and are the second most common benign hepatic tumors (Semelka and Sofka 1997; Takagi 1985; Nufer et al. 1999). Postmenopausal women are affected 5–6 times more frequently than men (Cherqui et al. 1995). There is an association with FNH. About 25 % of all hemangiomas are incidentally detected in patients whose liver is being evaluated for the presence of metastasis. Hemangiomas have no risk of malignant transformation, although 30 % are initially categorized as indeterminate or suspicious. The vast majority of cavernous hemangiomas (95 %) are asymptomatic, while 40 % of giant liver hemangiomas (>4 cm) cause symptoms (Fig. 8.5). Symptoms are nonspecific, including upper abdominal pain, early satiety, nausea, and vomiting (Trastek et al. 1983). An occasional large hemangioma may rupture (5 % risk), which, in 70 % of cases, is fatal.
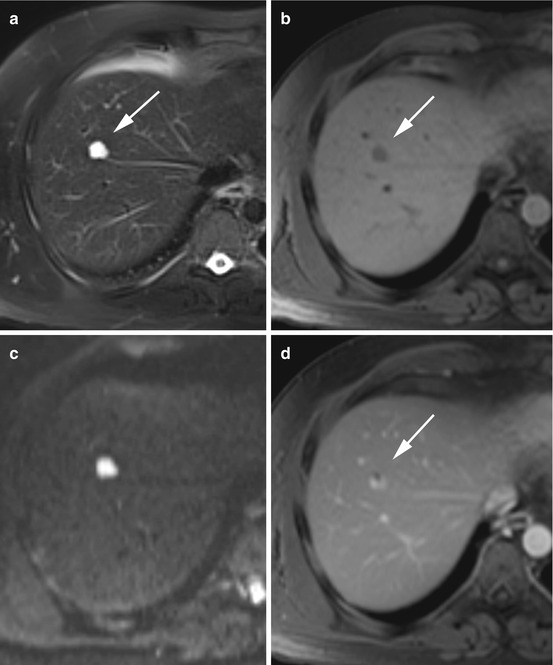
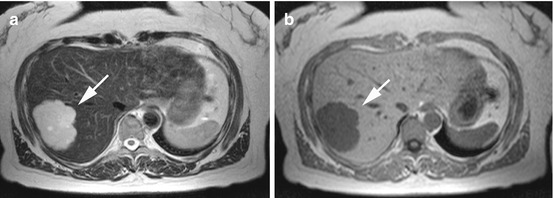
Fig. 8.4
A 45-year-old male subject with an incidentally detected liver hemangioma (arrow). (a) Fat-saturated T2w TSE image shows a sharply demarcated mass, measuring 2.2 cm, in segment VIII. (b) On 2D T1w Flash image, the lesion has low signal intensity relative to surrounding liver. (c) On DWI, the lesion retains its high signal intensity even at high b values; the image shown was acquired with b = 800. Liver hemangiomas have a mean ADC value of (1.86 ± 0.36) × 10–3 mm2/s (Sun et al. 2005). (d) For lesion differentiation, an extracellular MR contrast agent was administered. On the postcontrast images, the lesion showed centripetal fill-in, consistent with hemangioma
Fig. 8.5
A 42-year-old female subject with incidentally detected giant hemangioma with central fibrosis (arrow). (a) T2w TSE image reveals a sharply marginated, very bright lesion in segment VII. The lesion measures 8.2 cm and is located near the capsule. The appearance is heterogeneous. (b) On T1 weighted image, the lesion is hypointense to surrounding liver
Clinical Management
Asymptomatic cavernous liver hemangioma requires no treatment. In symptomatic patients, elective surgical excision and interventional angiographic embolization may be contemplated. There is an increased surgical risk when a hemangioma is very large (>10 cm) or in a troublesome area (Nufer et al. 1999). Large symptomatic hemangiomas that continue to grow have a 5 % risk of rupture. Prognosis is good after resection.
8.1.3.3 Abscess
Patients with liver abscess (circumscribed collection of purulent exudates) will have sepsis with severe symptoms such as fever, upper abdominal pain, nausea, and vomiting. They will not be participating in MRI screening.
8.1.4 MRI Morphology of Solid Liver Lesions
Non-contrast-enhanced screening MR images provide only limited information for the characterization of solid liver lesions. Benign solid liver lesions include FNH and hepatocellular adenoma. No less common are malignant liver lesions such as metastasis, hepatocellular carcinoma, and cholangiocellular carcinoma. Several criteria have been proposed to differentiate between benign and malignant liver lesions on the basis of unenhanced MR imaging (Table 8.3) (Grebe et al. 1994). All solid liver lesions that are not cystic on unenhanced images require further evaluation (ultrasound, contrast-enhanced ultrasound, biphasic computed tomography, contrast-enhanced MRI).
Table 8.3
Criteria for assessing the malignancy of focal liver lesions on non-contrast-enhanced MRI
Sensitivity | Specificity | |
|---|---|---|
T1 weighting | ||
Hypointense to liver | 0.90 | 0.023 |
Hypointense to spleen | 0.40 | 0.60 |
Hyperintense to muscle | 0.43 | 0.67 |
Heterogeneous | 0.50 | 0.52 |
Lesion demarcation: irregular, blurred | 0.37 | 0.86 |
T2 weighting | ||
Hyperintense to liver | 0.93 | 0.02 |
Hypo- or isointense to spleen | 0.73 | 0.90 |
Hyper- or isointense to muscle | 1.00 | 0.02 |
Heterogeneous | 0.87 | 0.50 |
Lesion demarcation: irregular, blurred | 0.43 | 0.90 |
8.1.5 MRI Morphology of Benign Solid Liver Lesions
8.1.5.1 Focal Nodular Hyperplasia
Focal nodular hyperplasia (FNH) is a benign proliferation of hepatocytes and matrix components and is characterized by the presence of abnormal vascular or biliary structures. The pathogenesis of FNH is a matter of debate. An association with the use of hormones, especially oral contraceptives, has been postulated (Eisenberg and Margulis 1991). Autopsy studies have revealed a prevalence of 2–8 % for this tumor (Buetow et al. 1996). FNH is the third most common benign liver tumor and is seen predominantly in women of reproductive age, with a female-to-male ratio of 8:1 (Stocker and Ishak 1981; Dröge et al. 1996). Individuals with FNH often have other liver tumors such as hemangiomas or hepatocellular adenomas. Asymptomatic FNH is almost exclusively discovered as an incidental finding at autopsy, elective surgery, or imaging performed for other reasons (Figs. 8.6 and 8.7). Symptomatic FNH is very rare, presenting with right upper quadrant abdominal pain. The risk of rupture is less than 1 % (Dröge et al. 1996).
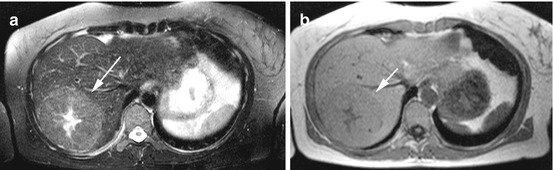
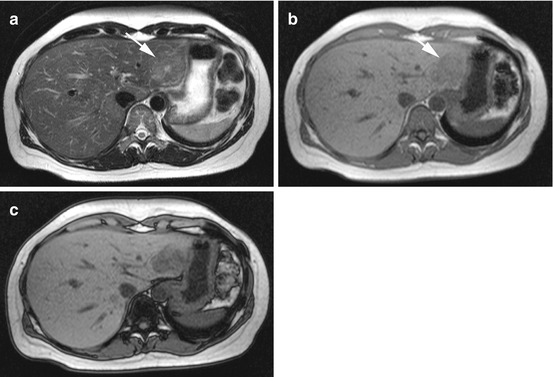
Fig. 8.6
A 36-year-old female subject with incidentally detected focal nodular hyperplasia (arrow). (a) Fat-saturated T2w TSE image reveals a slightly hyperintense lesion with central scar in segment VII. The characteristic spoke wheel pattern confirms the diagnosis of FNH. (b) T1w FLASH image reveals the anatomic relationship of the focal liver lesion
Fig. 8.7
A 48-year-old female subject with incidentally detected focal nodular hyperplasia (arrow). (a) Fat-saturated T2w TSE images reveals a slightly hyperintense lesion with central scar in segment III. (b) 2D T1w FLASH images shows the anatomic relationship of the focal liver lesion. (c) Out-of-phase chemical shift image shows loss of signal intensity in the lesion, confirming the presence of fat. Fat is present in up to 50 % of FNHs
Clinical Management
In the absence of a central scar, no definite FNH diagnosis can be made, and a contrast-enhanced scan should be considered to rule out other solid liver tumors. If, however, there are no doubts about the diagnosis, no treatment is required as there is no risk of malignant transformation, and the risk of rupture is less than 1 %. Elective surgical resection is an option for symptomatic FNH (Rückert et al.). The prognosis is good.
8.1.5.2 Hepatocellular Adenoma
Adenoma of the liver is rare and difficult to detect with unenhanced MRI because it is nearly isointense to liver parenchyma on both T1- and T2-weighted images (Fig. 8.8). Hepatic adenomas are nearly exclusively found in women with a long history of oral contraceptive use (>5 years) and in patients with diabetes mellitus. They are most common in young women of reproductive age with a peak between the third and fourth decades. In men, hepatocellular adenoma has been associated with the use of anabolic steroids.
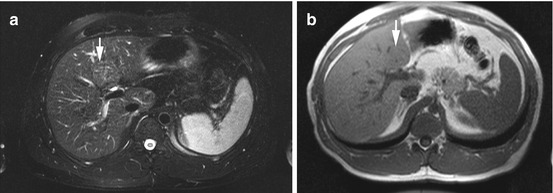
Fig. 8.8
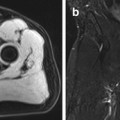
An 18-year-old female subject with incidentally detected hepatocellular adenoma (arrow). (a) Fat-saturated T2w TSE image and (b) 2D T1w FLASH image show nearly isointense mass in central segment IV. The mass is 4.3 cm in size and appears to displace surrounding structures; adjacent bile ducts are dilated
The occurrence of multiple adenomas (n > 10) is known as adenomatosis and is frequently seen in patients with type I/type III glycogen storage disease. Symptoms depend on the size of adenoma. Approx. 40 % of patients report upper abdominal discomfort. Rupture with hematoperitoneum has been observed in 20 % of cases. Spontaneous rupture is more common during the menstrual period, pregnancy, and after delivery. There is a risk of malignant transformation to hepatocellular carcinoma that increases with lesion size: 5 % for adenomas <10 cm and 10 % for adenomas >10 cm.
Clinical Management
Because they are isointense to surrounding parenchyma on T1- and T2-weighted images, hepatocellular adenomas are easily overlooked by non-contrast-enhanced MRI. Close follow-up is recommended for adenomas <5 cm. Oral contraceptives or other hormones should be discontinued. Larger adenomas (>5 cm) should be resected due to the risk of malignant transformation and rupture (Chuang et al. 2002; de Wilt et al. 1998). The risk of rupture is higher during pregnancy. Some authors advocate elective surgical resection of all hepatocellular adenomas, regardless of size or symptoms (Rückert et al.). The prognosis is good after radical surgical resection.
8.1.6 MRI Morphology of Malignant Solid Liver Lesions
8.1.6.1 Liver Metastasis
Metastatic disease is by far the most common hepatic malignancy, being 20 times more frequent than primary liver malignancy. Up to 50 % of cancer patients are found to have liver metastases at autopsy. Metastatic spread to the liver occurs through the systemic or portal venous circulation. Liver metastases are most common in patients with primary cancer of the colon or rectum (42 %), stomach (23 %), pancreas (21 %), breasts (14 %), and lungs (13 %). In terms of imaging morphology and histology, liver metastases mimic the primary tumor. Patients with single or multiple hepatic metastases may have concomitant lymph node involvement and metastatic spread to other organs.
Non-contrast-enhanced MR imaging usually shows multifocal lesions with unspecific low T1 signal intensity and mild hyperintensity (isointensity to spleen) on T2 weighting (Fig. 8.9). Hepatic metastases typically have markedly shorter T2 relaxation times than cysts or hemangiomas. An occasional metastasis has an appearance suggesting a cyst-like lesion. Generally, there are several imaging signs that suggest metastasis on unenhanced MR images (Table 8.4) (Wittenberg et al. 1988). These are very important to look for in the screening situation. With T1-weighted images, it is usually impossible to differentiate metastases from other focal liver lesions.
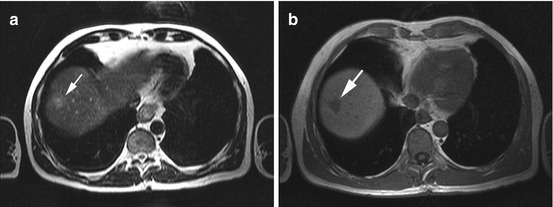
Fig. 8.9
A 68-year-old male subject with incidentally detected subdiaphragmatic focal liver lesion in segments VII/VIII (arrow). Subsequent diagnostic workup revealed colorectal cancer with metastatic spread to the liver that had not been diagnosed before. (a) T2w TSE image shows a high-signal-intensity mass with target sign. (b) On the corresponding 2D T1w FLASH images, the lesion has low signal intensity
Table 8.4
Imaging signs of liver metastases on non-contrast-enhanced MRI
T1 weighting | Doughnut sign |  |
27 % of all metastases | ||
6 % of benign lesions | ||
Low-signal-intensity center surrounded by a slightly less hypointense rim, indicating central necrosis | ||
T2 weighting | Target sign |  |
26 % of all metastases | ||
High-signal-intensity center surrounded by a slightly less hyperintense rim, indicating partial necrosis | ||
Halo sign |  | |
13 % of all metastases | ||
Bright rim around the lesion, indicating perifocal edema | ||
Heterogeneous |  | |
45 % of all metastases | ||
Blurred lesion contour and signal intensity isointense to spleen |
Clinical Management
Most liver metastases cannot be reliably diagnosed using unenhanced MRI alone. If solid liver lesions are detected, the next step involves noninvasive additional imaging modalities for further evaluation (contrast-enhanced CT/MRI). If there is a high suspicion of malignancy, thin-needle biopsy is indicated. Treatment of liver metastases depends on the primary tumor and the total tumor burden. When there is diffuse metastatic involvement of the liver, systemic chemotherapy is often the first-line treatment option. Surgical resection is only indicated in 5 % of cases and is restricted to patients with one or a few hepatic metastases. Interventional ablation and embolization are alternative options. Patients with metastatic liver disease have a poor overall prognosis, but the disease course may vary depending on the primary tumor.
8.1.6.2 Hepatocellular Carcinoma
Hepatocellular carcinoma (HCC) is the most common primary malignant neoplasm of the liver, and dysplastic nodules are assumed to be precancerous lesions of HCC. HCC accounts for 5.6 % of all tumors worldwide, with incidence rates of 7.1/100,000 population/year in men and 2.7/100,000/year in women (Velázquez et al. 2003). HCC is the fifth most common malignancy in men and the eighth most common malignancy in women, causing 250,000–1,000,000 deaths worldwide each year. Risk factors for HCC are cirrhosis, viral hepatitis, fatty liver disease, hemochromatosis, and aflatoxin exposure. Patients usually have advanced inoperable HCC by the time the first symptoms appear. Symptoms include malaise, fever, abdominal pain, weight loss, and, rarely, symptoms of jaundice (Ros et al. 1990). Liver function tests are typically elevated, reflecting parenchymal damage. More than half of patients have an elevated α-fetoprotein (AFP) level. HCC releases proteins and can cause paraneoplastic syndrome (erythrocytosis, hypercalcemia, hyperglycemia, hirsutism) (Kew 1998).
Clinical Management
A large invasive HCC is straightforward to diagnose; the differential diagnosis includes only cholangiocellular carcinoma and large metastasis (Figs. 8.10 and 8.11). A smaller HCC may be confused with regenerative nodules in a cirrhotic liver or with other focal lesions. A contrast-enhanced scan may be needed if the diagnosis is unclear. Metastasis is extremely rare in a cirrhotic liver, and this should be borne in mind when considering differential diagnoses. Curative treatment is usually not possible because most patients have multifocal HCC, a large tumor bulk, or extensive cirrhosis at the time of diagnosis. A variety of interventional embolization procedures are available for palliative treatment. Total mortality is >90 %. Mean survival after diagnosis is 6 months with a 5-year survival rate of 30 %.
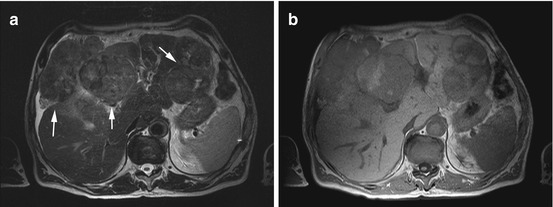
Fig. 8.10
A 72-year-old male subject with incidentally detected large hepatocellular carcinoma (arrows). (a) Axial T2w TSE image with shows heterogeneous tumor nodules with extrahepatic extension in segment IV and in the left hepatic lobe. (b) 2D T1w images shows multifocal malignancy with central hyperintensity
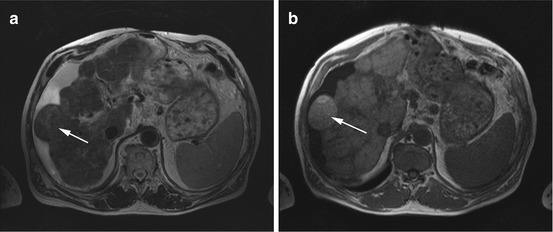
Fig. 8.11
A 54-year-old cachectic man without symptoms at the time of whole-body MRI screening. (a) Axial T2w TSE image demonstrates diffuse septation of liver parenchyma, hypertrophy of the caudate lobe, a nodular liver contour, and perihepatic ascites (indicating decompensated cirrhosis). (b) T1w FLASH images shows high-signal-intensity nodule with extrahepatic extension in segment VII/VIII. The diagnosis of HCC (arrow) was confirmed later
8.1.6.3 Cholangiocellular Carcinoma
Cholangiocellular carcinoma (CCC) is a malignant tumor arising from the small (peripheral CCC – 6 %; Fig. 8.12) or large bile ducts (hilar CCC – 67 %; Fig. 8.13) inside the liver or from the extrahepatic bile ducts (27 %) (Blum 1995). Unlike HCC, CCC usually occurs in the noncirrhotic liver. Peripheral CCC is much less common than HCC, constituting approx. 10–20 % of primary malignant liver tumors. The incidence is 0.8/100,000 population/year (Shaib and El-Serag 2004). A variety of risk factors have been identified, including carcinogen exposure (nitrosamines, aflatoxins, anabolic steroids), congenital anomalies of the bile ducts, and other predisposing conditions (primary sclerosing cholangitis, ulcerative colitis, α-antitrypsin deficiency, chronic hepatitis C, alcoholic and nonalcoholic hepatitis).
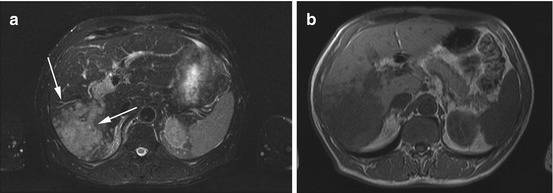
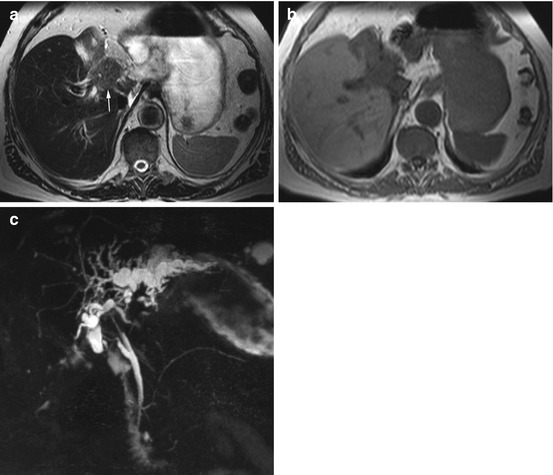
Fig. 8.12
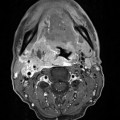
A 67-year-old asymptomatic male subject with incidentally detected mass (arrows) in the right hepatic lobe. Subsequent invasive diagnostic workup demonstrated cholangiocellular carcinoma. (a) Fat-saturated T2w TSE image demonstrates high-signal-intensity mass in the right hepatic lobe with segmental portal vein invasion. (b) On 2D T1 weighted FLASH image, the lesion has lower signal intensity than surrounding liver
Fig. 8.13
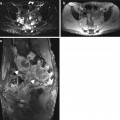
A 73-year-old male subject without symptoms at the time of incidental detection of a central mass with segmental congestion of the bile ducts in the left hepatic lobe and consecutive atrophy of the left lobe (arrow). (a, b) T2w TSE and T1w FLASH images show central mass. (c) MRCP image suggests central cholangiocellular carcinoma (Klatskin tumor)
Clinical Management
Elective surgery is the only treatment for CCC patients that offers a chance of cure.
8.1.7 Structural Abnormalities of the Liver
8.1.7.1 Cirrhosis
Cirrhosis is a chronic diffuse condition of the liver characterized by necrosis and loss of the lobular architecture (Fig. 8.14). Normal hepatocytes are replaced by fibrous connective tissue and regenerative hepatic nodules. Cirrhosis is twice as common in men as in women and presents in middle-aged to elderly adults. The incidence of cirrhosis is 250/100,000 population/year. Cirrhosis is commonly caused by chronic intake of alcohol or medications or develops secondary to viral hepatitis. Rare etiologies include hepatic iron overload, bile duct diseases (primary biliary cirrhosis, primary sclerosing cholangitis), and autoimmune diseases. Clinical symptoms are nonspecific and occur late in the course of disease. They include fatigue, loss of weight, jaundice, and an increase in body circumference due to ascites in advanced cirrhosis. The morphologic imaging features of cirrhosis are summarized in Table 8.5.
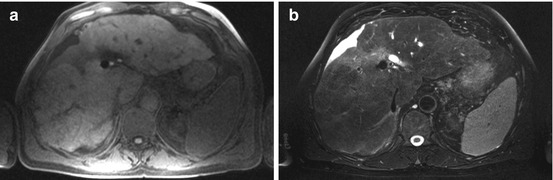
Fig. 8.14
A 75-year-old male subject with diagnosis of cirrhosis based on MR morphology. (a) T1w and (b) T2w images show typical signs of cirrhosis including enlarged left lateral and caudate lobes, irregular surface, and irregular intrahepatic septa
Table 8.5
Morphologic imaging findings in cirrhosis
Liver surface nodularity |
Enlargement of the caudate and left lobes |
Atrophy of the right lobe |
Septations and fibrotic strands within the liver |
Diffuse hepatic nodules (regenerative nodules) |
Macronodular/micronodular cirrhosis |
Dilated portal vein |
Splenomegaly |
Portocaval collateral circulation |
Ascites (advanced cirrhosis) |
Clinical Management
Cirrhosis is an irreversible damage to liver parenchyma without a chance of cure. Management focuses on stopping exposure to the damaging substance or treating the underlying cause. Most subjects know that they have cirrhosis.
Regenerative nodules can mimic malignant lesions. HCC is associated with cirrhosis in over 80 % of patients. A suspicious lesion detected in a cirrhotic liver should be evaluated by a dynamic contrast-enhanced series.
8.1.7.2 Hepatic Steatosis
Fatty infiltration of the liver is a common incidental finding; it can be caused by diabetes mellitus, obesity, and abuse of alcohol or other chemical substances. Individuals in whom fatty liver progresses to cirrhosis have an increased risk of HCC or may develop fatal liver failure (unless a transplant is available). The reported prevalence ranges between 10–24 % for alcoholic hepatosteatosis and 3–58 % for nonalcoholic fatty liver disease (NAFLD) (Angulo 2002; Kojima et al. 2003). This wide variation is mainly attributable to socioeconomic factors (Kojima et al. 2003).
Clinical Management
Incidentally detected fatty liver can usually be left untreated (Fig. 8.15). Nutritional counseling aimed at stopping intake of the damaging substance (alcohol, other chemical substances) and better treatment of underlying disease (diabetes mellitus) are desirable. Focal steatosis and focal sparing can suggest a malignant liver lesion. If malignancy can be reliably ruled out, no further diagnostic tests are required.
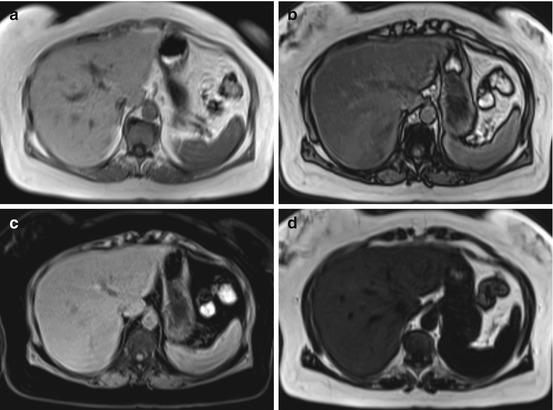
Fig. 8.15
A 56-year-old obese female subject. Chemical shift-encoded MRI allows determination of liver fat. (a, b) Signal intensity drop on out-of-phase images demonstrates diffuse fatty infiltration of the liver. Supplementary fat-saturated (c) and water-saturated (d) images confirm the diagnosis of hepatic steatosis
8.1.7.3 Hepatic Iron Overload
Abnormal iron deposition in the body occurs in primary (genetic) hemochromatosis or as an acquired condition. Acquired iron overload is due to increased intake and accumulation of iron secondary to a known cause such as multiple transfusions (Robson et al. 2000). Iron shortens T2 and T2* relaxation times, resulting in a loss of signal on T1-weighted and T2-weighted MR images (Fig. 8.16). New MRI approaches permit noninvasive quantification of liver iron by measurement of either T2 shortening or T2* decay (FERRISCAN; Gandon et al. 2004


Related posts:

Stay updated, free articles. Join our Telegram channel
Full access? Get Clinical Tree
