Frequency
Prevalence of approx. 0.5 %
Age predilection
Any age
Sex predilection
F:M ratio of 3–5:1
Location
60 % middle cranial fossa
10 % cerebellopontine angle
10 % suprasellar
10 % other
Type of lesion
Benign
Signs and symptoms
Asymptomatic
Very large cysts may rarely cause headache, vertigo, sensorineural hearing loss, facial hemispasm
Differential diagnosis
Epidermoid
Chronic subdural hematoma
Subdural hygroma
Nonneoplastic intra-axial cysts
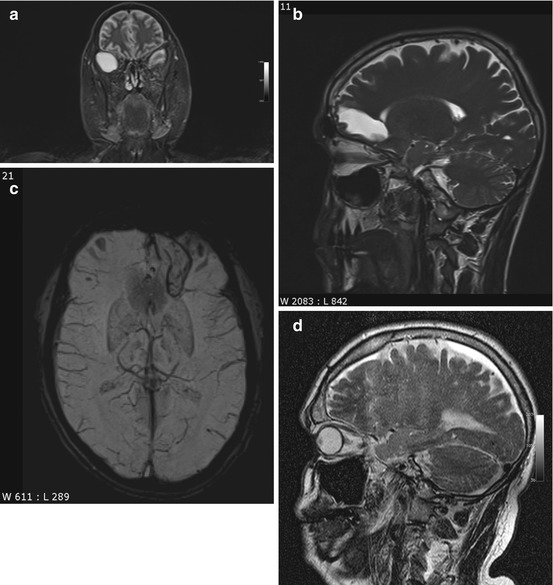
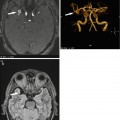
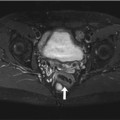
Fig. 5.1
Incidental screening findings in several subjects. (a) A 42-year-old male subject with a cystic mass in the middle cranial fossa on the right side. Coronal T2w TIRM image shows no reactive changes in surrounding brain. The lesion is isointense to fluid with all weightings, consistent with an arachnoid cyst. (b, c) A 33-year-old male subject with an intra-axial cyst in the left frontobasal region on sagittal T2w TSE image (b). Susceptibility-weighted image (c) demonstrates hemosiderin deposition, consistent with a defect after contusion. (d) A 51-year-old male subject with a convex extra-axial parietal mass of high signal intensity on sagittal T2w TSE image
Clinical Management
Most arachnoid cysts are asymptomatic, and there is no need for follow-up as long as the MRI diagnosis is not in doubt. If an arachnoid cyst is very large and the mass effect causes complications, fenestration may be indicated (Cincu et al. 2007). The most important differential diagnosis is epidermoid cyst, which has high signal intensity on FLAIR images and DWI. SWI is useful for differentiation of an arachnoid cyst from a posttraumatic brain lesion, the latter typically being surrounded by hemosiderin. A subdural hygroma or hematoma is usually not isointense to CSF on all sequences and covers the brain surface in a cap-like manner. If these MRI techniques do not produce a diagnosis, it should be determined whether the subject has a history of head trauma.
5.1.2.2 Colloid Cysts
Colloid cysts are congenital intraventricular tumors and contain mucin. They arise from the rostral roof of the third ventricle close to the interventricular foramen (Grunwald et al. 2007), varying in size from a few millimeters to 3 cm (Table 5.2). Because they contain cholesterol, colloid cysts typically have high signal intensity on T1-weighted images (Fig. 5.2a) and tend to be isointense to brain on T2-weighted images (Fig. 5.2b). There is no signal drop on FLAIR images (Wilms et al. 1990). Due to their vicinity to the interventricular foramen, colloid cysts can cause chronic intermittent obstruction of CSF flow. Although they are congenital, most colloid cysts do not become apparent until age 30–50, when they typically present with intermittent headache. The differential diagnosis includes infection and CSF flow artifact (Prasad et al. 2008). In most cases, flow artifact can be ruled out by looking at images acquired with different weighting and in a different plane.
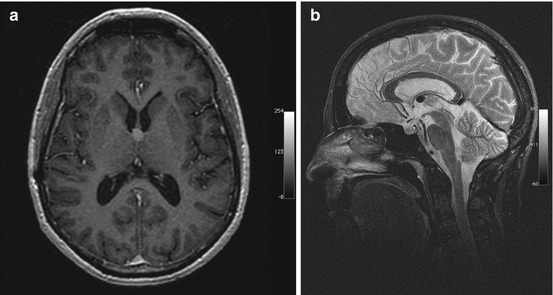
Table 5.2
Colloid cysts
Frequency | 0.5–1 % of all primary brain tumors |
15–20 % of all intraventricular masses | |
Age predilection | Individuals aged 40; rarely in children |
Sex predilection | F = M |
Location | Rostral roof of the third ventricle close to the interventricular foramen |
Very rarely in other sites (lateral ventricles, 4th ventricle, extraventricular) | |
Type of lesion | Benign |
Signs and symptoms | Asymptomatic |
Risk of obstruction of interventricular foramen with acute obstruction of CSF flow (life-threatening) | |
Differential diagnosis | Neurocysticercosis |
Flow artifact | |
Tumor (subependymoma, craniopharyngeoma) |
Fig. 5.2
Incidental screening finding and preoperative imaging in a 38-year-old female subject. (a) Axial T1w MPR image depicts a smoothly marginated lesion of high signal intensity at the roof of the third ventricle, suggesting a colloid cyst. (b) Preoperative sagittal T2w IR-TSE image shows a homogeneous lesion of low signal intensity
Clinical Management
The risk of acute CSF obstruction should prompt timely workup of a colloid cyst by a neurosurgeon (Tirakotai et al. 2004). A suspected colloid cyst with an atypical shape should always be assessed further by contrast-enhanced MRI to rule out an inflammatory process or malignancy.
5.1.2.3 Choroid Plexus Cysts
A choroid plexus cyst is a nonneoplastic, noninflammatory cyst of the choroid plexus (Naeini et al. 2009). In adults, it is the most common choroid plexus lesion. The adult form, also known as xanthogranuloma, is typically degenerative in nature. Most choroid plexus cysts are bilateral and located in the trigone. The majority are small, measuring 2–8 mm. Cysts greater than 2 cm are very rare. Multiple cysts are common (Kariyattil and Panikar 2008) (Table 5.3). The MRI signal intensity relative to CSF is isointense to slightly hyperintense on T1-weighted images, hyperintense on T2-weighted images, and isointense on FLAIR images (Fig. 5.3). Peripheral calcification is common and can be detected on susceptibility-weighted images. DWI demonstrates restricted diffusion in approx. 60 % of choroid plexus cysts (Bonneville et al. 2007).
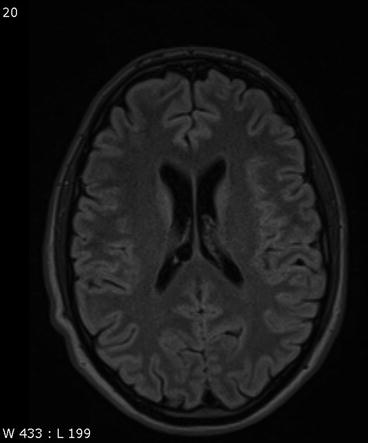
Table 5.3
Choroid plexus cysts
Frequency | Prevalence increases with age |
Age predilection | Any age |
Sex predilection | M = F |
Location | Trigone bilaterally |
Type of lesion | Benign |
Signs and symptoms | Asymptomatic |
Differential diagnosis | Inflammatory processes |
Ependymal cyst | |
Malignancy |
Fig. 5.3
Incidental screening finding in a 43-year-old female subject. Axial T2w FLAIR image shows a smoothly demarcated mass isointense to CSF in the choroid plexus on the right side. The appearance is consistent with a choroid plexus cyst
Clinical Management
If there is no doubt about the diagnosis of a choroid plexus cyst, no additional diagnostic measures are needed. If it is not possible to clearly localize the cyst to the choroid plexus, the topographic relationship should be assessed further using a high-resolution T2-weighted sequence (e.g., CISS, constructive interference in steady state). A contrast-enhanced MRI examination should be performed to rule out an inflammatory process or malignant tumor.
5.1.2.4 Intra-axial Cystic Lesions
Neuroepithelial or neuroglial cysts are benign developmental cysts lined with epithelium. These cysts are more often supratentorial than infratentorial in location, and they are most commonly found in the frontal lobe and close to the lateral ventricle. They vary considerably in size, from a few millimeters to several centimeters, and typically cause no symptoms (Table 5.4). Neuroepithelial cysts are isointense to CSF on T1-weighted and T2-weighted images. On FLAIR images, there is no abnormal high signal intensity of surrounding brain (Bergui et al. 2001; Poptani et al. 1995).
Table 5.4
Intra-axial cystic lesions
Frequency | Prevalence increases with age |
Age predilection | Any age |
Sex predilection | M = F |
Location | Supra- and infratentorially, predominantly in the frontal lobe and in close relationship to a lateral ventricle |
Type of lesion | Benign |
Signs and symptoms | Typically asymptomatic; large cysts may cause symptoms |
Differential diagnosis | Inflammatory processes |
Ependymal cyst | |
Malignancy |
Neuroepithelial cysts must not be confused with enlarged perivascular spaces, also known as Virchow-Robin spaces, which are interstitial, fluid-filled perivascular channels lined by pia mater (Fig. 5.4a, b). These spaces surround penetrating arteries as they enter the brain and are not contiguous with the subarachnoid space. Common locations are the basal ganglia, midbrain, deep white matter, subinsular cortex, and external capsule. Virchow-Robin spaces are usually <5 mm in diameter but may become very large, causing local mass effect. They are also isointense to CSF with all pulse sequences. In approx. 25 % of cases, however, the surrounding brain has increased signal intensity on FLAIR images (Fig. 5.4c) (Kwee and Kwee 2007).
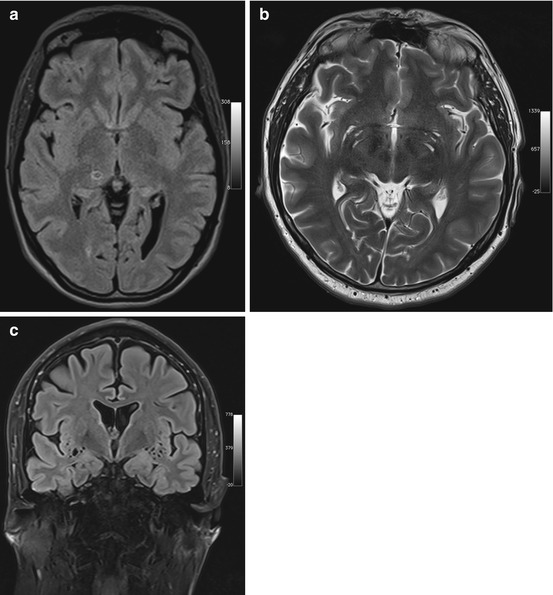
Fig. 5.4
Incidental screening findings and workup in two subjects. (a) A 42-year-old male subject with a smoothly marginated lesion isointense to CSF in the thalamus on the right and slightly increased signal intensity of surrounding brain on axial T2w FLAIR image. This appearance suggests an enlarged perivascular space. (b, c) In a second case, a 23-year-old man, enlarged perivascular spaces are demonstrated by MRI workup performed at 3 T. There is enlargement of the perivascular spaces in the basal ganglia on axial T2w TSE image (b) and in the insular region bilaterally on coronal T2w FLAIR image (c)
Clinical Management
If the vessel surrounded by an enlarged perivascular space is not identified as a flow void on T2-weighted images, the MRI appearance may not allow differentiation between a Virchow-Robin space and a neuroepithelial cyst. This distinction, however, has no clinical relevance. Enlarged perivascular spaces will be seen nearly anywhere in the brain, especially when MRI is performed at higher field strength. They are also found in 30 % of children undergoing cerebral MRI. No follow-up is needed (“leave me alone lesions”). In contrast, a subject with a cystic lesion that has an atypical configuration and differs in signal intensity from CSF should undergo contrast-enhanced MRI to rule out an infectious lesion or a malignant tumor. In older subjects, especially those with risk factors, the differential diagnosis should always include a lacunar infarct.
5.1.2.5 Septum Pellucidum Variants
The septum pellucidum consists of two leaves forming a partition between the two lateral ventricles. Failure of the fetal septum pellucidum to obliterate can give rise to persistent CSF-filled spaces in this area. Three types are distinguished: the cavum septi pellucidi, which is located between the two anterior horns; the cavum vergae (Fig. 5.5a), which extends over the entire length of the septum; and the cavum veli interpositi (Fig. 5.5b), which is situated posteriorly and does not extend rostrally beyond the level of the interventricular foramen (Table 5.5) (Gangemi et al. 1997). The fluid-filled spaces are isointense to surrounding brain on T1-weighted and T2-weighted images, and DWI shows no diffusion restriction. If there is no signal drop on FLAIR images, the differential diagnosis should include epidermoid cyst (Donati et al. 2003).
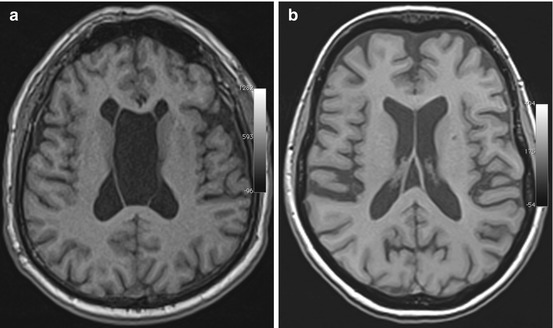
Fig. 5.5
Incidental screening findings in two subjects. (a) In a 41-year-old female subject, axial T1w MPR image demonstrates a hollow space isointense to CSF between the leaves of the septum pellucidum, consistent with a cavum vergae. (b) In a 59-year-old female subject, axial T1w MPR image demonstrates a cavum veli interpositi
Table 5.5
Septum pellucidum variants
Frequency | Cavum septi pellucidi, up to 20 % in adults |
Cavum vergae, <1 % in adults | |
Cavum veli interpositi, <1 % | |
Age predilection | Any age |
Sex predilection | F = M |
Location | Interventricular septum |
Type of lesion | Benign |
Signs and symptoms | Asymptomatic |
Differential diagnosis | Epidermoid cyst |
Clinical Management
Septum pellucidum variants are of no clinical significance, and no further diagnostic workup is required (Born et al. 2004).
5.1.2.6 Lipoma
Lipomas are very rare in the brain. They are congenital tumors containing normal fat. Intracranial lipomas are neither hamartomas nor true neoplasms (Radner et al. 2002). Intracranial lipomas commonly occur in the corpus callosum with more than 50 % in the posterior portion. Other sites include the quadrigeminal plate (Fig. 5.6), superior vermis, tuber cinereum, and hypophyseal stalk (Table 5.6) (Yildiz et al. 2006; Yilmazlar et al. 2005). Lipomas have high signal intensity on T1-weighted images and low signal intensity on T2-weighted SE images. With the T2-weighted TSE sequences now generally used for brain imaging, lipomas also have high T2 signal intensity.
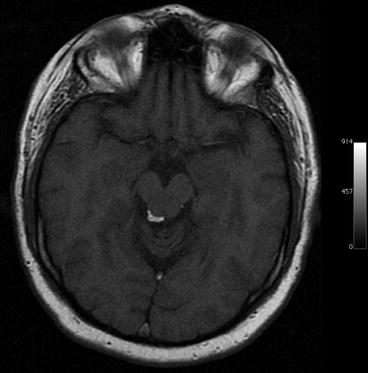
Fig. 5.6
Incidental screening finding in a 37-year-old male subject. Axial T1w MPR image shows a high-signal-intensity mass adjacent to the aqueduct, consistent with lipoma
Table 5.6
Lipoma
Frequency | <0.5 % of all intracranial masses |
Age predilection | Any age |
Sex predilection | F = M |
Location | 80 % supratentorial: 50 % interhemispheric fissure, 15 % suprasellar, 15 % pineal region |
20 % infratentorial: most commonly cerebellopontine angle | |
Type of lesion | Benign |
Signs and symptoms | Asymptomatic |
Differential diagnosis | Dural dysplasia |
Dermoid | |
Teratoma | |
Subacute hemorrhage |
Clinical Management
Most lipomas in the brain are asymptomatic and detected incidentally. When a lipoma is detected in an epileptic subject, attention must be paid to the presence of concomitant anomalies. If a confident diagnosis of lipoma cannot be made, MRI with fat suppression or even a cranial CT scan should follow.
5.1.3 Brain Tumors
5.1.3.1 Introduction
Brain tumors can be classified according to different criteria. They are generally divided into primary brain tumors (approx. 60 % of cases) and secondary or metastatic brain tumors (approx. 40 % of cases) (Radner et al. 2002; Rousseau et al. 2008).
Among primary brain tumors, an important distinction in terms of surgical management is made between intra-axial tumors, which arise in glial or neuronal cells, and extra-axial tumors, which compress the brain from the outside (Bonneville et al. 2007).
Primary brain tumors differ from tumors elsewhere in the body in that, even if they are histologically benign, they may have “malignant” potential due to their location and possible mass effect.
Most intracranial tumors can be detected without contrast medium administration. With few exceptions, contrast-enhanced MRI is only performed to obtain additional information for tumor characterization such as presence and extent of blood-brain barrier (BBB) disruption or degree of tumor vascularization (Niedermayer et al. 1998).
5.1.3.2 Intra-axial Tumors
5.1.3.2.1 Primary Brain Tumors
With an incidence of 8 per 100,000 population per year, primary brain tumors account for 1.4 % of all malignancies, and the risk increases with age (Table 5.7) (Chamberlain and Kormanik 1998). The WHO classification of brain tumors is the most widely utilized classification scheme (Radner et al. 2002; Rousseau et al. 2008). Last revised in 2007, it classifies primary brain tumors according to their tissue of origin and additionally distinguishes four histologic grades based on biological activity (WHO I-IV). The majority of primary brain tumors are of glial origin. Astrocytomas are the most common gliomas, constituting approx. 60 % of cases. Approx. 65–75 % of astrocytomas are accounted for by higher-grade anaplastic astrocytoma (WHO III) and glioblastoma multiforme (WHO IV).
Table 5.7
Primary brain tumors
Frequency | 8/100,000 population/year |
Age predilection | Low-grade tumors: children and young adults aged 20–40 |
Higher-grade tumors: typically after age 50, rarely before age 30 | |
Sex predilection | M = F |
Location | Depends on histology |
Type of lesion | Depends on histology and location |
Signs and symptoms | Vary with tumor site: focal neurologic deficits or even stroke, obstruction of CSF flow, seizures in case of cortical tumors |
Differential diagnosis | Atypical infarction |
Postcontusional gliosis | |
Lymphoma | |
Metastasis | |
Inflammatory processes (abscess, tuberculosis) |
Clinical symptoms depend on tumor location and size. Brain tumors often present with a focal neurologic deficit or symptoms related to increased intracranial pressure. A seizure may be the initial symptom of a cortical tumor such as low-grade astrocytoma.
Low-grade brain tumors typically have uniform low T1 signal intensity (Fig. 5.7a) and appear bright on T2-weighted or FLAIR images (Pope et al. 2005). As there is usually no diffusion restriction, DWI can help in differentiating a brain tumor from atypical infarction. A small cortical tumor may be difficult to distinguish from posttraumatic gliosis, but the absence of signal voids on susceptibility-weighted images may be helpful in making the distinction. With increasing malignancy, a brain tumor becomes more inhomogeneous on both T1-weighted and T2-weighted images (Fig. 5.7b), and diffusion restriction also occurs (Seo et al. 2008).
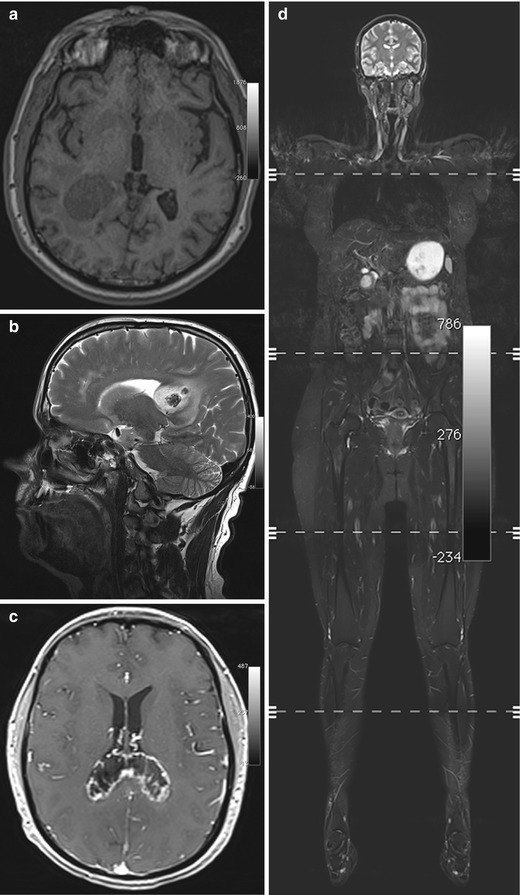
Fig. 5.7
Incidental screening findings and workup in two subjects. (a) A 39-year-old male subject with a solid mass in the periventricular white matter of the right trigone. Axial T1w MPR image demonstrates a lesion of homogeneously low signal intensity with only minimal perifocal edema. The histologic diagnosis was WHO grade III astrocytoma. (b–d) In a second subject, a 52-year-old woman, a sagittal T2w TSE screening image reveals an inhomogeneous mass in the splenium (b). At workup, the mass shows peripheral contrast enhancement on axial T1w FLASH image acquired at 3 T (c). In this case, the histologic diagnosis was B-cell lymphoma. The whole-body screening MRI, coronal T2w TIRM image (d), reveals no other lesion, confirming primary CNS lymphoma
Clinical Management
A subject with a suspected primary brain tumor requires prompt supplementary imaging with contrast-enhanced sequences for a comprehensive MRI evaluation (Fig. 5.7c). Along with information on tumor site and extent of perifocal edema, enhancement features contribute to determining the histologic grade. Timely neurosurgical consultation is also important. While higher-grade primary brain tumors must be differentiated from lymphoma and metastasis, this is usually not possible with conventional pulse sequences. However, whole-body MRI can help in identifying a possible primary tumor or, when lymphoma is suspected, in confirming or ruling out systemic disease (Fig. 5.7d).
5.1.3.3 Extra-axial Tumors
5.1.3.3.1 Pineal Cysts
Cystic lesions of the pineal region are among the most common incidental findings on cranial MRI, occurring in approx. 10 % of all examinations (Table 5.8) (Costa et al. 2008; Pu et al. 2007). Pineal cystic lesions measuring at least 5 mm should be classified as cysts (Sato and Kubota 2009). Pineal cysts typically have the same signal intensity as CSF on both T1-weighted and T2-weighted images (Fig. 5.8a). Depending on the protein content, the cyst fluid may have high signal intensity on FLAIR images. A benign pineal cyst can be septated and contain calcifications. Even contrast enhancement has been described.
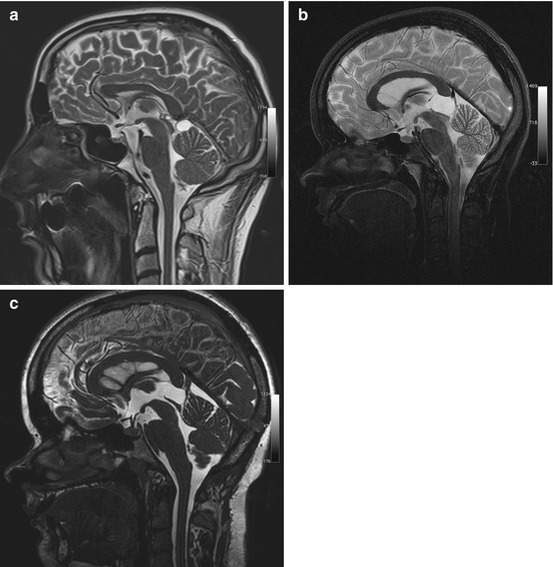
Table 5.8
Pineal cysts
Frequency | Detected in up to 10 % of all head MRI examinations |
Most common in women aged 20–30 | |
Age predilection | Puberty to age 40 |
Sex predilection | F:M ratio of 3:1 |
Location | Pineal compartment |
Type of lesion | Benign |
Signs and symptoms | Rare; tumors compressing the tegmentum and aquiduct may cause Parinaud syndrome or obstruct CSF flow |
Differential diagnosis | Arachnoid cyst |
Cavum veli interpositi | |
Meningioma | |
Pineocytoma (very rare) |
Fig. 5.8
Incidental screening findings in two subjects and postoperative follow-up. (a) A 36-year-old male subject with a cystic lesion of the pineal region. The cyst has a thin wall and causes no mass effect on the tegmentum, consistent with a pineal cyst. The sagittal T2w TSE image also reveals an infratentorial arachnoid cyst. (b, c) In a second subject, a 24-year-old woman, sagittal T2w TSE screening image shows a cyst of the pineal region with mass effect (b). She had a history of double vision and progressive headache. The sagittal T2w CISS image shows the situation after neurosurgical cyst fenestration (c)
Most pineal cysts are asymptomatic. Occasionally, a large cyst compressing the quadrigeminal plate (Fig. 5.8b, c) may cause Parinaud syndrome or headache due to obstruction of CSF flow.
The most important differential diagnoses are infratentorial arachnoid cyst and cavum veli interpositi. If solid components predominate, the differential diagnosis also includes meningioma originating in the tentorium, falx, or velum interpositum. Primary pineal tumors are extremely rare (<1 % of intracranial tumors).
Clinical Management
As pineal cysts are very common, follow-up should be purely clinical (Tirakotai et al. 2004). A contrast-enhanced MRI scan is recommended for pineal cysts first diagnosed in adults over 40, for cysts with an irregular and thickened wall (≥2 mm), and for cysts with solid components.
5.1.3.4 Sellar Lesions
5.1.3.4.1 Pituitary Adenoma
The anatomy of the sella turcica is complex. With the cavernous sinus adjacent to it, the cranial nerves running through it, and the internal carotid artery lying in close proximity, this rather small region includes many important anatomic structures as well as a variety of tissues, giving rise to a wide spectrum of congenital and acquired lesions. In general, sellar MRI should be performed by acquiring thin-slice T2- and T1-weighted sequences (≤3 mm slice thickness) before and after contrast medium administration. These sequences are usually not included in a whole-body screening protocol, often making it difficult to differentiate sellar lesions on screening datasets.
Pituitary adenoma is the most common intrasellar mass, constituting approx. 10–15 % of all intracranial tumors (Table 5.9) (Rousseau et al. 2008; Glezer et al. 2008). The pituitary gland consists of two major divisions, the adenohypophysis (anterior lobe) and the neurohypophysis (posterior lobe). Adenomas arise in the anterior lobe. The normal pituitary gland is isointense relative to brain on both T1-weighted and T2-weighted images. On sagittal images, the normal size of the pituitary gland is ≤10 mm in women (Donovan and Nesbit 1996; Cox and Elster 1991) and ≤8 mm in men. An increased diameter is normal in pregnant and breast-feeding women. In about half of individuals below 35 years of age, the cranial portion of the pituitary gland has a convex shape (Donovan and Nesbit 1996).
Table 5.9
Pituitary adenoma
Frequency | 10–15 % of all intracranial neoplasms |
Age predilection | 30–60 years |
Sex predilection | F:M ratio of 2:1 |
Location | Intrasellar, parasellar, suprasellar |
Type of lesion | Benign |
Signs and symptoms | Functioning adenomas: effects vary with the hormone produced |
Local mass effect on optic chiasm and cavernous sinus with cranial nerve paresis (III, IV, VI) | |
Differential diagnosis | Craniopharyngioma |
Meningioma | |
Internal carotid artery aneurysm with (partial) thrombosis | |
Pars intermedia cyst, Rathke cleft cyst | |
Epidermoid/dermoid cysts |
Pituitary adenomas are classified by size and hormonal activity. By definition, a microadenoma is less than 10 mm in diameter, while a macroadenoma is 10 mm or larger (Fig. 5.9a). Based on hormonal activity, a distinction is made between functioning and nonfunctioning tumors (30 % of pituitary adenomas). Most nonfunctioning adenomas are macroadenomas. They typically come to clinical attention due to local mass effect causing bitemporal hemianopia by compressing the optic chiasm or causing paresis of cranial nerves III, IV, and VI by invading the cavernous sinus. Conversely, microadenomas present with symptoms related to excess hormone production.
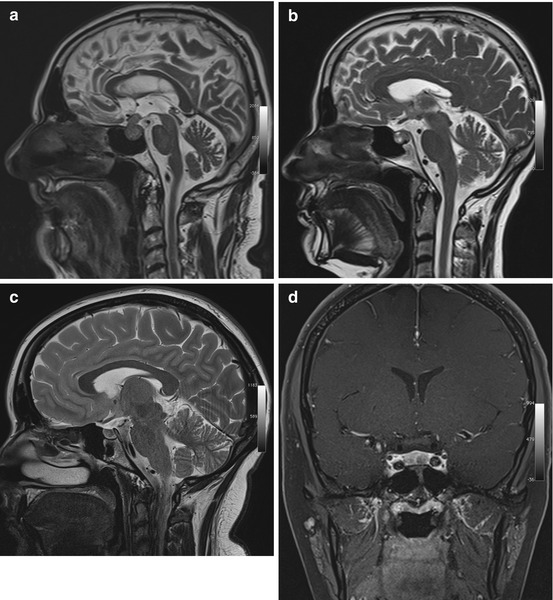
Fig. 5.9
Incidental screening findings and workup in three subjects. (a) A 52-year-old male subject with a sellar mass on sagittal T2w TSE image. The mass is isointense to white matter and compresses the optic chiasm by suprasellar expansion. The appearance is consistent with a macroadenoma, which was histologically proven. (b) In a second subject, a 49-year-old woman, sagittal T2w TSE image demonstrates a sellar mass with cystic and solid components. Laboratory testing revealed markedly elevated growth hormone (GH), consistent with an adenoma. (c, d) In a third subject, a 24-year-old woman, sagittal T2w TSE image shows borderline enlargement of the sella and pituitary gland (c). She reported a history of amenorrhea. Laboratory testing revealed elevated prolactin. Diagnostic workup with 3-T MRI demonstrates a perfusion deficit of the sella, as shown on coronal T1w SE image with fat saturation after contrast medium administration (d). The findings are consistent with a microprolactinoma
Pituitary adenomas characteristically have a solid appearance but may also have cystic components or be completely cystic (Fig. 5.9b). The differential diagnosis includes craniopharyngioma, especially when the cyst fluid has high T1 and T2 signal intensity and when the largest portion of the tumor is suprasellar in location (Karavitaki et al. 2008). Other differential diagnostic considerations for intrasellar cystic lesions include Rathke cleft cysts, pars intermedia cysts, epidermoids, and dermoid cysts (Glezer et al. 2008; Noh et al. 2007; Naylor et al. 1995), all of which have high T1 signal intensity and low T2 signal intensity.
Clinical Management
All sellar masses should be followed up using contrast-enhanced MRI. When a microadenoma is suspected, a dynamic contrast-enhanced series should be acquired. Alternatively, an MRI examination at half the usual contrast medium dose should be performed, as otherwise a small lesion may be obscured by rapidly enhancing normal pituitary tissue (Fig. 5.9c, d). The radiologist must be aware that seemingly normal changes, especially in the adenohypophysis, may mask a tumor. When an abnormality is suspected, the subject’s history may provide further clues.
A pituitary lesion with suprasellar or parasellar extension and compression or infiltration of surrounding structures requires timely primary neurosurgical workup; in other cases, the first diagnostic step is medical/endocrinologic workup.
5.1.3.4.2 Meningioma
Meningiomas are the second most common primary brain tumors after gliomas. With an incidence of approx. 6/100,000 population, meningiomas account for 13–26 % of primary brain tumors (Rousseau et al. 2008). They are most common between the ages of 40 and 70, and they are more common in women than in men (ratio of 3:2 to 2:1) (Table 5.10).
Table 5.10
Meningioma
Frequency | 13–26 % |
Age predilection | 50–70 years |
Sex predilection | F:M ratio of 3:2 to 2:1 |
Location | Parasagittal, falx, sphenoid ridges, skull base, posterior cranial fossa, intraventricular, optic nerve |
Type of lesion | Benign |
Signs and symptoms | Most meningiomas are asymptomatic |
Focal neurologic deficits may occur, depending on site and extent of meningioma | |
Differential diagnosis | Metastasis |
Extramedullary hematopoiesis |
Meningiomas arise from arachnoid cap cells, and, because they attach to the dura, they have a characteristic spherical shape. A less common diffuse type, called en plaque meningioma, grows in a flattened fashion along dural structures. The most frequent sites of occurrence of meningiomas are along the parasagittal convexities, along the falx, and along the sphenoid ridges in the hemispheres, at the skull base – particularly along the olfactory grooves and within the sella or in the parasellar region – and in the posterior cranial fossa (Fig. 5.10). Less commonly, meningiomas extend along the optic nerve or occur in intraventricular location. Up to 15 histologic subtypes are distinguished. Most meningiomas are WHO grade I tumors, and morphologic imaging features usually enable no further differentiation (Niedermayer et al. 1998; Nagar et al. 2008).
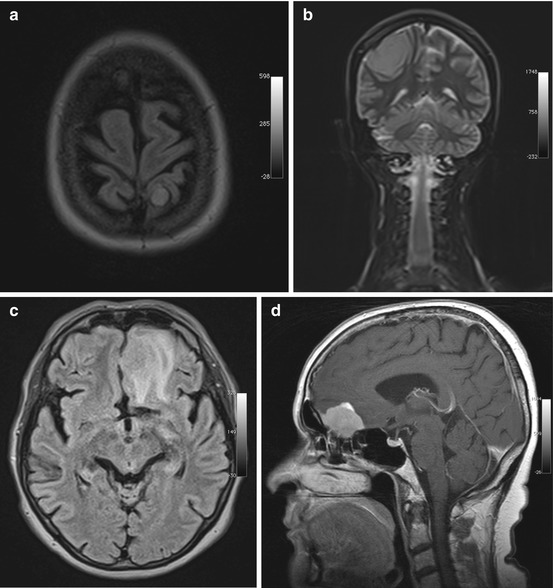
Fig. 5.10
Incidental screening findings in three subjects. (a) A 46-year-old female subject with a small left parietal parasagittal convexity meningioma. The lesion is isointense to white matter on axial T2w FLAIR image. There is no perifocal edema. (b) A 32-year-old female subject with a mass measuring approx. 8 cm. On coronal T2w TIRM image, the mass is isointense to white matter and protrudes convexly from the dura mater toward the brain. There are no reactive changes in surrounding brain. Histologically proven convexity meningioma. (c, d) A 64-year-old female subject with a left frontobasal mass that is contiguous with the dura mater. The tumor is nearly isointense to white matter but is surrounded by extensive perifocal edema on axial T2w FLAIR image (c). Workup of this subject at 1.5 T reveals homogeneous enhancement on sagittal T1w SE image acquired after contrast medium administration (d). The MRI appearance is consistent with an olfactory groove meningioma. The diagnosis was confirmed by histologic examination
Meningiomas have nearly the same signal intensity as the brain on both T1-weighted and T2-weighted images (Grunwald et al. 2007) with approx. 20–25 % containing calcifications in the tumor matrix. Calcifications may be seen as hyperintensities on plain T1-weighted images but are best detected as signal voids on susceptibility-weighted images. Rapid growth may be associated with development of perifocal edema. Slowly growing meningiomas can become very large without any major effect on surrounding brain. Slight enlargement of CSF spaces around a meningioma is common and can serve as an indicator that a mass is extra-axial in location (Grunwald et al. 2007; Bonneville et al. 2007).
Clinical Management
Surgery is indicated if a meningioma invades the orbit or impinges on the optic nerve, if the subject is young, if extensive perifocal edema is present, or if the tumor causes neurologic symptoms. In unclear cases, a contrast-enhanced MRI study is helpful, showing strong uniform enhancement if a meningioma is present. Meningiomas with uniform calcification (susceptibility-weighted images) can be left alone as they are not likely to grow further. Noncalcified meningiomas should be followed up on a long-term basis using contrast-enhanced MRI. If a meningioma is close to the large venous channels, their patency should be established by TOF-MRA.
5.1.3.5 The CSF System
5.1.3.5.1 Pseudotumor Cerebri
The Monro-Kellie doctrine states that the cranial cavity is a closed rigid box (Brazis 2008) and that if any of the three CNS components (brain, CSF, blood) increases in volume, intracranial pressure (ICP) will increase as well, unless there is compensatory reduction in the volume of another component. Pseudotumor cerebri, or idiopathic intracranial hypertension, is characterized by increased ICP in the absence of an intracranial mass lesion and is most commonly seen in obese young women. The incidence is approx. 1/100,000 population/year, increasing to approx. 20/100,000/year in women between ages 20 and 40 whose body mass index (BMI) is more than 20 % above the ideal weight (Ball and Clarke 2006). Typical clinical symptoms are headache in 90–95 % of cases and visual impairment in approx. 65–70 % (Brazis 2008). Visual impairment commonly takes the form of optical sensations that can be elicited by a change in posture or Valsalva maneuver. Headache related to pseudotumor cerebri may be transient or permanent and of varying intensity and must be differentiated from tension headache and migraine. Another symptom is pulsatile tinnitus; if the latter is present, the differential diagnosis includes dural arteriovenous (AV) fistula (Table 5.11).
Table 5.11
Pseudotumor cerebri
Frequency | 1–20/100,000 population/year |
Age predilection | 20–40 years |
Sex predilection | F:M ratio of 8:1 |
Location | – |
Type of lesion | – |
Signs and symptoms | Headache, visual impairment, pulsatile tinnitus, nausea, vomiting, fatigue |
Differential diagnosis | Secondary ICP increase |
Dural AV fistula |
An increase in ICP causes widening of the external CSF spaces along both optic nerves (Rohr et al. 2008). Widened CSF spaces are well detected on coronal T2-weighted fat-saturated images or axial FLAIR images (Fig. 5.11b, c). Concomitant papilledema can be identified as protrusion of the optic disc and flattening of the posterior sclera on axial T2-weighted images. Finally, there will be enlargement of the suprasellar cistern with protrusion into the sella and compression of the pituitary gland, giving rise to the typical empty sella appearance on sagittal images (Fig. 5.11a).
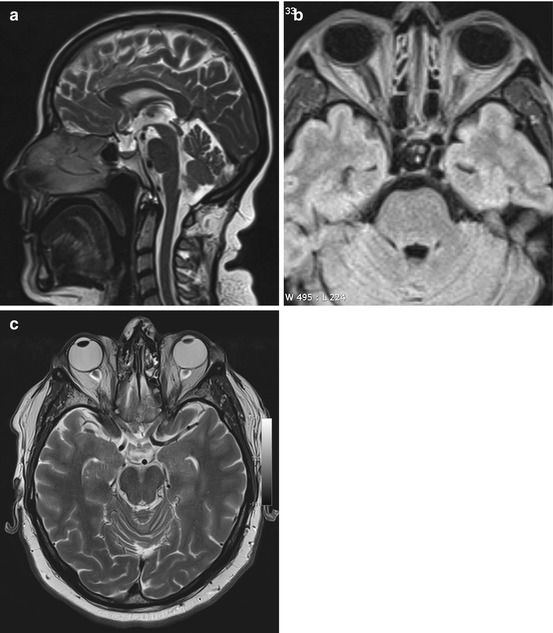
Fig. 5.11
Incidental screening finding and workup at 3 T in a 32-year-old female subject with a BMI of 32 kg/m2. MRI demonstrates an empty sella with only a thin strip of tissue left at the base of the sella on sagittal T2w TSE image (a). Axial T2w image shows dilated CSF spaces along both optic nerves (b). Workup, axial T2w TSE image (c), in this subject demonstrates bilateral optic disc protrusion with flattening of the posterior sclera as signs of papillary edema
Clinical Management
Pseudotumor cerebri is an often overlooked cause of headache, especially in young obese women. If this condition is suspected on the basis of MRI findings, a subject should undergo MR venography, which will typically reveal unilateral or bilateral stenosis of the transverse sinus. In addition, an examination by an ophthalmologist is indicated to confirm or rule out papilledema. Lumbar puncture demonstrating elevated CSF pressure is diagnostic, which is why all subjects with suspected pseudotumor cerebri should see a neurologist.
5.1.3.5.2 Normal Pressure Hydrocephalus
Hydrocephalus occurs when there is an imbalance between the production and resorption of CSF, which, according to the Monro-Kellie doctrine, results in widening of the cerebral ventricles. The most sensitive imaging sign is dilation of the temporal horns with the posterior horns, which are normally pointed, becoming rounded (Greitz 2004).
Normal pressure hydrocephalus (NPH) is a form of communicating hydrocephalus (Kitagaki et al. 1998) with a prevalence of approx. 0.4 % after age 65. NPH is characterized clinically by the classic triad of dementia, unsteady gate, and urinary incontinence, which may vary in severity (Table 5.12) (Bateman 2008).
Table 5.12
Normal pressure hydrocephalus
Frequency | 0.4 % prevalence in individuals aged 65 or older |
Age predilection | – |
Sex predilection | F:M ratio of 8:1 |
Location | – |
Type of lesion | – |
Signs and symptoms | Classic triad of dementia, unsteady gate, and urinary incontinence |
Differential diagnosis | Dementia of other etiology |
Hydrocephalus ex vacuo | |
Obstructive hydrocephalus |
MRI demonstrates the typical morphology of communicating hydrocephalus, which is characterized by symmetrical enlargement of the ventricles. The fourth ventricle may be spared and retain its narrow shape (Fig. 5.12a, b). A conspicuous finding is a discrepancy between the width of the internal and external CSF spaces, with the external spaces being narrow, especially in the high frontoparietal region (Fig. 5.12c). T2-weighted and FLAIR images will show cap-shaped areas of high signal intensities in the periventricular brain. Another typical finding in NPH is a conspicuous CSF flow void through the aqueduct on sagittal T2-weighted images (Fig. 5.12d) (Scollato et al. 2009).
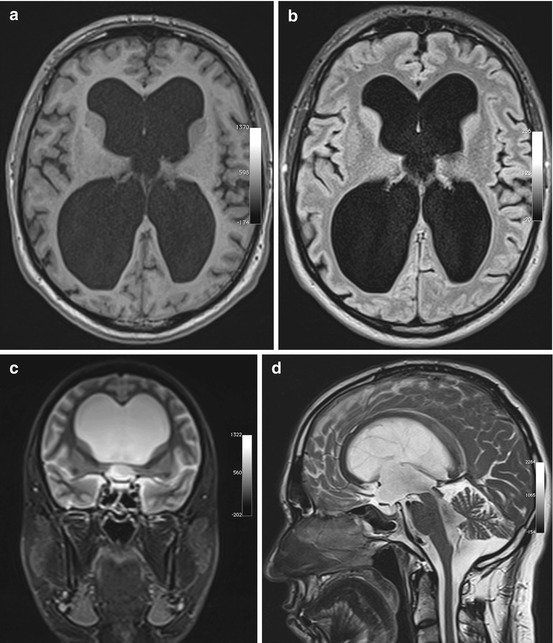
Fig. 5.12
Incidental screening findings in a 74-year-old male subject with a history of loss of cognitive function and small-stepped gait having persisted for some time. In conjunction with the clinical presentation, the morphologic changes seen on MRI give rise to the suspicion of NPH. Axial T1w MPR image reveals symmetrically dilated internal CSF spaces (a) without any significant periventricular signal changes on axial T2w FLAIR image (b). Coronal T2w TIRM image shows very narrow external CSF spaces supratentorially (c). Sagittal T2w TSE image shows strong flow signal over the aqueduct (d)
Clinical Management
When dilated ventricles have been identified, the foremost task of imaging is to rule out acute excessive accumulation of CSF and obstructive hydrocephalus secondary to a block of CSF outflow. Therefore, as a rule, demonstration of enlarged supratentorial ventricles should be followed up by a dedicated MRI examination with acquisition of high-resolution sagittal T2-weighted images (e.g., CISS) and phase-encoded flow measurement over the aqueduct to rule out outflow obstruction. A subject with suspected acute CSF obstruction should see a neurosurgeon immediately. The diagnosis of NPH cannot be made on the basis of MRI findings alone but must take the clinical context into account. NPH often responds well to treatment, which is why neurologic/neurosurgical workup is indicated.
5.1.4 Vascular Conditions
5.1.4.1 Cerebral Ischemia
In industrialized countries, cerebral ischemia is the most common cause of permanent disability in adults. The incidence of ischemic stroke is 150–300/100,000 population/year. Following a first stroke, there is an approx. 10–15 % risk of suffering a second stroke. Approx. 15 % of patients die within 3 months of an ischemic cerebrovascular event, either because of the initial or recurrent stroke or because of secondary complications (Coutts et al. 2008; Boulanger et al. 2007).
The traditional classification of ischemic strokes is based on the duration of symptoms, distinguishing transient ischemic attack (TIA), with symptoms resolving within 24 h and no morphologic changes at imaging; prolonged reversible ischemic neurologic deficit (PRIND); and complete stroke. This is a purely clinical classification with no relevance for radiologic image interpretation. Nevertheless, even clinicians support initiatives aiming at establishing a new terminology. With state-of-the-art imaging techniques, ischemic lesions can also be detected in 30 % of patients with TIA (Sylaja et al. 2008; Coutts et al. 2005).
An alternative classification scheme, based on underlying causes, distinguishes four major subtypes of ischemic strokes: large-artery atherosclerosis, small-vessel occlusion, stroke of other determined etiology, and stroke of undetermined etiology (approx. 30 % of cases). Rare causes include vasculitis and vessel injury or dissection (see Chap. 9), abuse of medications or drugs, and clotting disorders.
Large-artery disease is the underlying cause in territorial infarcts and borderzone infarcts. The latter are due to hemodynamically reduced perfusion of distal vascular territories in individuals with a proximal stenosis in a cerebral artery or the circle of Willis and poor or absent collateralization (see Chap. 9). The stenosis is typically due to atherosclerosis, while territorial infarcts are commonly caused by a thromboembolic event, which in 30 % of cases has a cardiac origin. Risk factors for large-artery atherosclerosis are arterial hypertension, diabetes mellitus, sex (men > women), oral contraceptive use, and migraine (Coutts et al. 2008; Sciolla and Melis 2008).
Small-vessel disease arises on the basis of lipohyalinosis and primarily affects small perforating cerebral arteries. The hallmark feature of lipohyalinosis is luminal narrowing, causing ischemic lacunar lesions in adjacent deep gray and white matter. Confluence of these lesions is known as subcortical atherosclerotic encephalopathy (SAE) and is typically associated with dementia (see Sect. 5.1.4.3.2 below).
Diffusion-weighted imaging (DWI) is the most sensitive technique for detecting ischemic lesions (Schaefer 2001; Schaefer et al. 2000


Related posts:

Stay updated, free articles. Join our Telegram channel
Full access? Get Clinical Tree
