The Pleura and Pleural Disease
W. Richard Webb
INTERLOBAR FISSURES
The interlobar fissures represent invaginations of the visceral pleura that separate or partially separate the lobes of the lung. Recognizing the fissures is essential in the localization and diagnosis of both pleural and parenchymal abnormalities.
The Major (Oblique) Fissure
On the left, the major fissure separates the lower lobe from the upper lobe. On the right, it separates the lower lobe from the upper and middle lobes (see Figs. 2-29 and 2-30 in Chapter 2).
The major fissures originate posteriorly, above the level of the aortic arch, near the level of the fifth thoracic vertebra, and angle anteriorly and inferiorly, nearly parallel to the sixth rib. Posteriorly, the superior aspect of the left major fissure is cephalad to the right in 75%. They terminate along the anterior diaphragmatic pleural surface of each hemithorax, several centimeters posterior to the anterior chest wall.
Portions of one or both major fissures are almost always visible on the lateral radiograph. A thin triangular opacity representing fat is seen in 20% of cases at the point the major fissure contacts the hemidiaphragm. A similar opacity may be seen in the presence of a small amount of pleural fluid.
The major fissures can be distinguished on the lateral radiograph in several ways:
The surface of the right hemidiaphragm is visible in its entirety in most patients, while the anterior surface of the left hemidiaphragm is usually obscured by the heart; if a fissure is visible in continuity with the anterior part of a complete diaphragm, it is the right major fissure.
The left hemidiaphragm may be identified by its intimate relationship to the stomach bubble; this may in turn allow identification of the left posterior costophrenic angle, the left posterior ribs, and then the left major fissure in continuity with the posterior ribs.
The right posterior ribs are usually projected posterior to the left on a well-positioned left lateral radiograph and appear larger than the left ribs because they are farther from the film and more magnified. This is termed the “big rib sign.” A fissure in contiguity with “big ribs” is the right major fissure.
The right major fissure may be identified if it is seen contacting the minor fissure.
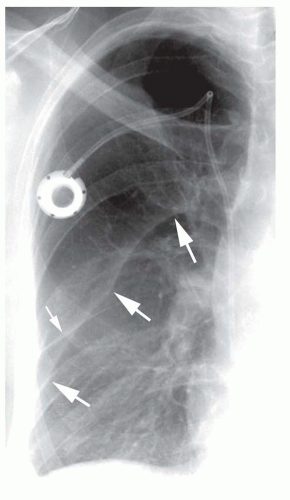
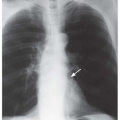
The major fissures are not clearly seen on frontal radiographs in normal subjects. In 5% to 10% of patients, however, a subtle arcuate opacity may be seen in the upper thorax, extending superiorly and medially from the lateral chest wall, representing contact of the superior part of the major fissure with the posterolateral thorax; this opacity is likely related to a small amount of fat or pleural fluid entering the edge of the fissure. Typically, it is sharply marginated on its undersurface and ill defined superiorly. A similar but more pronounced opacity may be seen with pleural effusion (Fig. 26-1) extending into the posterior part of the major fissure.
On CT, the major fissures are oriented obliquely to the scan plane, and because of volume averaging, their appearance is variable and depends on slice thickness.
With thick slices, the fissures themselves are visible in only 40% of cases, although the location of each fissure can usually be inferred because of the presence of an avascular band, several centimeters thick, within the lung parenchyma. These bands appear “avascular” because of the small size of vessels located in the peripheral lung on either side of the fissure. In some cases, the major fissures are visible on thick slices as ill-defined bands of opacity, due to volume averaging of the fissure with adjacent lung, or hypoinflation of the dependent portions of the upper lobes, adjacent to the fissure. Occasionally, the fissure is visible as a linear opacity with thick slices.
On CT obtained using thin slices or high-resolution technique, the major fissures usually appear as thin, well-defined lines surrounded by a plane of relatively avascular lung measuring about 1 cm thick. The orientation of the major fissures varies at different levels. In the upper thorax, the major fissures angle posterolaterally from the mediastinum (see Fig. 2-30A in Chapter 2). Within the lower thorax, the major fissures angle anterolaterally from the mediastinum. In nearly 20% of cases, a focal thickening of the fissure is seen on CT just above its point of contact with the diaphragm; this represents fat extending into the fissure.
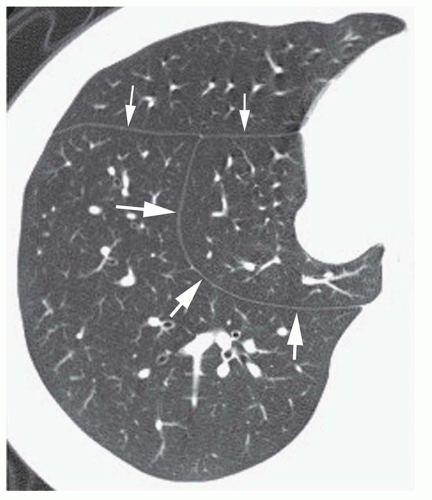
If a portion of the fissure is invisible on HRCT, it likely indicates that the fissure is incomplete with partial fusion of the lobes (Fig. 26-2). Incomplete fissures provide a pathway for collateral ventilation or spread of disease from one lobe to another. The right major fissure is incomplete in 70%, and some degree of fusion is present between the lower lobe and the upper lobe in 70% and between the lower lobe and middle lobe in 50%. On the left, the major fissure has been reported to be incomplete in 40% to 70% of patients.
In some cases, cardiac motion during the scan results in an artifact termed the double-fissure sign; when this artifact is present, the fissure is visible in two locations on the same scan separated by a few mm.
The Minor (Horizontal) Fissure
The minor or horizontal fissure separates the superior aspect of the right middle lobe from the right upper lobe. The minor
fissure is incomplete in more than 80% of cases, most often laterally (see Figs. 2-29 and 2-30 in Chapter 2).
fissure is incomplete in more than 80% of cases, most often laterally (see Figs. 2-29 and 2-30 in Chapter 2).
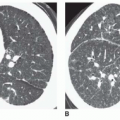
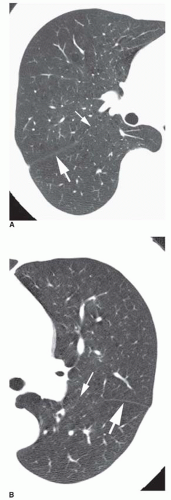 FIG. 26.2. Incomplete major fissures. A, B: HRCT shows normal-appearing major fissures laterally (large arrows). Medially, the fissures are incomplete and invisible on HRCT (small arrows). |
On a frontal radiograph, the minor fissure or a portion of the fissure is visible in 50% to 80% of cases, appearing as a roughly horizontal line, generally at or near the level of the anterior fourth rib. Its contour is variable, but its lateral part is often visible inferior to its medial part. Medially, the fissure usually appears to arise at the level of the right hilum and interlobar pulmonary artery.
On the lateral radiograph, the anterior part of the fissure often appears inferior to its posterior part. The posterior part of the fissure may be seen to end at the major fissure or may appear to extend posterior to it.
On CT obtained with thick slices, the minor fissure is rarely visible, as its position generally parallels the scan plane. Characteristically, however, the position of the minor fissure can be inferred because of a broad avascular region in the anterior portion of the right lung, anterior to the major fissure, at the level of the bronchus intermedius. This avascular region represents peripheral lung on each side of the fissure, lying in or near the plane of scan. The avascular region is often triangular, with the one corner of the triangle at the pulmonary hilum and the other two corners laterally. However, there is considerable variation in the appearance of the minor fissure due to variations in its orientation and curvature. In some cases, the avascular plane of the minor fissure appears rectangular, round, or elliptical.
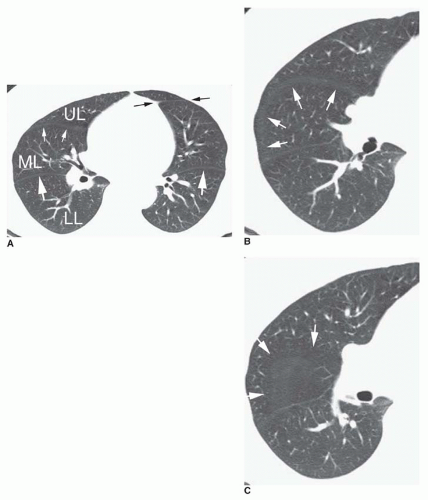
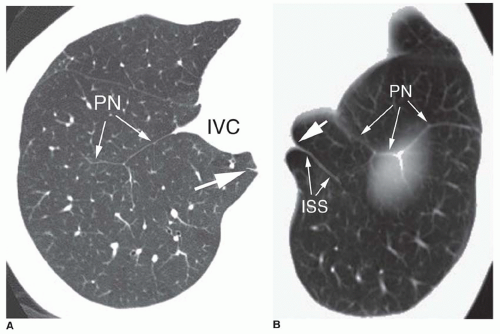
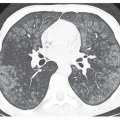
The appearance of the minor fissure on HRCT scans is quite variable (Fig. 26-3). Depending on its orientation and contour, the fissure may appear as (1) a linear opacity, directed from anterior to posterior; (2) a linear opacity
extending from medial to lateral, paralleling and anterior to the major fissure (see Fig. 26-3A); (3) a circle or ring (see Fig. 26-3B); or (4) an ill-defined opacity or avascular regions resulting from the fissure lying in the plane of scan (see Fig. 26-3C).
extending from medial to lateral, paralleling and anterior to the major fissure (see Fig. 26-3A); (3) a circle or ring (see Fig. 26-3B); or (4) an ill-defined opacity or avascular regions resulting from the fissure lying in the plane of scan (see Fig. 26-3C).
Because the minor fissure often angles caudally, from posterior to anterior, the lower lobe, middle lobe, and upper lobe can all be seen on a single HRCT scan (see Fig. 26-3A). If this is the case, the major and minor fissures can have a similar appearance, with the major fissure being posterior and the minor fissure anterior; in this situation, the lower lobe is most posterior, the upper lobe is most anterior, and the middle lobe is in the middle. If the minor fissure is concave caudally, it can appear ring shaped, with the middle lobe in the center of the ring (see Fig. 26-3B).
Accessory Fissures
Accessory fissures separate a lung segment or a part of a lobe from the remainder of a lobe; numerous accessory fissures have been identified. As many as 50% of lungs show an accessory fissure, but these are less often visible radiographically.
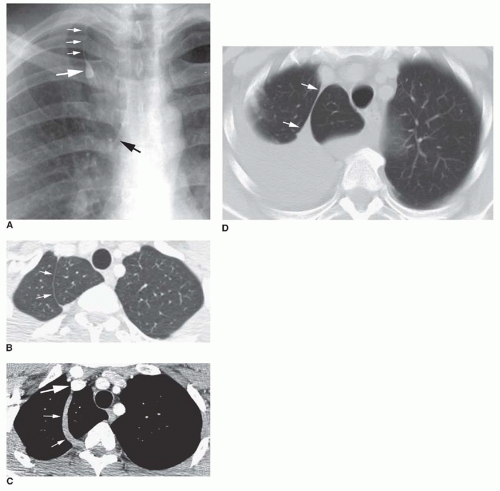
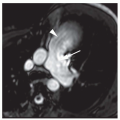
An azygos fissure is present in 1 in 200 subjects, defining the presence of an azygos lobe (Fig. 26-4). An azygos lobe represents parts of the apical or posterior segments of the right upper lobe. An azygos fissure and azygos lobe are formed when the azygos vein invaginates the right upper lobe during gestation. The azygos fissure consists of four layers of pleura (two parietal and two visceral) and contains the arch of the azygos vein. On the frontal radiograph, the azygos fissure has a characteristic curvilinear appearance adjacent to
the right mediastinum, convex laterally; the azygos vein has a teardrop appearance at the inferior extent of the fissure. The azygos fissure is identifiable on CT as a thin, curved line. It extends from the right brachiocephalic vein, anteriorly, to a position adjacent to the right posterolateral aspect of the T4 or T5 vertebral body (see Fig. 26-4B and C). A left “azygos” fissure, associated with the left superior intercostal vein, is rarely seen.
the right mediastinum, convex laterally; the azygos vein has a teardrop appearance at the inferior extent of the fissure. The azygos fissure is identifiable on CT as a thin, curved line. It extends from the right brachiocephalic vein, anteriorly, to a position adjacent to the right posterolateral aspect of the T4 or T5 vertebral body (see Fig. 26-4B and C). A left “azygos” fissure, associated with the left superior intercostal vein, is rarely seen.
The inferior accessory fissure separates the medial basal segment of either lower lobe from the remaining basal segments. It is present anatomically in 30% to 45% of lobes. On plain radiographs, this fissure is visible in 10%, extending superiorly and medially from the medial third of the hemidiaphragm. On CT, it is seen in 15% of cases, extending laterally and anteriorly from the region of the inferior pulmonary ligament to join the major fissure (Fig. 26-5).
The superior accessory fissure demarcates the superior segment from the remainder of the lower lobe; it is more common on the right. It is seen at about the same level as the minor fissure.
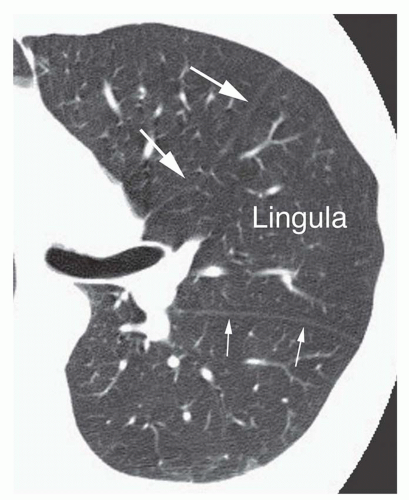
The left minor fissure is present anatomically in approximately 10% of normal lungs, separating the lingula from the remainder of the left upper lobe (Figs. 26-3A and 26-6). It is visible on plain radiographs in about 1%, appearing somewhat higher than the right minor fissure.
INFERIOR PULMONARY LIGAMENTS AND PHRENIC NERVES
The right and left inferior pulmonary ligaments each represent a double layer of pleura that serves to anchor the lung to the mediastinum. They are formed as reflections of the visceral pleura lining the medial surfaces of the lower lobes onto the mediastinal pleural surface. They extend inferiorly and posteriorly from just below the pulmonary hila to the diaphragm. The ligaments can terminate before reaching the diaphragm or extend over the medial diaphragmatic surface. They may divide the medial pleural space below the hila into anterior and posterior compartments. The ligaments may also contain systemic vessels supplying the lung.
The inferior pulmonary ligaments are invisible on chest radiographs. On CT, they are visible as very short, thin, linear or triangular opacities below the level of the right and left inferior pulmonary veins, and often adjacent to the esophagus (Fig. 26-7). Although they do not extend into the lung parenchyma, they often appear contiguous with a connective tissue septum in the medial lung, termed the intersublobar septum (see Fig. 26-7B). On CT, the inferior pulmonary ligaments are visible in 40% to 70% of cases.
Similar thin lines may be seen on CT, anterior to the inferior pulmonary ligaments, representing pleural reflections
over the right and left phrenic nerves (see Fig. 26-7). On the right, this opacity is usually seen lateral to the inferior vena cava (see Fig. 26-7A). The pleural reflections may be seen to extend over the surface of the diaphragm.
over the right and left phrenic nerves (see Fig. 26-7). On the right, this opacity is usually seen lateral to the inferior vena cava (see Fig. 26-7A). The pleural reflections may be seen to extend over the surface of the diaphragm.
THE PLEURAL SURFACES AND ADJACENT CHEST WALL
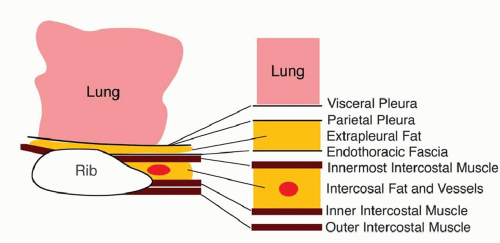
A number of tissues, arranged in layers, surround the lung and line the inner aspect of the thoracic cavity. Knowledge of their anatomy is helpful in understanding normal radiographic and CT findings and the appearances of pleural diseases (Figs. 26-8 and 26-9).
The combined thickness of the layers of visceral and parietal pleura that surround the lung, and the fluid-containing pleural space, is less than 0.5 mm.
External to the parietal pleura is a layer of loose areolar tissue (extrapleural fat), which separates the parietal pleura from the endothoracic fascia. This fatty layer is very thin in most locations but can be markedly thickened over the lateral or posterolateral ribs, resulting in extrapleural fat pads several millimeters thick.
The thoracic cavity is lined by the fibroelastic endothoracic fascia that covers the surface of the intercostal muscles and intervening ribs, blends with the perichondrium and periosteum of the costal cartilages and sternum anteriorly, and posteriorly is continuous with the prevertebral fascia that covers the vertebral bodies and intervertebral discs.
External to the endothoracic fascia are the three layers of the intercostal muscles. The innermost intercostal muscle passes between the internal surfaces of adjacent ribs and is relatively thin; it is separated from the inner and external intercostal muscles by a layer of fat and the intercostal vessels and nerve (Fig 26-9).
Although the innermost intercostal muscles are incomplete in the anterior and posterior thorax, other muscles (the transversus thoracis and subcostalis) can occupy the same relative plane. Anteriorly, the transversus thoracis muscle consists of four or five slips that arise from the xiphoid process or lower sternum and pass superolaterally from the second to sixth costal cartilages. The internal mammary vessels lie external to the transversus thoracis. Posteriorly, the subcostal muscles are thin, variable muscles that extend from the inner aspect of the angle of the lower ribs, crossing one or two ribs and intercostal spaces, to the inner aspect of a rib below.
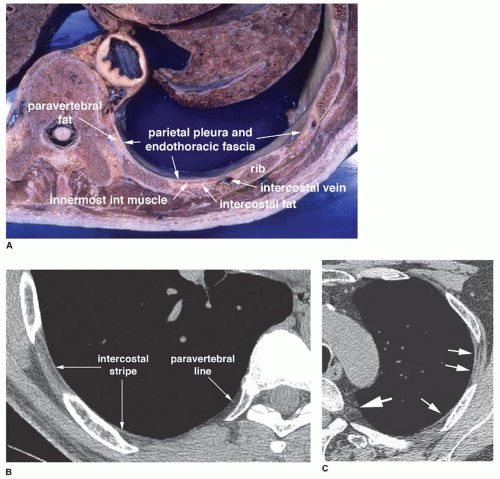
On CT, in many normal subjects, a 1- to 2-mm-thick soft tissue stripe is visible in the anterolateral and posterolateral intercostal spaces (the intercostal stripe) at the point of contact between the lung and the chest wall (Fig. 26-9). This line primarily represents the innermost intercostal muscle but also reflects the combined thicknesses of visceral and parietal pleura, the fluid-filled pleural space, the endothoracic fascia, and fat layers. Although the pleural layers, fluid-containing pleural space, extrapleural fat, and endothoracic fascia pass internal to the ribs, they are not normally visible in this location. A visible soft tissue stripe passing internal to the ribs or internal to the intercostal stripe (and separated from it by extrapleural fat) usually represents pleural thickening or pleural effusion.
In the paravertebral regions, the innermost intercostal muscle is anatomically absent. In this location, a very thin line (the paravertebral line) is sometimes visible on CT at the lung-chest wall interface; this line represents the combined thicknesses of the visceral and parietal pleura and the endothoracic fascia (Fig 26-9). A distinct soft tissue stripe in the paravertebral regions usually represents pleural thickening or pleural effusion.
DIAGNOSIS OF PLEURAL THICKENING
Parietal Pleural Thickening
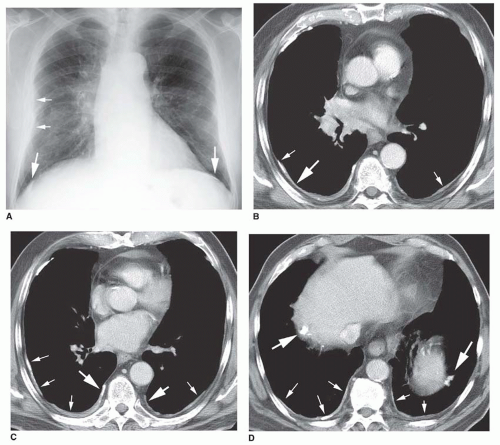
Most causes of “pleural thickening” visible on radiographs or CT primarily affect the parietal pleura. On CT, parietal pleural thickening results in five findings (Fig. 26-10 and Figs. 18-5 and 18-6 in Chapter 18):
A stripe of soft tissue density, 1 mm or more in thickness, internal to the ribs (see Fig. 26-10B and C)
A stripe of soft tissue density, 1 mm or more in thickness, internal to the innermost intercostal muscle and separated from it by a thin layer of extrapleural fat (see Fig. 26-10C)
A distinct stripe of soft-tissue density in the paravertebral region, 1 mm or more in thickness (see Fig. 26-10C)
Pleural calcification (see Fig. 26-10B-D)
Thickening of the normal extrapleural fat layer (see Fig. 26-10B)
Findings of parietal pleural thickening visible on chest radiographs (see Fig. 26-10) include the following:
Blunting of the lateral or posterior costophrenic angle (this may also result from pleural effusion)
A stripe of soft tissue density, several millimeters or more in thickness, separating the lung from the adjacent ribs and chest wall, either focal or diffuse (this may also result from pleural effusion)
Thickened soft tissue visible internal to the ribs in patients with pneumothorax
Pleural calcification
An asymmetrical increase in extrapleural fat appearing low in attenuation
Visceral Pleural Thickening
Recognizable visceral pleural thickening almost always occurs in association with parietal pleural thickening and pleural effusion; empyema is the most common cause. Visceral pleural thickening occurring in the absence of parietal pleural thickening is uncommon but may be seen in patients with lung disease, such as lung abscess or diffuse lung fibrosis.
Visceral pleural thickening cannot usually be distinguished from parietal pleural thickening on chest radiographs, although it may appear as any of the following:
Thickening of a fissure (this more often reflects pleural effusion)
Separation of the lung from the adjacent ribs and chest wall, which may be focal or diffuse, occurring in association with contiguous lung disease (this may also result from parietal pleural thickening or pleural effusion)
Thick pleura at the lung surface in patients with pneumothorax
On CT, visceral pleural thickening may appear as either of the following:
A distinct stripe of soft tissue at the lung surface in patients with pleural effusion and normal lung parenchyma
An enhancing stripe at the lung surface in patients with abnormal lung (thickened visceral pleura often enhances to a greater degree than airless lung)
NORMAL FINDINGS THAT MIMIC PLEURAL THICKENING
Several normal findings can mimic the findings of pleural thickening or effusion.
Normal Fat Pads
Normal extrapleural fat is most abundant over the posterolateral fourth to eighth ribs and can produce fat pads several millimeters thick that extend into the intercostal spaces.
On plain radiographs, the presence of a soft tissue stripe passing internal to the ribs, thus separating the lung from the chest wall, is generally taken to indicate the presence of a pleural thickening or effusion. However, in normal patients
with extrapleural fat thickening or fat pads, a similar appearance may be seen.
with extrapleural fat thickening or fat pads, a similar appearance may be seen.
Pleural disease and fat thickening can usually be distinguished; in contrast to pleural thickening or effusion, normal fat thickening is typically symmetrical and smooth in contour, appears low in attenuation, and is unassociated with costophrenic angle blunting.
Normal extrapleural fat can sometimes be seen on CT internal to the ribs. This appears very low in density and is easy to distinguish from thickened pleura.
The Subcostalis and Transversus Thoracis Muscles
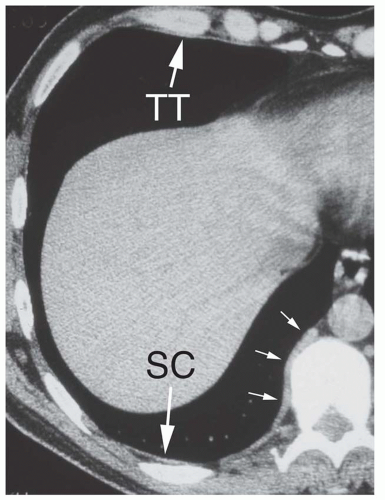
These are invisible on chest radiographs. On CT, a 1- to 2-mm-thick line is sometimes seen internal to one or more ribs, along the posterior chest wall at the level of the heart, representing the subcostalis muscle (Fig. 26-11). This may closely mimic the appearance of focal pleural thickening. The subcostalis muscle is visible in a small percentage of patients.
Anteriorly, at the level of the heart and adjacent to the lower sternum or xiphoid process, the transversus thoracis muscles are nearly always visible on CT internal to the anterior ends of ribs or costal cartilages (see Fig. 26-11).
In contrast to pleural thickening, these muscles are smooth, uniform in thickness, and symmetric bilaterally.
Paravertebral Intercostal Veins
These are invisible on chest radiographs. On CT, in some normal subjects, segments of intercostal veins seen in the paravertebral regions mimic pleural thickening. Continuity of these opacities with the azygos or hemiazygos veins is sometimes visible, allowing them to be correctly identified (see Fig. 26-11). Also, when viewed using lung window settings, these intercostal vein segments do not indent the lung surface; focal pleural thickening usually does.
DIAGNOSIS OF PLEURAL EFFUSION
Plain Radiographs
Pleural effusion cannot be distinguished from pleural thickening on chest radiographs unless high-density calcification or low-density fat is visible in relation to thick pleura, or air collections are visible within a pleural fluid collection.
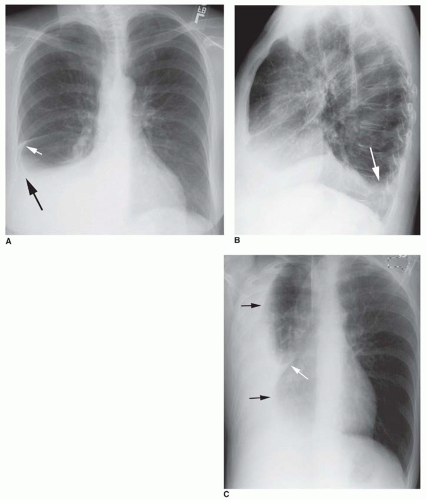
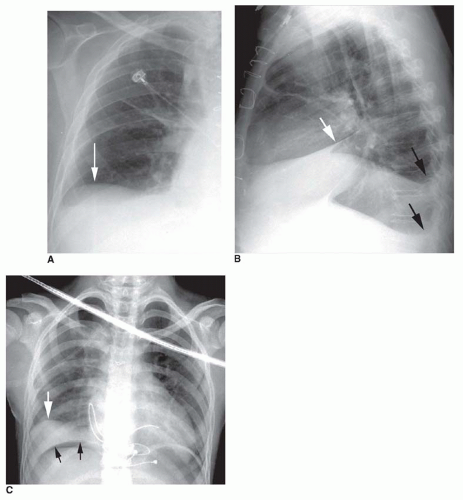
The pleural space extends inferiorly, below the visible lung, in relation to the diaphragm and ribs. In upright subjects, pleural fluid first accumulates in the most inferior portions of the pleural space, including the costophrenic angles and subpulmonic regions. Costophrenic angle blunting is usually the first recognizable plain film finding of pleural fluid (Fig. 26-12A and B).
At least 175 mL of pleural fluid must be present to result in blunting of the lateral costophrenic angle on the frontal radiograph, and as much as 500 mL may be present without recognizable blunting. Blunting of the posterior costophrenic angle on the lateral view requires 75 mL (see Fig. 26-12B). Blunting of the posterior costophrenic angle may sometimes be diagnosed on the frontal view by looking through the shadow of the upper abdominal contents; posterior costophrenic angle blunting results in a sharper lower edge of the lung than normally seen. On a properly performed lateral decubitus film, as little as 10 mL of fluid may be seen. Very small pleural fluid collections, either unilateral or bilateral, are seen in a few normal individuals.
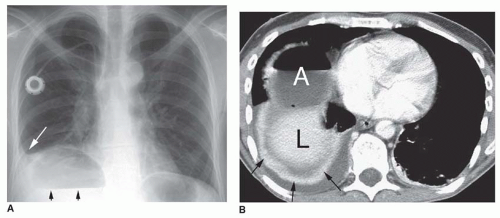
With increasing effusion, fluid may be seen lateral to the lower lobes, separating the lung from adjacent ribs. Because the lung is fixed medially by the hilum and inferior pulmonary ligament, medial pleural fluid collections are usually smaller (Fig. 26-13) and more difficult to recognize. Larger effusions result in a typical meniscus appearance with the level of the fluid and its density appearing greater in the lateral hemithorax. The edge separating the aerated lung from pleural fluid is often sharp and well defined.
Medial fluid collections may be seen when effusions are large. Most often, these accumulate in the posterior gutters, with thickening of the paravertebral stripes. The collections may be triangular, simulating lower lobe collapse.
Pleural fluid often accumulates in the subpulmonic pleural space (subpulmonic effusion), allowing the lung base to float superiorly. Subpulmonic fluid collections may be difficult to recognize on frontal radiographs, although some costophrenic angle blunting, a shallow costophrenic angle, or a hazy costophrenic angle is often present. However,
greater superior retraction of the lateral lung (likely because the medial lower lobe is fixed by the inferior pulmonary ligament) results in lateral displacement of what appears to the diaphragmatic dome or peak, with the lung lateral to the peak angling down sharply (Fig. 26-14). On the left side, 2 cm of separation of the lung base from the top of the stomach bubble is typically taken as evidence of a subpulmonic effusion, but this distance is variable in normal individuals.
greater superior retraction of the lateral lung (likely because the medial lower lobe is fixed by the inferior pulmonary ligament) results in lateral displacement of what appears to the diaphragmatic dome or peak, with the lung lateral to the peak angling down sharply (Fig. 26-14). On the left side, 2 cm of separation of the lung base from the top of the stomach bubble is typically taken as evidence of a subpulmonic effusion, but this distance is variable in normal individuals.
On the lateral view (see Fig. 26-14B), a subpulmonic effusion often (1) elevates the posterior lung, flattening its undersurface; (2) insinuates itself into the major fissure, resulting in focal triangular thickening of the fissure; and (3) flattens the inferior contour of the lung anterior to the fissure, which then angles sharply downward.
Fluid may extend into the major or minor fissures. This is usually easy to recognize on the lateral radiographs as fissure thickening. On the frontal radiograph, fluid extending into the posterolateral major fissure typically results in an arcuate opacity, sharply defined medially and inferiorly (see Fig. 26-1). Fluid extending into the lateral aspect of the minor fissure and slightly separating the lobes often results in an opacity resembling a rose thorn (the “thorn sign”; see Figs. 26-12A, 26-13A, and 26-14B).
Large pleural effusions result in significant or complete lung atelectasis (see Fig. 26-13) and result in a mediastinal shift to the opposite side. Downward displacement or inversion of the hemidiaphragm may be recognized on the left because of downward displacement of the stomach bubble.
Supine and semierect radiographs are less sensitive in showing pleural effusion. Signs of effusion on supine radiographs include increased density of a hemithorax due to layering of the effusion posteriorly, blunting of the lateral costophrenic angle, obscuration or poor definition of the hemidiaphragm, and thickening of the paravertebral stripe, usually in the inferior hemithorax, due to accumulation of fluid in the posterior gutters. With large effusions, an apical cap may be seen.
On decubitus radiographs, an increase in separation of the lung from the chest wall indicates the presence of free pleural effusion (see Fig. 26-12C). Lack in change in thickness indicates pleural thickening or loculated pleural effusion.
CT Findings
Pleural effusion usually appears lower in attenuation than pleural thickening or consolidated or collapsed lung on unenhanced scans, and may be distinguished from them. On contrast-enhanced scans, both airless lung and thickened pleura enhance, and this difference is accentuated (see Fig. 26-13B). Small pleural effusions can be difficult to distinguish from pleural thickening.
In the supine position, free pleural effusion first accumulates in the most dependent part of the pleural space, posterior to the lower lobe. The thickness of a free pleural effusion usually decreases in less dependent parts of the thorax, anteriorly and superiorly. As the effusion increases in size, it becomes thicker and wraps around the lung, extending anteriorly and superiorly, and extending into the fissures.
When free pleural fluid accumulates, the lung decreases in volume but tends to maintain its normal shape. Thus, a free pleural effusion generally appears crescent-shaped on CT. Large effusions often extend into the major fissures, displacing the lower lobes medially and posteriorly. Atelectasis is common in patients with large effusions, and atelectatic lung may be seen floating within the fluid.
Pleural Effusion Versus Ascites
Subpulmonic effusion and pleural fluid in the costophrenic angles can be seen below the lung bases on CT and may mimic collections of fluid in the peritoneal cavity. The parallel curvilinear configuration of the pleural and peritoneal cavities at the level of the perihepatic and perisplenic recesses allows fluid in either cavity to appear as a crescentic collection displacing liver or spleen away from the adjacent chest wall.
However, pleural fluid collections and ascites may be distinguished in several ways.
Pleural fluid collections in the posterior costophrenic angle lie medial and posterior to the diaphragm and cause lateral displacement of the crus (the “displaced-crus sign”). Peritoneal fluid collections are anterior and lateral to the diaphragm; lateral displacement of the crus is not visible.
Pleural fluid can also be distinguished from ascites by the clarity of the interface of the fluid with the liver and spleen (the “interface sign”). With pleural fluid the interface is hazy, whereas with ascites it is sharp.
Fluid seen posterior to the liver is within the pleural space; the peritoneal space does not extend into this region, the so-called bare area of the liver (the “bare-area sign”).
The most reliable method for localizing fluid is to identify its relationship to the diaphragm, if it is visible. In patients with both pleural and peritoneal fluid, the diaphragm often can be seen as a uniform, curvilinear structure of muscle density with relatively low-density fluid both anterior and posterior to it. Fluid posterior or lateral to the diaphragm is pleural (the “diaphragm sign”).
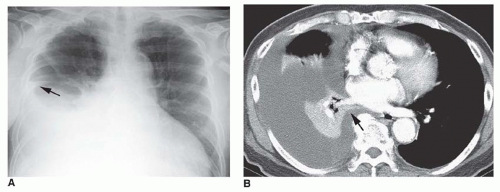
A large pleural effusion will allow the lower lobe to float anteriorly and lose volume (Fig. 26-15). On CT, the posterior edge of the lower lobe, when surrounded by fluid both anteriorly and posteriorly, can appear to represent the diaphragm (i.e., a “pseudodiaphragm”), with pleural fluid posteriorly and ascites anteriorly. Sequential scans at more cephalad levels, however, generally will allow the correct interpretation to be made. Typically, the arcuate density of the atelectatic lower lobe becomes thicker superiorly, is contiguous with the remainder of the lower lobe, and often contains air bronchograms.
LOCULATED FLUID COLLECTIONS
Loculated pleural fluid collections are limited in extent by pleural adhesions. They often occur in association with exudative pleural effusions, high in protein, such as those that occur with empyema. Often they are elliptical or lenticular in shape.
Radiographic Findings
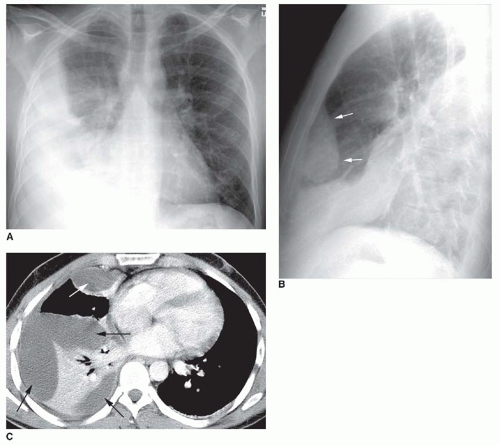
The appearance of loculated pleural fluid on chest radiographs varies with its location and the radiographic projection. Typically, a loculated collection appears sharply marginated when its surface is parallel to the x-ray beam and ill defined when viewed en face (Fig. 26-16A and B). Thus, a collection loculated in the lateral pleural space will appear sharply marginated on the frontal radiograph and ill defined on the lateral film. For a collection loculated anteriorly or posteriorly, the opposite is true.
Localized fluid collections in the fissures may be loculated or may occur in the absence of pleural adhesions. They are most common in patients with congestive heart failure and often are transient. Since they mimic the presence of a focal lung lesion, they have been referred to as “phantom tumor” or “pseudotumor.” Typically, fluid collections in a fissure are rounded or lenticular and may show a tapering triangular opacity or “beak” at the point they merge with the fissure itself (Figs. 26-17 and 26-18).
Fluid collections in the minor fissure often appear sharply marginated and lenticular on both posteroanterior and lateral radiographs. Collections in the major fissure may be ill defined on the frontal view.
CT Findings
CT findings of fluid loculation include (1) a localized collection, (2) an elliptical or lenticular shape (rather than crescentic), and (3) a nondependent location (i.e., anterior, lateral, or posterolateral; Figs. 26-16C and 26-18,26-19 and 26-20). If air is present within a loculated effusion, multiple septations may be seen, resulting in multiple air bubbles, localized air collections, or air-fluid levels (Fig. 26-21). Loculated effusions are often associated with pleural thickening, best seen with contrast enhancement (see Figs. 26-16C and 26-19). If both the visceral and parietal pleural surfaces are thickened, embracing the fluid collection, the split-pleura sign is said to be present (see Fig. 26-19).
Stay updated, free articles. Join our Telegram channel

Full access? Get Clinical Tree


