(1)
Department of Radiology, John H Stroger Jr Hospital of Cook County, Chicago, IL, USA
Splenic Lesions
Extramedullary Hematopoiesis
Diagnosis
Thalassemia with Extramedullary Hematopoiesis
Imaging Features
1.
Intramedullary widening of bones with coarse trabeculation
2.
Extramedullary hematopoiesis
3.
Hepatosplenomegaly

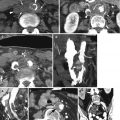
Fig. 17.1
Thalassemia with extramedullary hematopoiesis. CT axial image (a) shows extramedullary hematopoiesis as paraspinal soft tissues (white arrows) and undertubulation of the posterior ribs with coarse trabeculation of the ribs (arrowheads). (b) Axial CT shows a large extramedullary hematopoiesis as a nonenhancing mass in the spleen (arrows) compressing the normal splenic parenchyma. (c, d) Sagittal and coronal reformatted images show increased trabeculation of the lumbar vertebrae and iliac bones (arrows). The liver and spleen are enlarged
Diagnosis
Myelofibrosis with Extramedullary Hematopoiesis


Fig. 17.2
Splenic extramedullary hematopoiesis in myelofibrosis. CT axial (a), sagittal (b), and coronal (c) reformatted images show extramedullary hematopoiesis as a large well-marginated low-density heterogeneous mass in the upper pole of the spleen having mass effect
Lymphoma

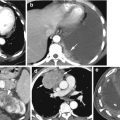
Fig. 17.3
Lymphoma of the spleen. History of diffuse B-cell lymphoma. CT axial (a, b) and coronal (c) reformatted images show multifocal low-density nodular involvement of the spleen with enlarged lymph nodes in the retrocrural region, mesenteric region, and portacaval region (arrows)
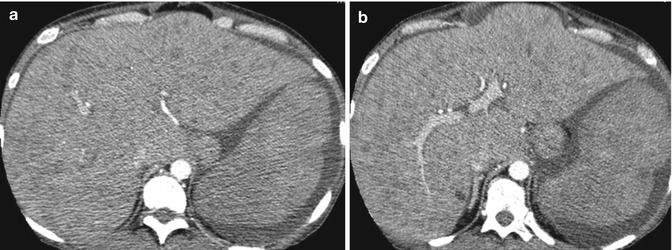
Fig. 17.4
Hepatosplenomegaly from non-Hodgkin’s lymphoma. Axial CT (a, b) shows hepatosplenomegaly with diffuse low-density nodular involvement of the liver and spleen
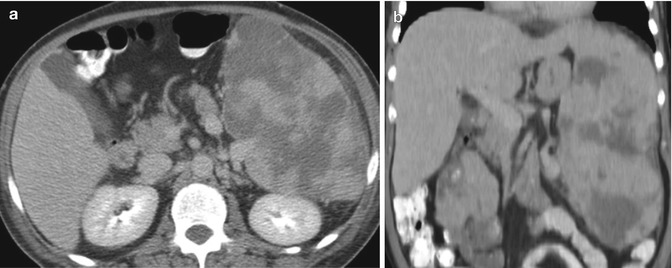
Fig. 17.5
Lymphoma of the spleen. History of T-cell lymphoma. Axial CT (a, b) shows enlarged spleen with multiple irregular confluent low-density lesions
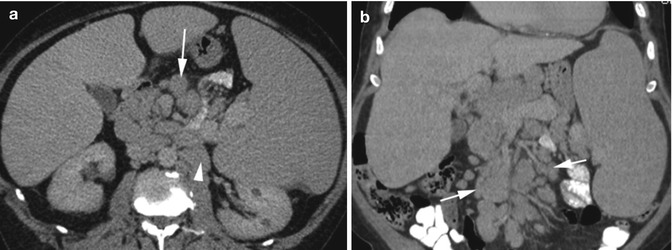
Fig. 17.6
Hepatosplenomegaly from chronic lymphoid leukemia. Axial CT (a) and coronal reformatted (b) images show diffusely enlarged liver and spleen, focal low-density lesions of the left kidney, and lymphadenopathy in the small bowel mesentery (arrow) and para-aortic region (arrowhead)
Coccidioidomycosis

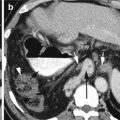
Fig. 17.7
Coccidioidomycosis of the spleen and vertebra. Axial CT (a) shows multiple small low-density lesions in the spleen. (b) Bone windowing shows destructive changes of the T12 vertebral body (arrowheads) with increased paravertebral soft tissue (arrow) which was biopsy proven as coccidioidomycosis infection
Sarcoid

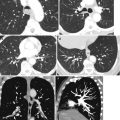
Fig. 17.8
Sarcoidosis. Axial CT (a) shows a large spleen with diffuse low-density lesions. (b) Axial CT a few years later after splenectomy, developed renal sarcoidosis with multiple low-density nodules. (c) Axial CT of the chest shows multiple centrilobular nodules in lymphatic distribution
Infarction
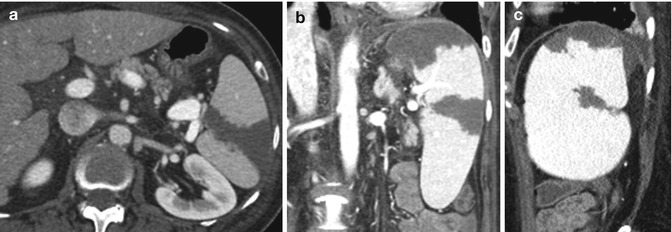
Fig. 17.9
Splenic infarction in a patient with atrial fibrillation and hypotension. CT axial (a), coronal (b), and sagittal (c) reformatted images show well-defined low-attenuating infarctions in the upper pole and midpoles

Fig. 17.10
Splenic calcification and extramedullary hematopoiesis in a sickle cell anemia patient. Noncontrast axial CT (a–c) shows hemochromatosis of the liver with increased attenuation. Multiple high-density lymph nodes are seen in the abdomen, paraspinal region of the lower thorax (arrows), and left hilum (arrowhead) from hemochromatosis (hemosiderosis). Low-density areas in a calcified spleen are from extramedullary hematopoiesis (long arrow)
Adrenal Lesions
Pheochromocytoma
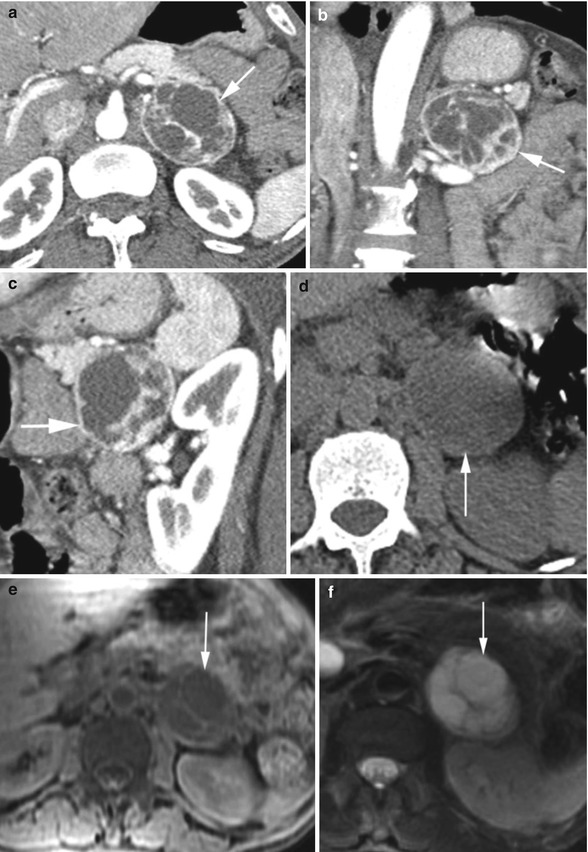
Fig. 17.11
Pheochromocytoma with neurofibromatosis type 1. CT postcontrast axial (a), coronal (b), and sagittal (c) reformatted images and unenhanced axial image (d) show a large left adrenal enhancing mass with low-density cystic areas (arrow). Axial MRI in T1W (e) and T2W fat-sat (f) images again shows a large adrenal mass (arrow) with cystic areas with low signal in T1W image and high signal in T2W images

Fig. 17.12
Pheochromocytoma of the right adrenal gland. CT axial (a), coronal (b), and sagittal (c) reformatted images show a large adrenal mass (arrows) causing extrinsic compression on the liver. The tumor shows poor enhancement with multiple cystic areas
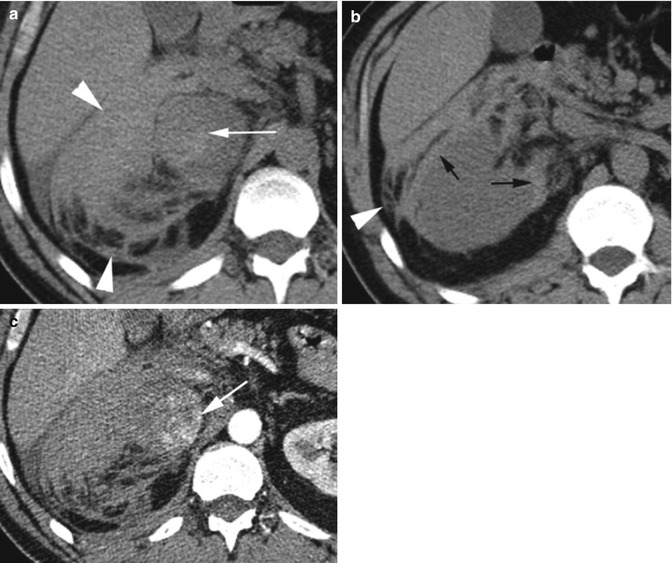
Fig. 17.13
Pheochromocytoma with spontaneous hemorrhage. Axial unenhanced CT (a, b) shows a large right adrenal gland mass with high-density hemorrhage from the mass (white arrow) extending into the perirenal space (arrowheads) and causing subcapsular hemorrhage in the right kidney (black arrows). Postcontrast image (c) shows enhancement of the nonhemorrhagic portion of the tumor (arrow)
Retroperitoneal Paraganglioma
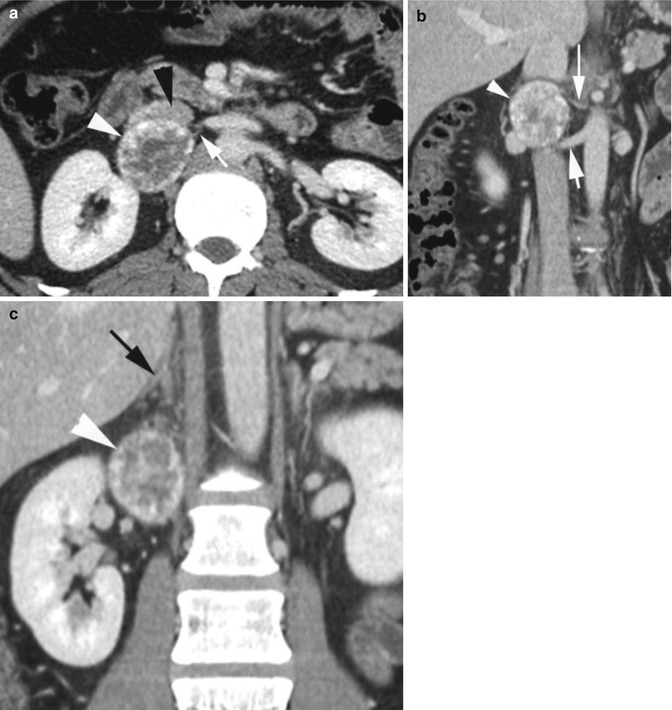
Fig. 17.14
Retroperitoneal paraganglioma. Incidental finding for appendicitis CT. CECT (a) shows a solid mass mostly with peripheral enhancement and central low density (white arrowhead) behind the IVC (black arrowhead) with a small renal artery (white arrow) supplying the mass (surgically proven). Coronal reformatted image (b) shows the mass (arrowhead also in c) supplied by the small renal artery (long arrow) with the large main renal artery coursing inferior to the mass (thick arrow). (c) Shows the adrenal gland (black arrow) to be separate (black arrow)
Adrenocortical Carcinoma
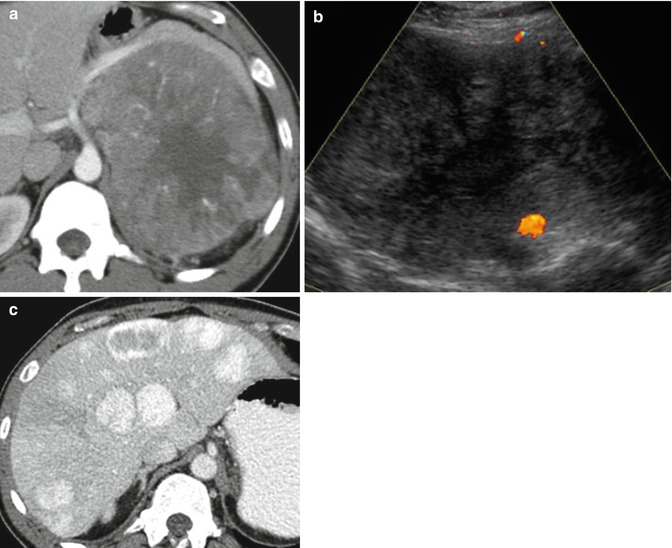
Fig. 17.15
Adrenocortical carcinoma. Axial CT (a) shows a large solid mass with linear vasculature within the solid portion and with central necrosis. (b) Ultrasound shows heteroechoic mass with central low echogenicity. (c) Later CT done after adrenalectomy shows enhancing hepatic metastasis
Adrenal Cyst
Diagnosis
Adrenal Pseudocyst
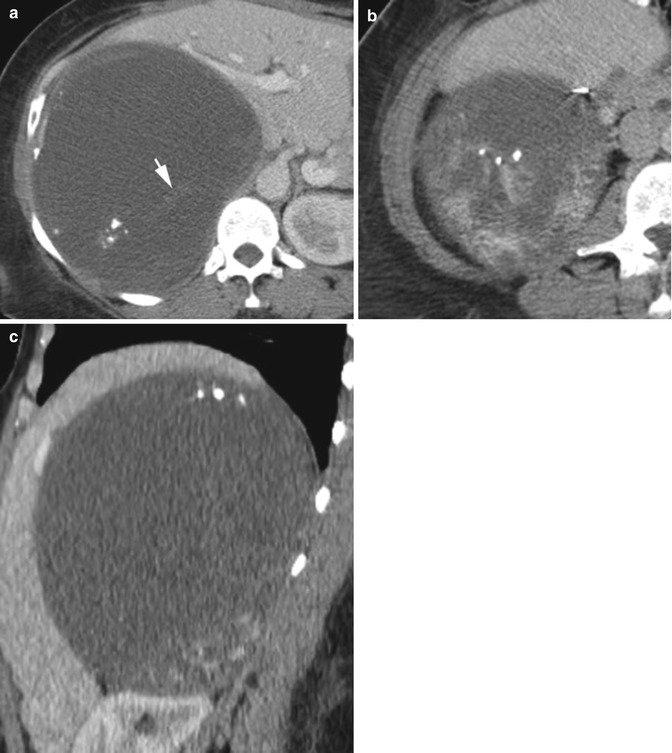

Fig. 17.16
Adrenal pseudocyst. Axial CT (a, b) and sagittal reformatted images (c) show a large right adrenal cyst with septation (arrow) and coarse calcification and enhancing soft tissues inferiorly
Diagnosis
Complex Adrenal Cyst with Adenoma
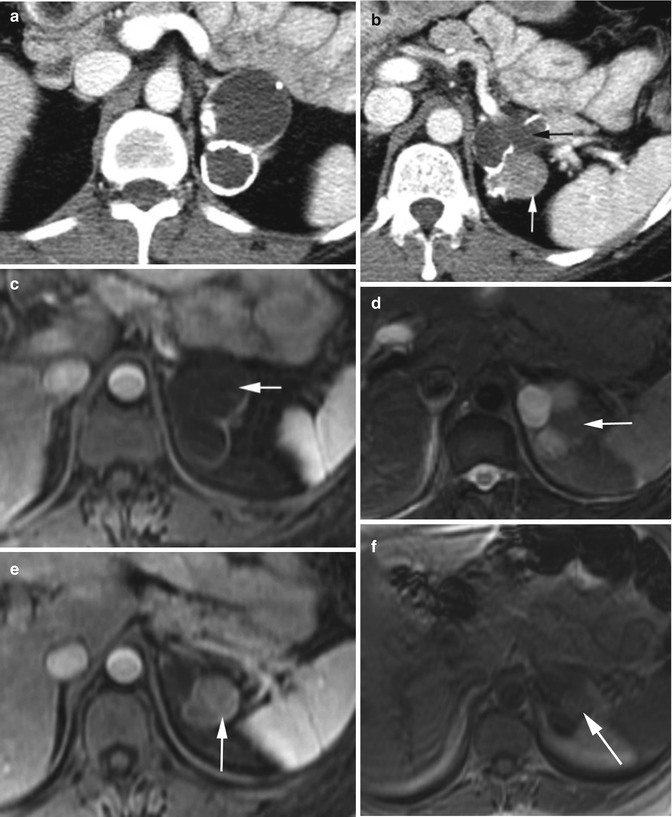
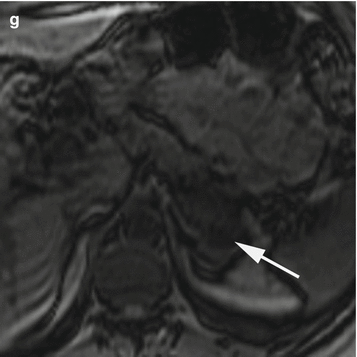


Fig. 17.17
Left adrenal complex cyst with calcification and adenoma. Axial CT (a, b) shows lobulated cyst of the left adrenal gland with rim calcification (black arrow). Soft tissue enhancing nodule had features of adenoma (white arrow). Axial MRI (c) T1W shows no signal in the cysts (arrow) and high signal in T2W image with low signal in the adenoma (arrow) (d). Postcontrast study (e) shows enhancement of the adenoma (arrow) and no enhancement of the cyst. (f, g) In- and out-phase images show signal drop-off in the opposed phase (arrow)
Diagnosis
Adrenal Simple Cyst
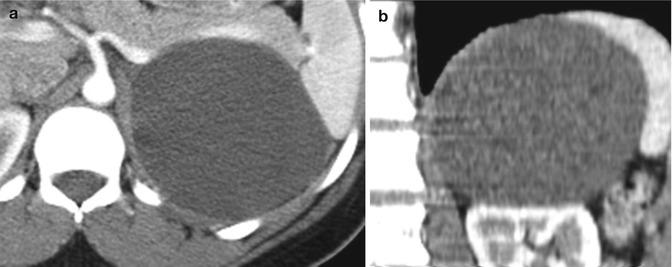

Fig. 17.18
Simple cyst of the adrenal gland. CT axial (a) and coronal (b) reformatted images show a simple cyst in the left adrenal gland as an incidental finding
Metastasis
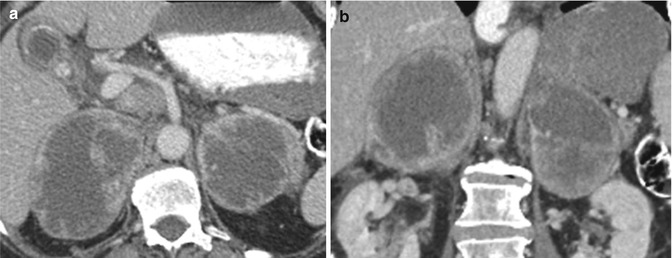
Fig. 17.19
Adrenal metastasis from Merkel cell cancer. Axial (a) and coronal (b) reformatted CT images show a large necrotic mass in each adrenal gland with peripheral enhancement
Myelolipoma
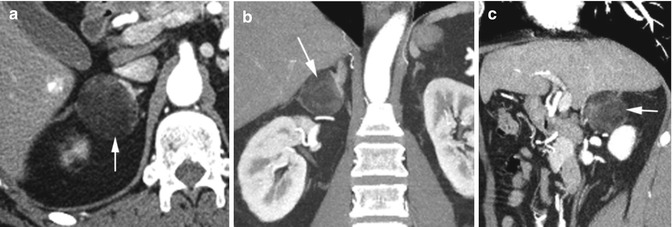
Fig. 17.20
Myelolipoma of the right adrenal gland. CT axial (a), coronal (b), and sagittal (c) reformatted images show a well-defined mass in the right adrenal gland (arrow), predominantly fatty tissue
Adrenal Hemorrhage
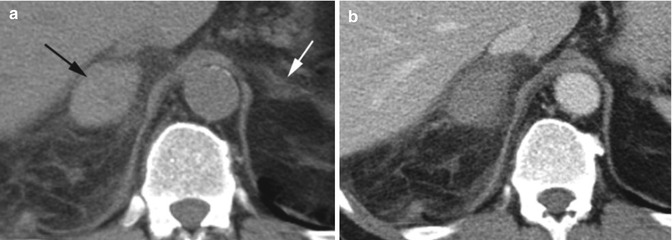
Fig. 17.21
Adrenal hemorrhage with insufficiency. Axial non-enhanced CT (a) shows a well-defined right adrenal mass (black arrow) with high density from hemorrhage and edema of surrounding perinephric space and normal left adrenal gland (white arrow). (b) Postcontrast study shows no enhancement of any part of the adrenal hemorrhage
Bibliography
1.
Akbar SA, Jafri SZH, Amendola M, et al. Renal infections: an update. Appl Radiol. 2009;25–38.
2.
Alsaif HS, Venkatesh SK, Chan DSG, et al. CT appearance of pyogenic liver abscesses caused by klebsiella pneumonia. Radiology. 2011;260(1):129–38.PubMed
3.
Anderson SW, Kruskal JB, Kane RA. Benign hepatic tumors and iatrogenic pseudotumors. Radiographics. 2009;29:211–29.PubMed
4.
Antila KM, Makisalo H, Arola J, et al. Biliary papillomatosis. Radiographics. 2008;28:2059–63.PubMed
5.
Avery LL, Scheinfeld MH. Imaging of penile and scrotal emergencies. Radiographics. 2013;33:721–40.PubMed
6.
Balthazar EJ, Yen BC, Gordon RB. Ischemic colitis: CT evaluation of 54 cases. Radiology. 1999;211:381–8.PubMed
7.
Ba-Ssalamah A, Prokop M, Uffmann M, et al. Dedicated multidetector CT of the stomach? Spectrum of diseases. Radiographics. 2003;23:625–44.PubMed
8.
Bechtold RE, Dyer RB, Zagoria RJ, et al. The perirenal space: relationship of the pathologic processes to normal retroperitoneal anatomy. Radiographics. 1996;16:841–54.PubMed
9.
Boscak AR, Al-Hawary M, Ramsburgh SR. Adenomyomatosis of the gallbladder. Radiographics. 2006;26:941–6.PubMed
10.
Boudiaf M, Sayer P, Terem C, et al. CT evaluation of small bowel obstruction. Radiographics. 2001;21:613–24.PubMed
11.
Brody MJ, Leighton DB, Murphy BL, et al. CT of blunt bowel and mesenteric injury: typical findings and pitfalls in diagnosis. Radiographics. 2000;20:1525–36.PubMed
12.
Brofiman N, Atri M, Epid D, et al. Evaluation of bowel and mesenteric blunt trauma with multidetector CT. Radiographics. 2006;26:1119–31.
13.
Browne RFJ, Meehan CP, Colville J, et al. Transitional cell carcinoma of the upper urinary tract: spectrum of imaging findings. Radiographics. 2005;25:1609–27.PubMed
14.
Buckley JA, Fishman EK. CT evaluation of small bowel neoplasms: spectrum of disease. Radiographics. 1998;18:379–92.PubMed
15.
Catalano OA, Sahani DV, Forcione DG, et al. Biliary infections: spectrum of imaging findings and management. Radiographics. 2009;29:2059–80.PubMed
Stay updated, free articles. Join our Telegram channel

Full access? Get Clinical Tree


