Cancer therapy is mainly based on different combinations of surgery, radiotherapy, and chemotherapy. Additionally, targeted therapies (designed to disrupt specific tumor hallmarks, such as angiogenesis, metabolism, proliferation, invasiveness, and immune evasion), hormonotherapy, immunotherapy, and interventional techniques have emerged as alternative oncologic treatments. Conventional imaging techniques and current response criteria do not always provide the necessary information regarding therapy success particularly to targeted therapies. In this setting, MR imaging offers an attractive combination of anatomic, physiologic, and molecular information, which may surpass these limitations, and is being increasingly used for therapy response assessment.
Key points
- •
MR imaging offers an attractive combination of anatomic, physiologic, and molecular information of tumor phenotype.
- •
MR imaging findings of tumor response depend on tumor type, on anatomic locations, on the mechanism of action of therapy given, and on the imaging techniques.
- •
Multiparametric MR imaging has demonstrated to be a useful tool for tumor response evaluation in multiple tumor types.
Introduction
Historically, cancer therapy has been based on different combinations of surgery, radiotherapy (RTP), and chemotherapy (CTP). These therapies have proven value but have also shown obvious limitations (eg, RTP and CTP do not kill cancer cells specifically) with treatment-related side effects commonly encountered. Recently, there has been a continuous effort in order to develop oncologic therapies (OTs) designed to target and disrupt specific tumor hallmarks (angiogenesis, metabolism, proliferation, and invasiveness) and genetic-related tumor changes (eg, epidermal growth factor receptor [EGFR] or anaplastic lymphoma kinase [ALK] mutations). Many advances in our understanding of key biological processes that are altered in tumors have been translated into the development of these OTs, including antiangiogenic/antivascular drugs, drugs interfering with tumor growth signaling (EGFR, ALK, tysosine-protein kinase Kit [c-KIT], and pathways mediating their downstream effects), hormonal therapy (HT), immunotherapy (IT), and interventional techniques (eg, embolization or ablation). In this scenario, the effectiveness of these approaches needs to be evaluated, in particular the onset, duration, and heterogeneity of benefits requires assessment.
Intrinsically magnetic resonance (MR) offers a combination of anatomic, physiologic, and molecular information, which makes MR an ideal tool for evaluating different aspects of the cancer phenotype in vivo. Many functional and molecular imaging (FMI) techniques that are available on MR imaging systems include dynamic contrast-enhanced MR imaging (DCE-MR imaging), dynamic susceptibility contrast-enhanced MR imaging (DSC-MR imaging), diffusion-weighted MR imaging (DW-MR imaging), and Magnetic resonance spectroscopy and spectroscopic imaging (MRS/I). These noninvasive FMI techniques can demonstrate the spatial and temporal distribution of important tumor characteristics. They also provide quantitative biomarkers for the objective assessment of physiologic and molecular processes and, thus, enable assessment of changes in response to therapy. Understanding the relationship between tumor hallmarks, therapy effects, and MR imaging findings is essential for an adequate evaluation of OTs. In this article, the authors describe the role of functional MR imaging in oncology for therapy monitoring.
MR imaging techniques for the evaluation of tumor phenotype
When considering therapy effects on tumors, imaging observations are sometimes difficult to interpret. Imaging findings seem to depend on anatomic locations, on interactions between specific tissue characteristics and the mechanism of action of therapy given, and on the imaging techniques making the observations. Different FM–MR imaging techniques are available in modern scanners ( Table 1 ). MR-based FMI techniques are increasingly being used to monitor the tumor response to therapies in daily clinical practice. MR imaging is able to predict the success of therapy before size changes become evident, and FM–MR imaging methods are increasingly being used as biomarkers of response in early phase drug development.
| MR Imaging Technique | Biological Bases of Imaging Technique | Evaluation Parameters Obtained | Pathophysiologic Correlation | Advantages | Disadvantages |
|---|---|---|---|---|---|
| DCE-MR imaging | Contrast medium uptake rates Transfer rates Extracellular volume Plasma volume fraction |
| Vessel density Vascular permeability Perfusion Extravascular space Plasma volume | Low toxicity of contrast agents No ionizing radiation Versatility in pulse sequences | Complex biological explanation of many parameters Complex analysis in quantitative models |
| DSC-MR imaging |
|
| Vessel density Perfusion Vessel size | Availability Low cost | Semiquantitative models Technical complexity in extracranial lesions |
| Imaging techniques based on water diffusion | Diffusivity of water – monoexponential analysis (DWI) Perfusion component: IVIM Structural complexity: Diffusion Kurtosis Imaging (DKI) |
| Tissue architecture: cell density & size, extracellular space tortuosity, gland formation, cell membrane integrity, necrosis Microvessel perfusion Quantifying the nongaussianity of any distribution and may evaluate membrane integrity | Availability No contrast agents No ionizing radiation | Technical complexity of advanced techniques (IVIM and DKI) |
| Magnetic resonance spectroscopy and spectroscopic imaging (MRS/I) | Chemical environment of the nuclear spin, such as number of chemical bonds, neighboring nuclei, and overall chemical structure | Ratios between metabolites Abnormal peaks of metabolites Absence of normal metabolites | Analysis of metabolic pathways | Specificity No contrast media | Technical complexity Difficult analysis |
Tumor response assessment using MR imaging
Tumor and normal tissue response evaluations are critical roles of imaging in oncology. In this setting, imaging findings depend highly on the type and method of therapy delivery, the timing of treatment, and the imaging technique being used to observe the effects ( Table 2 ). Additionally, combined therapies are increasingly being used in many tumor types, which may sometimes make it difficult to separate the net effect on imaging findings of every type of therapy.
| Type of Therapy | Perfusion/Permeability-Related Parameters | Diffusion-Related Parameters (ADC) |
|---|---|---|
| Antiangiogenic therapy | ||
| Early effect (normalization) | Variable effects on perfusion with a decreased permeability |
|
| Late effect | Decrease |
|
| Vascular disrupting agents | ||
| Early effect | Decrease |
|
| Late effect | Increase in tumor periphery due to tumor repopulation |
|
| RTP | ||
| Early effect (hyperemia) | Increase |
|
| Late effect | Decrease |
|
| CTP (mainly a late effect) |
|
|
| Other target therapies | ||
| EGFR/HER2 | No definitive data | No definitive data |
| KIT receptors | Decrease | Increase |
| PI3K/AKT/mTOR and RAS-RAF-MAPK pathways | No definitive data | No definitive data |
| MET pathway | No definitive data | No definitive data |
| Locoregional therapies | ||
| RFA |
|
|
| TACE | Decrease or absent |
|
| Immunotherapy |
| Increase |
| Hormonotherapy | Decrease |
|
Conventional Oncologic Therapies: Chemotherapy and Radiotherapy
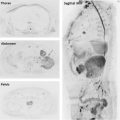
CTP causes cellular lysis often via dominant necrosis or apoptotic mechanisms. On DW-MR imaging, cellular lysis results in increased water diffusion, which increases the apparent diffusion coefficient (ADC) values. Elevations of ADC depend on the degree of cell kill and reactive inflammatory changes if any. Early increases in ADC often precede any change in the tumor size and may be used in the early assessment of response. The use of histogram analysis of ADC values has been shown to be more sensitive to detect effective treatment response than average tumor ADC change or shrinkage of tumor. In patients with successful treatment, the ADC histogram shifts to higher values, in contrast to nonresponders whereby no shift or shift to lower values is observed ( Fig. 1 ). In the case of bone metastatic involvement, whole-body MR imaging (WB-MR imaging) is increasingly being used to evaluate metastatic bone disease and to monitor its therapeutic response. Effective tumor response results in greater water diffusivity manifested as lower signal intensity on high b-value images, reductions in the extent of bone disease usually accompanied by higher ADC values. However, the extent of ADC increases with therapy (including CTP) is very variable and depends on the mechanism of cell kill and the complexity of bone marrow (BM) composition (hematologic cells, bone cells, fat, tumor involvement, and so forth), which can be independently altered by accompanying therapies and their effects. So granulocyte colony-stimulating factor (G-CSF) when used to support CTP can increase background high b-value image intensity due to normal BM hyperplasia, and HT can cause increased BM fat so lowering high b-value signal intensity. In the latter setting, a particular difficulty is the presence of fat intermixed with tumor infiltration as seen in myeloma or return of marrow fat infiltration that usually accompanies response and can counteract expected increases in ADC. This feature may explain the smaller ADC increases associated with bone disease responding to therapy. Conventional mono-exponential diffusion MR imaging evaluation assumes a Gaussian behavior of diffusion process (ie, free and unrestricted diffusion of water). However, in many biological tissues, the water diffusion process is no longer Gaussian, a feature noticeable on ultrahigh b-value images (>1500 s/mm 2 ). Diffusional kurtosis imaging (DKI) quantifies the deviation of tissue diffusion from a Gaussian pattern. Recently, the clinical value of DKI for tumor response evaluation has been undertaken. Chen and colleagues report that DKI might be superior to mono-exponentially derived ADC values for predicting early response to neoadjuvant CTP in patients with nasopharyngeal carcinoma; the latter is probably related to changes in intracellular complexity. Tumor cell kill also causes a subsequent withdrawal of angiogenic cytokines, which explains the indirect antivascular effect of CTP. On DCE imaging, a favorable tumor response to CTP results in decreases in the rate and magnitude of enhancement in several tumor types. The magnitude of antiangiogenic response to neoadjuvant CTP demonstrated by DCE-MR imaging can be predictive of overall and disease-free survival in some solid cancers but also in hematologic malignancies. In this setting, a change in signal intensity-time curves shape of 1 or more points was significant for overall 5-year survival in patients with breast cancer (BC) scored using a 5-curve–type classification schema encompassing wash-in and wash-out phases.

Response to CTP or radiation is usually associated on MRS/I with a decline in the levels of choline-containing metabolites and other tumor-associated metabolites. For example, in breast cancer, a reduction of total choline between pretreatment and within 24 hours of the first CTP dose was significantly correlated with subsequent changes in tumor size.
In the case of RTP, accurate disease localization is critical in order to prevent marginal misses and to maximally spare important normal organs at risk with dose escalation treatment strategies. In this setting, biological target volume definitions determined on physiologic, metabolic, and molecular MR imaging is actively being explored as a tool for RTP planning in different tumors. As a general rule, RTP induces similar changes than CTP on DW imaging (DWI) with added bystander effects on exposed adjacent tissues ( Figs. 2 and 3 ). DWI has demonstrated significant value in tumor response evaluation after RTP in brain, rectal, prostate, head and neck, and gynecological tumors. ADC increases occur as early as 24 to 72 hours after a single large fraction of radiation in radiosensitive tumors. Conversely, a failure to increase ADC values can be an indicator of radioresistance. Furthermore, increases in ADC values seem to occur incrementally in fractionated regimens, with the greatest increases visible toward the end of therapy. These ADC increases are mainly related to tumor cell death and the development of edema and inflammation. The clinical value of DKI for the evaluation of tumor response to RTP has not been established ( Fig. 4 ). Concerning DCE-MR imaging findings, initial increases of enhancement corresponding to the recognized acute hyperemic response can be depicted ( Fig. 5 ). In addition DCE-MR imaging may identify the sub-volume of the tumor resistant to RTP during the course of treatment, which can have substantial implications in RTP. Best local control and overall survival (OS) rates are achieved in those patients who have no or small subvolumes of tumors with poor enhancement pretreatment. Interestingly, RTP-induced hyperemia occurring early in tumors that initially show poor enhancement results in improved tumor local control and OS, compared with patients having persistent poor enhancement along the course of treatment. The latter suggests that improved tumor oxygenation resulting from initial RTP fractions are reversing tumor hypoxia and so improving the effectiveness of RTP. Therefore, radiation-induced changes in lesions can mimic tumor recurrence with an increase in the degree of enhancement and perilesional edema, a pitfall to be aware of. FMI may, thus, overcome the limitations of morphology-based conventional MR imaging after RTP. For example, a decrease of relative cerebral blood volume values in brain-radiated tumors indicates a tumor response to therapy regardless of increases in tumor volume. Finally, alterations more than the response patterns of tumors treated by combining therapies included with RTP, such as chemoradiotherapy, need to be considered. Increased contrast enhancement or edema that occurs following RTP associated with temozolomide can mimic tumor recurrence, which is named pseudoprogression; in these circumstances, lower blood volume can help to distinguish between active disease and CRT-induced necrosis.


Related posts:
 Body Diffusion-weighted MR Imaging in Oncology
 Assessment of Tumor Angiogenesis
Clinical Imaging of Tumor Metabolism with 1H Magnetic Resonance Spectroscopy
Multiparametric MR Imaging in Abdominal Malignancies
Multiparametric MR Imaging of Breast Cancer
Role of Multiparametric MR Imaging in Malignancies of the Urogenital Tract
Assessment of Tumor Angiogenesis
Clinical Imaging of Tumor Metabolism with 1H Magnetic Resonance Spectroscopy
Multiparametric MR Imaging in Abdominal Malignancies
Multiparametric MR Imaging of Breast Cancer
Role of Multiparametric MR Imaging in Malignancies of the Urogenital Tract
Stay updated, free articles. Join our Telegram channel

Full access? Get Clinical Tree


