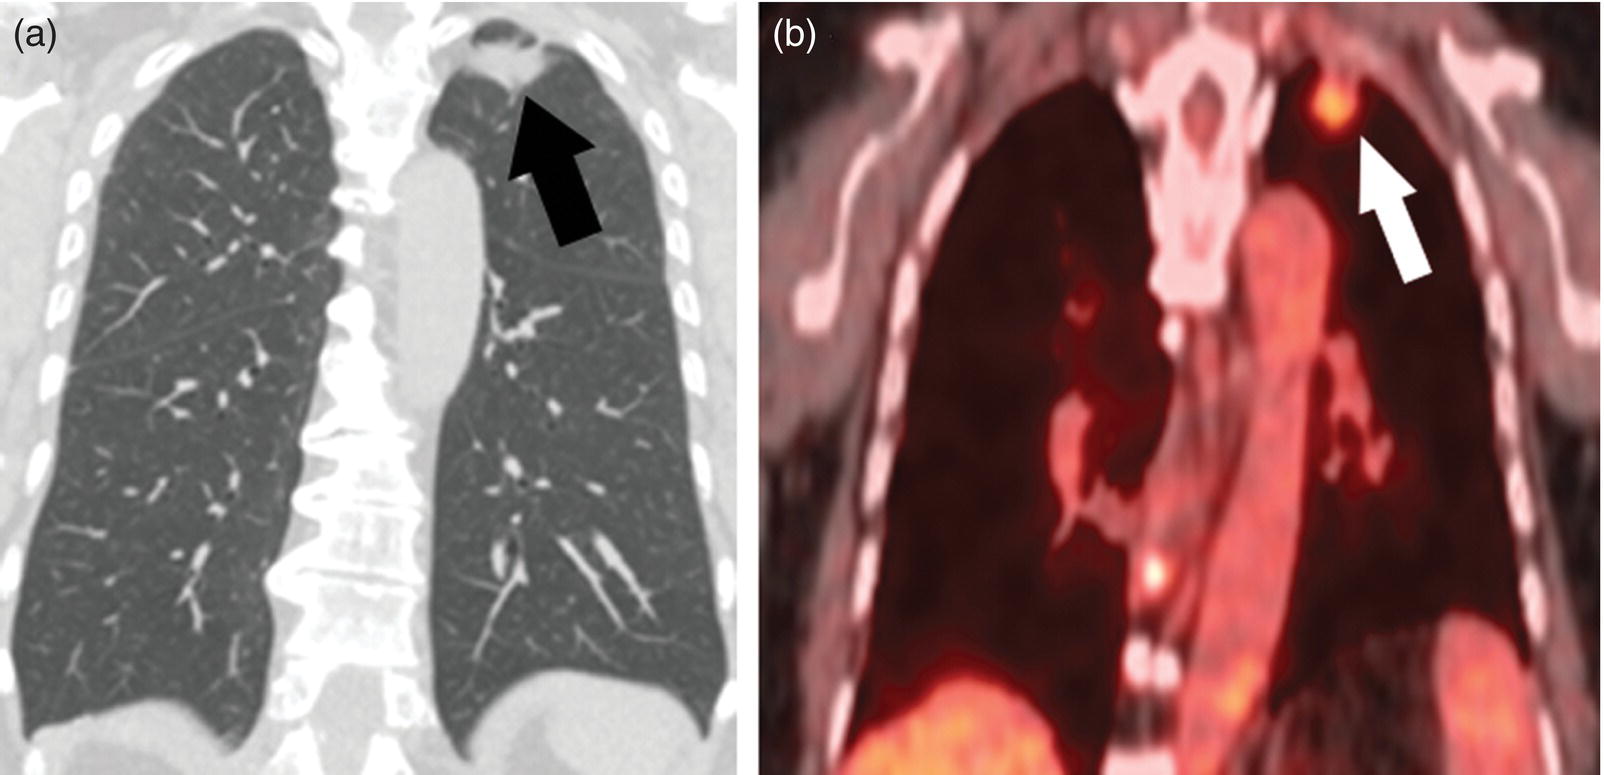
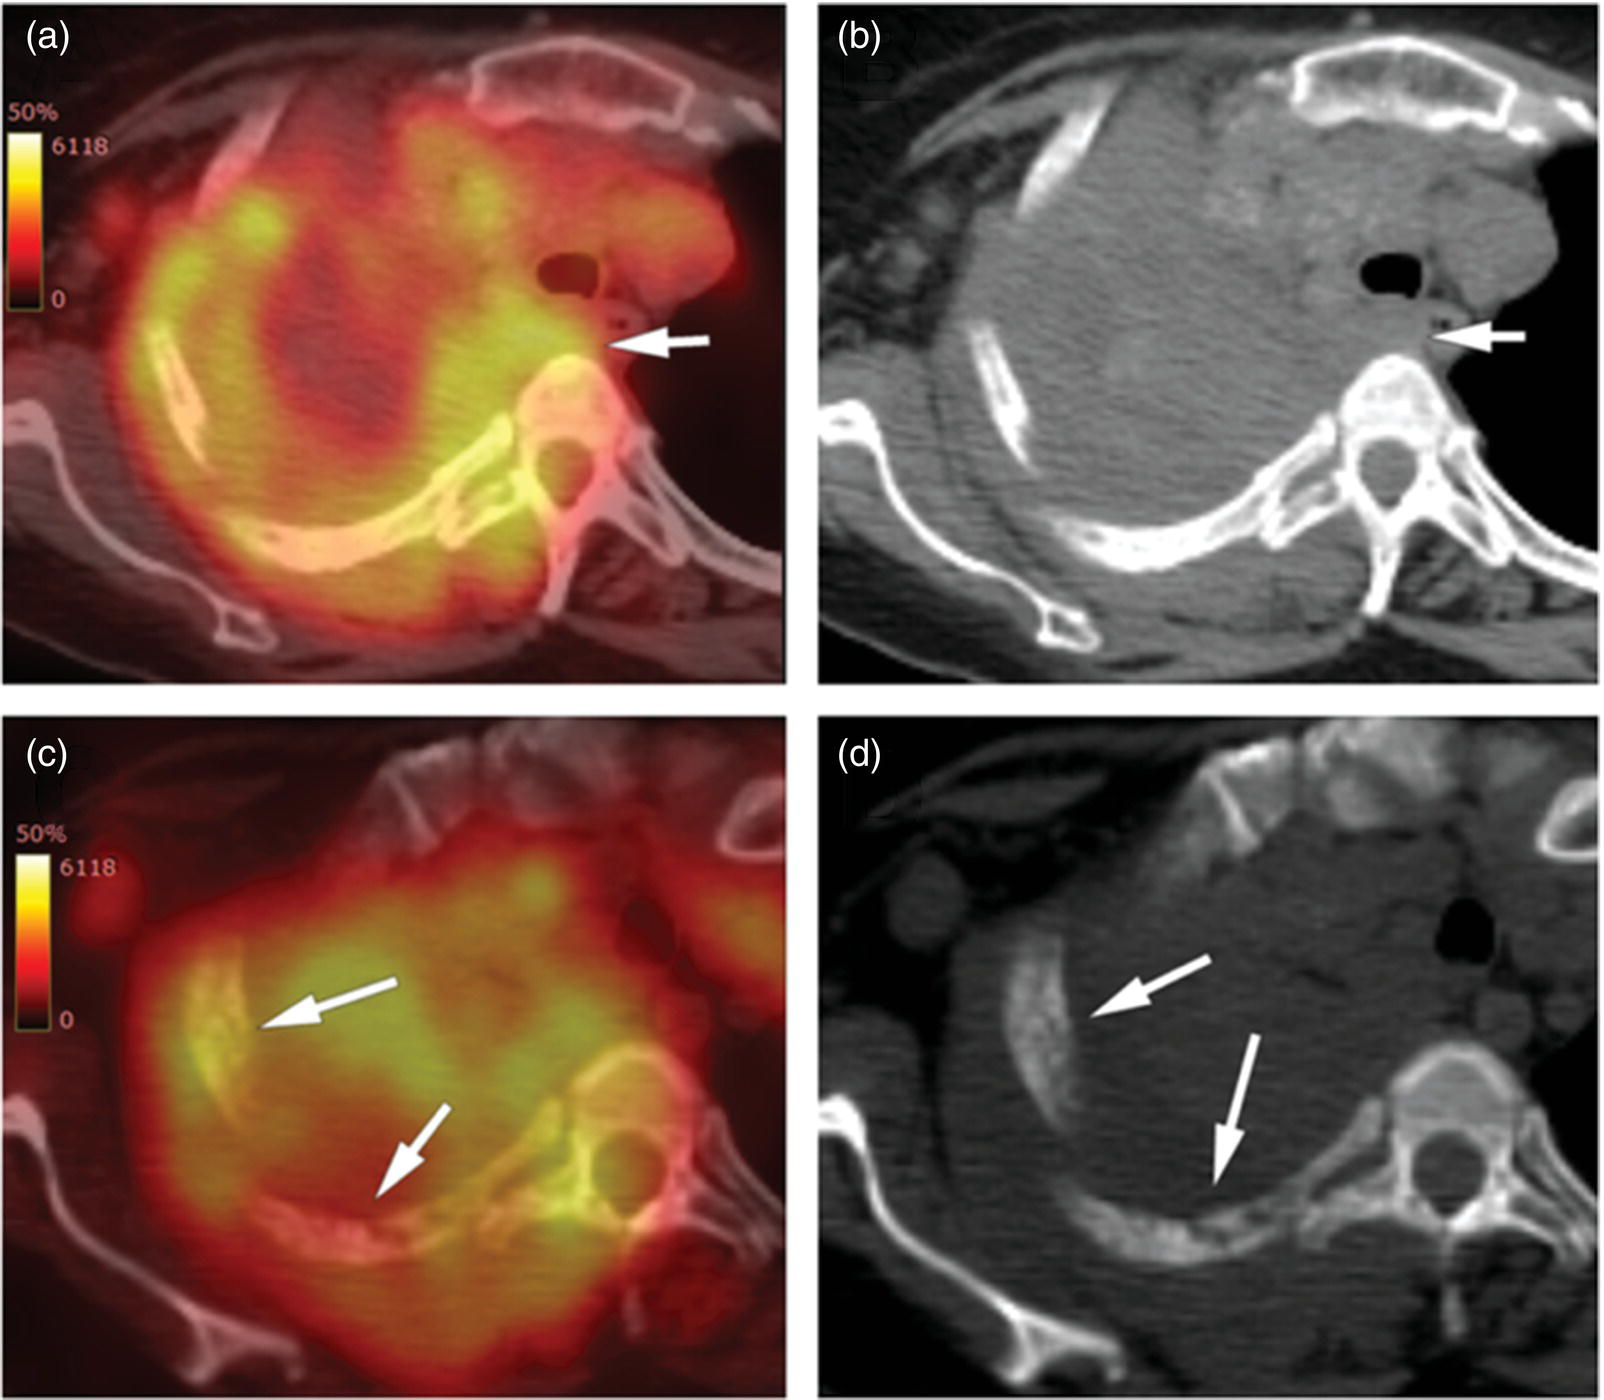
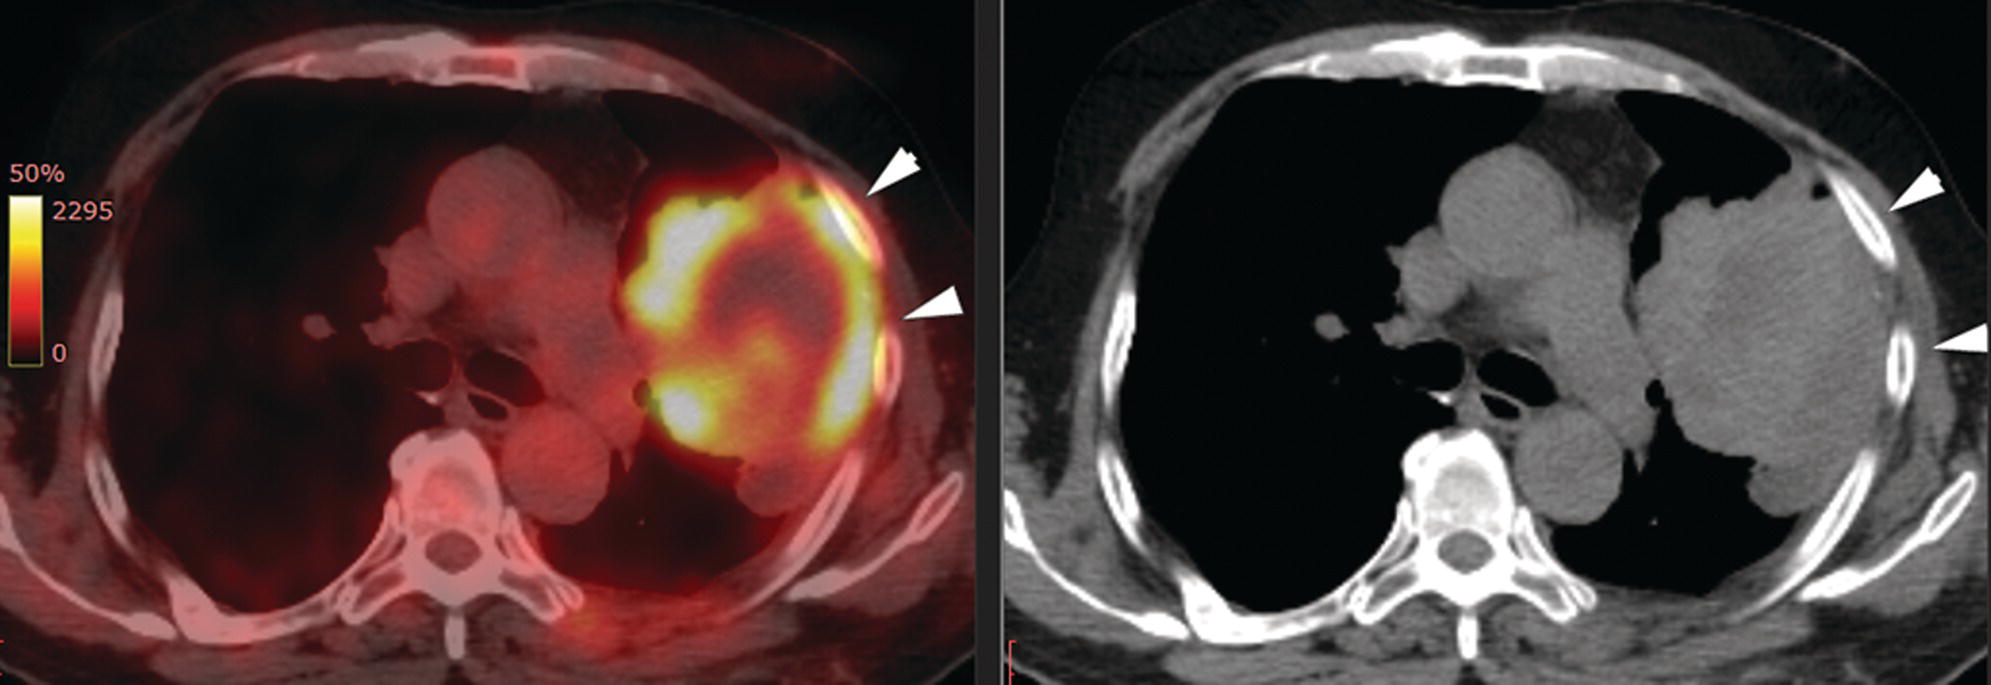
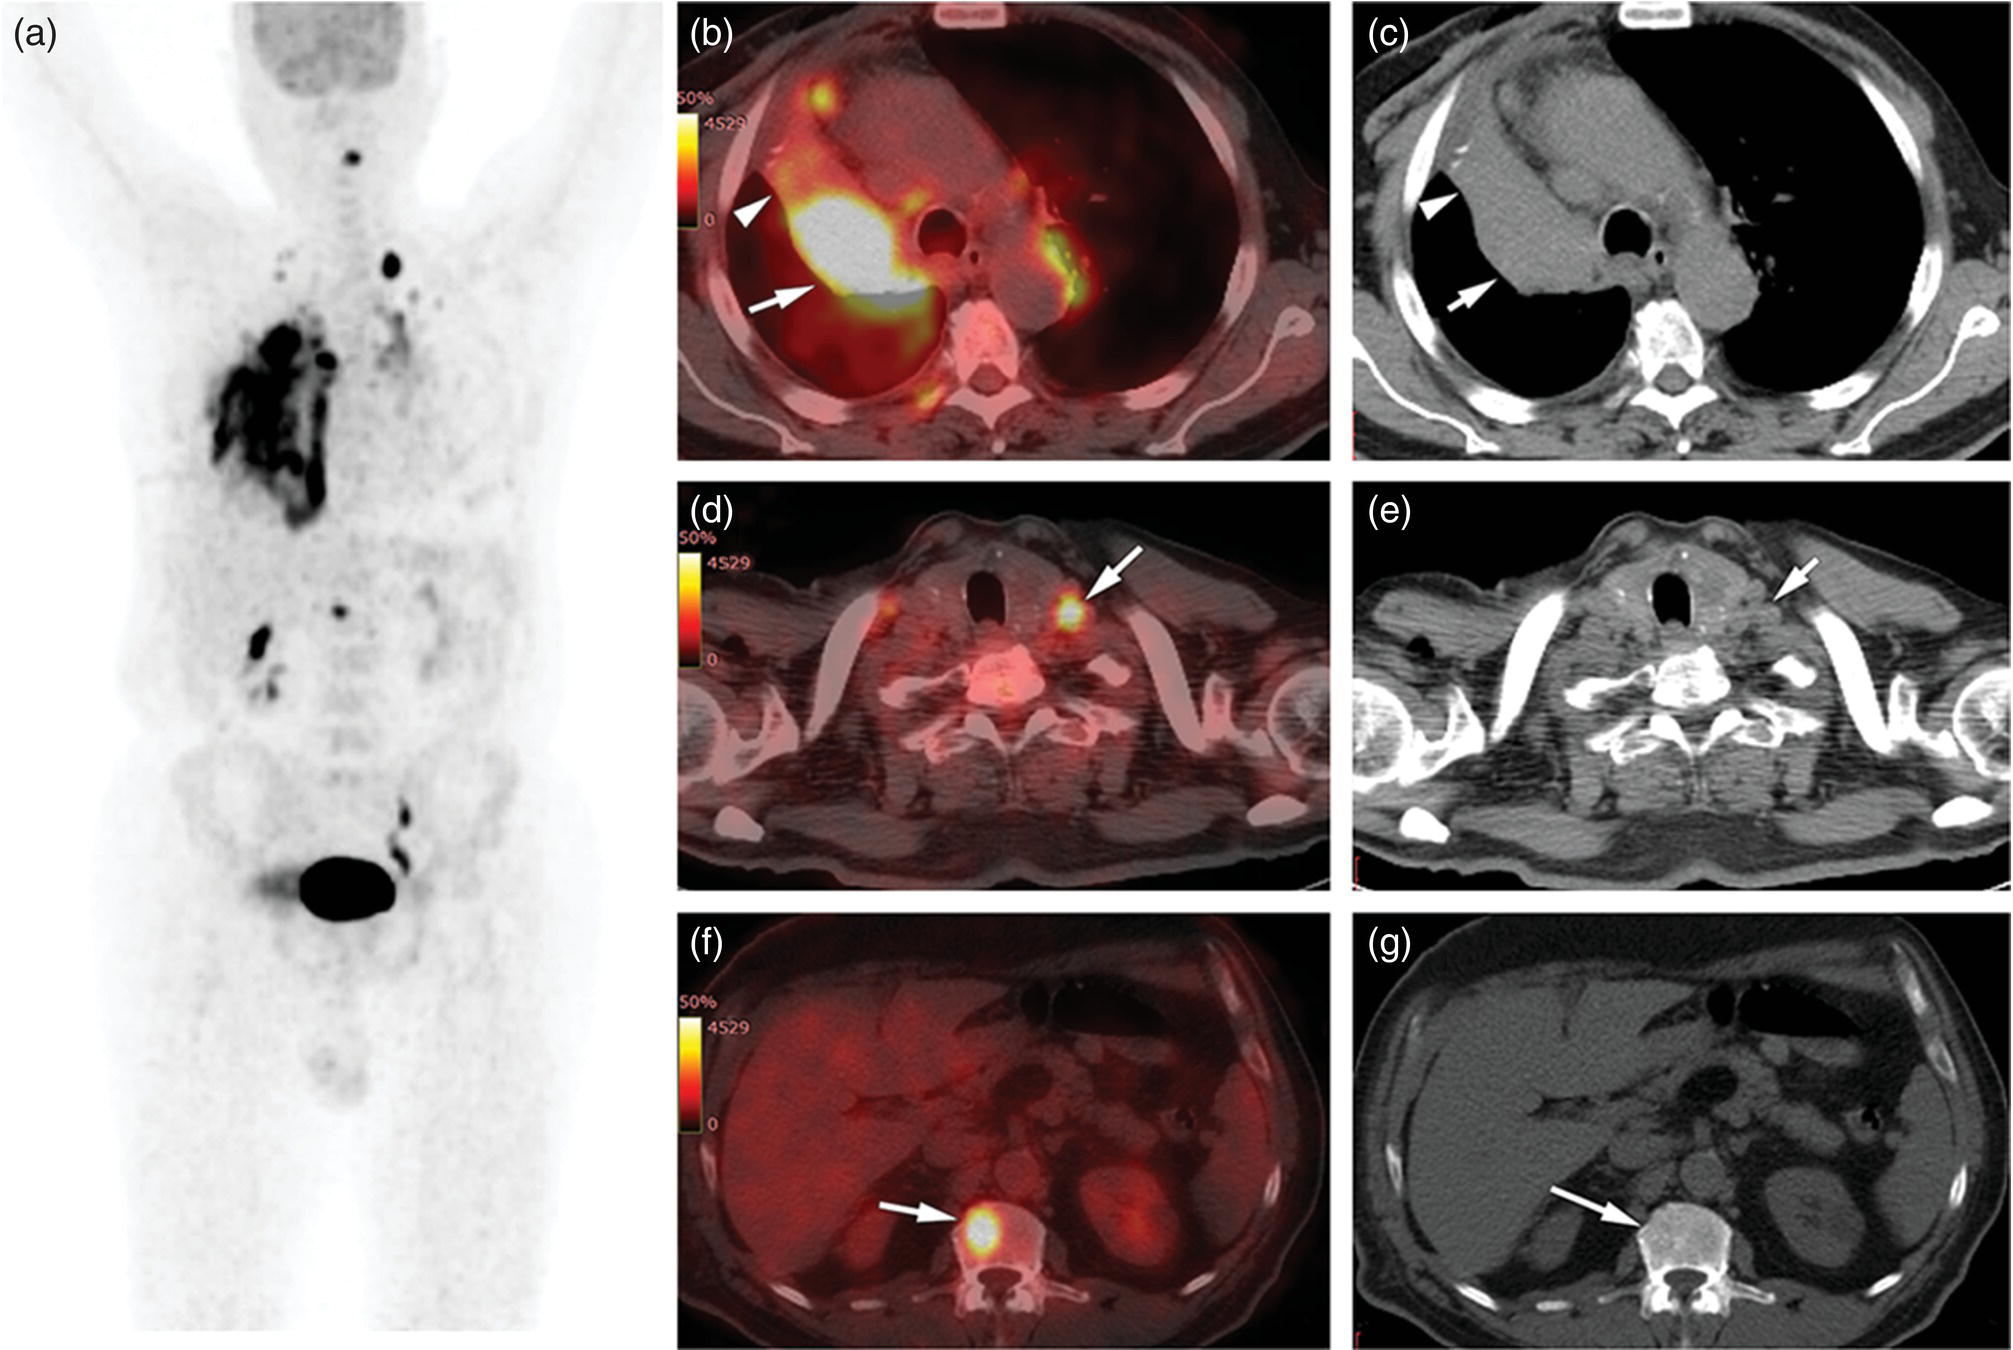
Sanaz Katal1, Thomas G. Clifford2, Kanhaiyalal Agrawal3, and Ali Gholamrezanezhad2 1 Nuclear Medicine Fellow, Medical Imaging Department, St Vincent’s Hospital Melbourne, Australia 2 Department of Radiology, Keck School of Medicine, University of Southern California, Los Angeles, CA, USA 3 Department of Nuclear Medicine, All India Institute of Medical Sciences, Bhubaneswar, India Solitary pulmonary nodules (SPNs), mostly detected on incidental chest radiographs (CRs) or computed tomography (CT) scans, pose a significant diagnostic dilemma to physicians. SPNs are small round lesions with a long diameter of ≤ 30 mm, not associated with local lymph node enlargement, distal atelectasis, surrounding satellite lesions, or pleural effusion [1]. Optimal management aims to resect malignant tumors without delay and avoid unnecessary invasive examinations or thoracotomy in benign nodules. Nevertheless, even with the current advances in imaging methods, these goals are not met in all cases, as it is sometimes impossible to distinguish between benign and malignant nodules. Size stability in serial lung imaging is accepted as a reliable indicator of the nodule’s benignity; however, in most cases, no prior studies are available. Consequently, several mathematical models have been established, incorporating clinical and imaging data, to provide an individual risk‐assessment model in patients with SPNs. Chest radiography: Plain CRs might be considered the primary routine examination due to their high availability, low cost, and lower dose radiation. In addition, the emerging digital CR could provide additional tools for large‐scale early lung cancer screening in the future. Xu et al. [2] reported a sensitivity of 77.3% for SPN detection when using a real‐time interactive pulmonary nodule analysis system during digital CR interpretation. CT scan: With the recent widespread popularity of CT scans, associated with the inherent drawbacks of plain radiographs, recent model assessments are mostly based on CT imaging features. Some models – including Mayo Clinic, Veterans Association, Brock University – have employed clinical and CT characteristics to predict SPN malignancy risk. Others, such as the Herder model, have additionally incorporated 18F‐fluorodeoxyglucose (FDG) avidity on positron emission tomography (PET)/CT examinations to predict the likelihood of malignancy in SPNs found on CT scans [3]. FDG PET/CT: FDG PET/CT has proved to be a relatively sensitive noninvasive method for detecting and evaluating pulmonary nodules. Fletcher et al. [4] demonstrated sensitivity and specificity of 91.7% and 82.3%, respectively, for compared to 95.6% and 40.6%, respectively, for CT studies, indicating the better ability of PET in evaluating an SPN. Also, PET correctly detected 58% of benign nodules that were incorrectly classified as malignant entities by CT imaging. Tang et al. [5] have shown that the diagnostic sensitivity, specificity, and accuracy of PET/CT in SPNs were 98.35%, 77.05%, and 91.21%, respectively. The age, diameter, mean standardized uptake value (SUVmean), and maximum standardized uptake value (SUVmax) of benign and malignant nodules were significantly different in their study. In addition, the area under the curve (AUC) of PET/CT was significantly higher than that of SUVmean, SUVmax, and CT. They concluded that FDG PET/CT had an excellent performance in evaluating different‐sized SPNs, especially those with a diameter between 11 and 20 mm. Similarly, Yu et al. [6] introduced a predictive model of risk prediction for SPN, using metabolic and morphologic characterization on PET/CT examinations. They found age, SUVmax, size, lobulation, calcification, and vacuoles as the most important risk factors for malignant nodules. These findings show the excellent ability of FDG PET/CT scans in the characterization of SPNs (Figure 11.1), although it is worth mentioning that the appearance of FDG uptake in a nodule can be influenced by the phenomenon of “partial volume effect.” Consequently, partial volume correction has been suggested to improve the SUV measurement and sensitivity for identifying malignancy in small nodules [7], although many still suggest that PET is not indicated for characterizing small nodules given these potential false‐negative results. Furthermore, some malignant neoplasms, such as typical carcinoids and certain early forms of adenocarcinoma (such as adenocarcinoma in situ), might lead to false‐negative findings on PET imaging, which may cause further difficulties in this regard. Furthermore, false FDG uptake is seen in infective/inflammatory pathologies like tuberculosis, sarcoidosis, etc. For solitary lung nodules, FDG PET/CT should be used in cases where the nodule is indeterminate and of size greater than 8–10 mm. However, PET/CT should not be used when there is high pre‐test probability of malignancy (>60%) or size less than 8 mm. Figure 11.1 SPN. A 76‐year‐old female presented with cough. The noncontrast chest CT demonstrates a soft tissue density noncalcified mass within the left upper lobe (a). FDG PET/CT reveals a metabolically active lesion with SUVmax of 3.8, concerning for malignant neoplastic disease (b). No evidence of nodal or distant metastatic disease is identified on PET/CT. MRI: The diagnostic ability of the diffusion‐weighted imaging (DWI) and apparent diffusion coefficient (ADC) maps in the differentiation of malignant and benign SPN cases has been evaluated in several studies [8]. It is believed that magnetic resonance imaging (MRI) findings are useful in following the SPN patients without satisfactory PET/CT results. Moreover, they might substitute chest CT for the follow‐up of patients with SPNs, especially in those who are not good candidates for ionizing radiation. Feng et al. [9] compared the discriminative ability of dynamic contrast‐enhanced‐magnetic resonance imaging (DCE‐MRI) with FDG PET/CT. The MRI pharmacokinetic parameters and the SUVmax of each SPN were calculated and compared statistically. These parameters were significantly different between benign and malignant nodules. Also, no significant difference was found between PET/CT and DCE‐MRI. Therefore, dynamic MRI is a useful method for discriminating benign SPNs from malignant ones, especially if contrast‐enhanced CT or FDG PET is not possible. More importantly, MRI has the advantage of evaluating tumor vascularity and vascular endothelial growth factor (VEGF) expression [10], as a well as being radiation‐free. Hence, MRI is a promising biomarker for characterizing SPNs and predicting tumor response to anti‐angiogenic treatment and patient survival. Lung cancer remains the leading cause of cancer‐related death in both men and women worldwide [11], and the second most common cancer diagnosis by gender, after prostate cancer for men and breast cancer for women. In the United States in 2018, lung cancer accounted for 14% of new cancers in men and 13% of new cancers in women [12]. The mortality in 2018 has been estimated at 83 550 deaths for men and 70 500 for women, around 25% of annual cancer fatalities. It is suggested that 10–25% of lung cancer patients are asymptomatic at the time of diagnosis, being detected on CRs [13]. Nonetheless, most patients are diagnosed after the onset of cancer symptoms. Clinical symptoms and signs of lung cancer vary with the stage and extent of the disease, and could be caused by the primary tumor, a metastatic disease, or malignancy‐related systematic symptoms. Persistent cough and dyspnea have been reported in several studies as the primary indicators of lung cancers [14, 15]. In addition, many patients experience nonspecific systematic symptoms, including weight loss, anorexia, fatigue, and paraneoplastic syndromes, as well chest pain, hemoptysis, Horner syndrome, enlarged lymph nodes, and facial swelling. The single greatest causal risk factor for lung cancer development is smoking tobacco cigarettes [16]. In the United States, the overall incidence of smoking and lung cancer has decreased over recent decades due to effective tobacco control programs. However, the morbidity and mortality of the tobacco epidemic remain high. Other factors that increase the risk for lung cancer include second‐hand exposure to cigarette smoke, exposure to radon and other toxic substances (e.g. asbestos, arsenic, diesel exhaust, silica, and chromium), having a first‐degree relative with lung cancer, and undergoing radiation therapy to the chest. There are two main types of lung cancer: small‐cell lung cancer (SCLC) and non‐SCLC (NSCLC). NSCLC comprises approximately 85% of lung cancer cases. Surgical resection with curative intent represents the most effective treatment for localized tumors at early stages. However, the majority of patients present with locally advanced or metastatic disease at the time of diagnosis. Hence, multimodality therapy is increasingly being employed using a combination of chemotherapy, radiotherapy, and very recently targeted biological regimes (such as anti‐angiogenesis agents and epidermal growth factor receptor inhibitors). This chapter focuses on the various imaging tools utilized for the detection, staging, and treatment of lung cancers. Early detection of lung cancer at an earlier stage of the disease is correlated positively with improved survival. Although a low‐dose CT scan has been established as the standard tool for screening and detecting lung cancer, chest X‐ray continues to remain the first‐line investigation in primary care. It has therefore been suggested that urgent chest radiography should be used in high‐risk patients presenting with unexplained symptoms [17]. However, the sensitivity of chest X‐ray for symptomatic lung cancer is only 77–80%, which mandates further evaluation in high‐risk patients who have had negative radiography. Thus, currently screening with low dose‐computed tomography (LDCT) is extensively used as an effective method to reduce lung cancer mortality [18]. According to the previous controlled trials such as the National Lung Screening Trial (NLST), LDCT screening could reduce lung cancer mortality in high‐risk patients by 20% compared to chest radiography. Lung cancer staging is based on the TNM classification system, adopted by the International Association for the Study of Lung Cancer (IASLC) and the American Joint Committee on Cancer (AJCC), which requires precise characterization of the primary tumor (T), regional lymph nodes (N), and distant metastases (M). To determine a correct treatment, accurate staging using CT and/or PET is of the utmost importance. Currently, lung hybrid PET/CT is the most accurate imaging modality in the evaluation of TNM status. Integrated PET/CT has improved lung cancer staging by adding functional maps to the anatomic localization and characterization of the lesions and therefore is superior to both CT alone and PET alone (Figure 11.1). Although the sensitivity of MRI is inferior to that of multidetector computed tomography (MDCT) for detecting subtle morphological characteristics, MRI now offers novel functional imaging methods such as perfusion assessment and measurement of respiratory mechanics and ventilation [19]. Due to the lack of ionizing radiation, repeated examinations allow for follow‐up of lung disease and monitoring of therapy response via quantitative imaging, providing unique functional features of such pathologies. Based on the latest TNM staging classification (8th edition), the T descriptor is determined by the size of the primary tumor, tumor extension or invasion into the adjacent structures, and the location of a separate tumor concerning the primary tumor (Tables 11.1–11.3) [20, 21]. Chest CT with intravenous contrast is the modality of choice for the initial evaluation of most lung cancer patients. CT imaging has been conventionally applied to characterize the T status, as this modality accurately demonstrates the size and location of the primary lesion, the direct tumoral extension, and the involvement of adjacent intrathoracic structures. However, CT is unable to precisely determine the tumoral invasion to the chest wall or the mediastinum. FDG PET alone is of limited value in T staging, as it suffers limitation regarding tumor size measurement and also determining the precise extent of the FDG uptake. Integrated PET/CT offers potentially added values to T staging by detecting chest wall (Figures 11.2 and 11.3) and mediastinal invasion (Figure 11.2), and evaluating the degree of atelectasis (Figure 11.4) involved in the CT tumor mass. Moreover, PET/CT offers valuable information considering the detection of malignant pleural effusions and pleural metastases. MR imaging is not routinely performed to evaluate patients with lung cancer; however, it is superior to both CT and FDG PET/CT for identifying mediastinal and chest wall invasion, and also evaluating the heart, pericardium, and vascular structures [22, 23]. Some of the characteristic parameters of chest wall invasion in MRI include infiltration of the normal extrapleural fat plane (on T1‐weighted view), hyperintensity of the parietal pleura (on T2‐weighted view), tumor fixation to the thoracic wall (on cine MRI), and evidence of rib destruction (on short tau inversion recovery [STIR] sequences). MRI is also superior to CT in differentiating the primary neoplasm and postobstructive atelectasis/pneumonitis as usually shows a higher signal on T2‐weighted imaging than the central tumor. Table 11.1 T staging in lung cancers. CT, computed tomography; AIS, adenocarcinoma in situ; GGN, ground‐glass nodules; mi, minimally invasive; PL1, tumor invasion of the elastic layer of visceral pleura without reaching the visceral pleural surface; PL2, tumor invasion of the visceral pleural surface; PL3, tumor invasion of the parietal pleura or chest wall. T classification for appearance on chest CT for TNM 8th edition. Table 11.2 N classification for appearance on chest CT for TNM, 8th edition. Table 11.3 M classification for appearance on chest CT for TNM, 8th edition. The N descriptor in the lung cancer TNM staging system is based on the metastatic lymph node locations. In this regard, CT and PET are the mainstays of noninvasive assessment of mediastinal nodes regarding tumoral involvement in lung cancers. On the structural imaging (CT and MRI), nodal metastases are primarily defined as enlarged lymph nodes measuring more than 1 cm in the short axis or presenting abnormal shape and configuration, attenuation, or central necrosis [24, 25]. However, based on this criterion, CT is reported to be relatively inaccurate for the detection of pathologic nodes, with sensitivity and specificity of 40–84% and 57–94%, respectively. Forty percent of CT‐positive lymph nodes have been proved to represent benign processes, while 20% of normal‐shaped nodes on CT scan have been found to be of a metastatic nature. PET is superior to CT for the identification of mediastinal nodal metastasis (Figures 11.4–11.6). In a meta‐analysis with 2865 patients, PET has a sensitivity of 74% and specificity of 85% for the detection of nodal metastatic disease in NSCLC [26]. Nevertheless, PET has a lower spatial resolution than CT. Moreover, PET alone does not provide accurate anatomic localization. Figure 11.2 Lung cancer staging. A 57‐year‐old man with histopathologically proven squamous cell carcinoma of the right lung. Staging FDG PET/CT shows a large heterogeneously hypermetabolic irregular soft tissue mass with SUVmax of 10.94 in the upper lobe of the right lung. Medially, the mass is infiltrating the right main bronchus and mediastinum (a and b, arrow) and laterally encasing the right first to fourth ribs with sclerosis and lysis of the ribs (c and d, arrows). Figure 11.3 Lung cancer staging. FDG PET/CT in a known case of lung adenocarcinoma shows a large hypermetabolic heterogenous soft tissue mass in the left lung abutting the left chest wall; however, chest wall or rib infiltration cannot be accurately commented on in FDG PET/CT. (Teaching point: local disease infiltration cannot be accurately assessed on FDG PET/CT.) Figure 11.4 Lung cancer staging. A 65‐year‐old male with adenocarcinoma of the right lung (a). FDG PET/CT demonstrates an intensely hypermetabolic soft tissue density mass lesion in the right upper lobe lung (b and c, arrows), abutting the right upper lobe bronchus with associated distal collapse of the right upper lobe lung (b and c, arrowheads). The mediastinum is shifted toward the right side. There is associated metastatic hypermetabolic pleural‐based and parenchymal left pulmonary nodules (not shown), mediastinal nodes (b, c), and bilateral supraclavicular lymph nodes (d, e). Furthermore, a hypermetabolic lesion is seen in the L2 vertebral body with SUVmax 22.49, indicative of distant metastatic disease, with no associated CT abnormality (f, g, arrows). (Teaching point: FDG PET/CT helps in differentiating tumor from the atelectatic changes and improves patient management in radiotherapy planning. Furthermore, metastatic disease can be detected earlier than with conventional modalities like CT).
11
Thoracic Malignancies
Solitary Pulmonary Nodules
Lung Cancer
Introduction
Initial Diagnosis and Staging of Lung Cancers
Primary Tumor
T classification
T components on CT
Tis (AIS)
Pure GGN ≤3 cm
T1mi
≤0.5 cm solid part within part‐solid tumor total size ≤3 cm
Ta
0.6–1.0 cm solid part within part‐solid tumor total size ≤3 cm
Pure GGN >3 cm
≤1 cm solid tumor
T1b
1.1–2.0 cm solid part within part‐solid tumor total size ≤3 cm
>1–2 cm solid tumor
T1c
2.1–3 cm solid part within part‐solid tumor total size ≤3 cm
>2–3 cm solid tumor
T2a
3.1–4 cm
Involves main bronchus without involvement of carina
T2b
4.1–5 cm
Total/partial atelectasis
Total/partial pneumonitis
Involves hilar fat
Involves visceral pleura (PL1 or PL2)
T3
5.1–7 cm
Separate tumor nodules in the same lobe as the primary
Involves parietal pleura (PL3)
Parietal pericardium
Chest wall
Phrenic nerve
T4
>7 cm
Involves diaphragm
Mediastinal fat or other mediastinal structures (trachea, great vessels, heart, recurrent laryngeal nerve, esophagus)
Carina
Vertebral body
Visceral pericardium
Separate tumor nodules in the same lung but different lobes as the primary
N classification
N component on CT
N0
No lymph node metastasis
N1
Ipsilateral peripheral, intrapulmonary or hilar nodes metastasis
N2
Ipsilateral mediastinal (upper, portico‐pulmonary, lower), subcarinal nodes metastasis
N3
Ipsilateral or contralateral supraclavicular/scalene lymph node or contralateral mediastinal, hilar/interlobar, or peripheral nodes metastasis
M classification
M component on CT
M0
No distal metastasis
M1
M1a
Intrathoracic metastasis
Pleural effusion
Pericardial effusion
Contralateral lung nodules/pleural nodules
M1b
Single extrathoracic metastasis in a single organ
M1c
Multiple extrathoracic metastasis
N Staging
Stay updated, free articles. Join our Telegram channel

Full access? Get Clinical Tree


