Time, Dose, and Fractionation in Radiotherapy
▪ THE INTRODUCTION OF FRACTIONATION
The multifraction regimens commonly used in conventional radiation therapy are a consequence largely of radiobiologic experiments performed in France in the 1920s and in the 1930s. It was found that a ram could not be sterilized by exposing its testes to a single dose of radiation without extensive skin damage to the scrotum, whereas if the radiation was spread out over a period of weeks in a series of daily fractions, sterilization was possible without producing unacceptable skin damage (Fig. 23.1). It was postulated that the testes were a model of a growing tumor, whereas the skin of the scrotum represented a dose-limiting normal tissue. The reasoning may be flawed, but the conclusion proved to be valid: Fractionation of the radiation dose produces, in most cases, better tumor control for a given level of normal tissue toxicity than a single large dose.
▪ THE FOUR Rs OF RADIOBIOLOGY
Now, more than 80 years later, we can account for the efficacy of fractionation based on more relevant radiobiologic experiments. We can appeal to the “four Rs” of radiobiology to be as follows:
Repair of sublethal damage
Reassortment of cells within the cell cycle
Repopulation
Reoxygenation
The basis of fractionation in radiotherapy can be understood in simple terms. Dividing a dose into several fractions spares normal tissues because of repair of sublethal damage between dose fractions and repopulation of cells if the overall time is sufficiently long. At the same time, dividing a dose into several fractions increases damage to the tumor because of reoxygenation and reassortment of cells into radiosensitive phases of the cycle between dose fractions.
The advantages of prolongation of treatment are to spare early reactions and to allow adequate reoxygenation in tumors. Excessive prolongation, however, allows surviving tumor cells to proliferate during treatment.
▪ THE STRANDQUIST PLOT AND THE ELLIS NOMINAL STANDARD DOSE SYSTEM
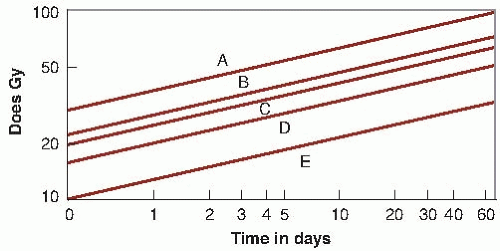
Early attempts to understand and account for fractionation gave rise to the well-known Strandquist plot, in which total dose was plotted as a function of the overall treatment time (Fig. 23.2). Because all treatments were given as three or five fractions per week, overall time in this plot contains, by implication, the number of fractions as well. It commonly was found in these plots that the slope of the isoeffect curve for skin was about 0.33; that is, the total dose for an isoeffect was proportional to T0.33.
The most important contribution in this area, made by Ellis and his colleagues with the introduction of the nominal standard dose (NSD) system, was the recognition of the importance of separating overall time from the number of fractions. According to this hypothesis, total dose for the tolerance of connective tissue is related to the number of fractions (N) and the overall time (T) by the relation

The NSD system has been discussed extensively. It does enable predictions to be made of equivalent dose regimens, provided that the range of time and number of fractions are not too great and do not exceed the range over which the data are available. For example, in changing a treatment protocol from five to four fractions per week, the formula can be used to calculate the size of dose fractions needed to result in the same normal tissue tolerance with the two different protocols. Of course, because the system is based ultimately on skin reaction data, it does not, in any way, predict late effects. An obvious weakness of the NSD system is that time is allowed for in terms of a single power function, in which the nominal single dose is proportional to T0.11. In fact, biologic experiments with small animals have shown that this relationship is far from accurate. Proliferation does not affect the total dose required to produce a given biologic reaction at all until some time after the start of irradiation but, then, the dependence in time is much greater than allowed
for by the Ellis formula. For these and other reasons, the NSD system is seldom used nowadays.
for by the Ellis formula. For these and other reasons, the NSD system is seldom used nowadays.
▪ PROLIFERATION AS A FACTOR IN NORMAL TISSUES
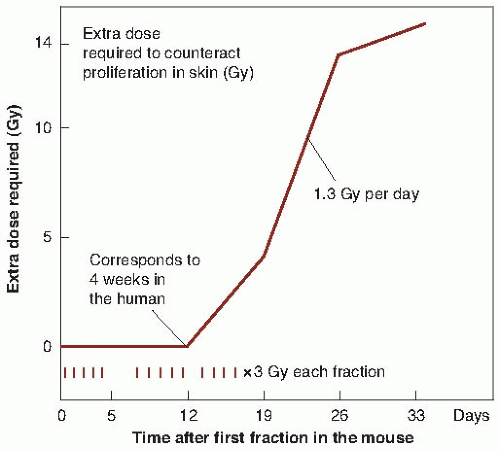
Experimental evidence indicates that the total dose required to produce a given biologic effect is not a power function of time, as postulated by the Ellis NSD system, but turns out to be more complex. The extra dose required to counter proliferation and result in a given level of skin damage in mice does not increase at all until about 12 days into a fractionated regimen but, then, it increases very rapidly as a function of time. The shape of the curve is roughly sigmoidal (Fig. 23.3). If similar data were available for humans, the effects of proliferation would not be seen until a longer period into a fractionation regimen because of the slower response of the human skin and the longer cell cycle of the individual cells. Figure 23.3 is not meant to be quantitative, but to indicate that the shape of the curve relating extra dose to proliferation is sigmoidal. This illustrates immediately that the method of allowing for overall time in the NSD system is incorrect or, at best, is a very crude approximation.
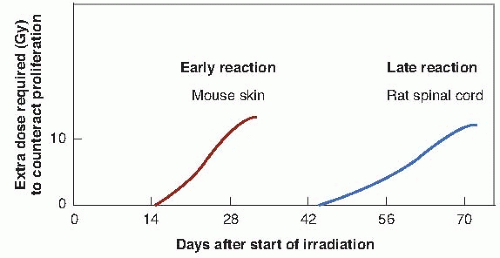
A further consideration is that all normal tissues are not the same. In particular, there is a clear distinction between tissues that are early responding, such as the skin, mucosa, and intestinal epithelium, and those that are late responding, such as the spinal cord. Figure 23.4 shows the extra dose required to produce a given level of damage for a fractionated protracted regimen in the case of representative tissues from the
early- and late-responding groups. This diagram compares mouse skin, representative of earlyresponding tissues, and rat spinal cord, representative of late-responding tissues. It is recognized that these may not be ideal examples, but suitable data for more relevant systems are simply not available; comparable quantitative data certainly are not available for humans. The point made by this figure is that the time after the start of a fractionated regimen at which extra dose is required to compensate for cellular proliferation is quite different for late- versus early-responding tissues. The other point made, of course, is that these are data from rodents and that in the case of humans, the time scales (although they are not known with any precision) are likely to be very much longer. In particular, the time at which extra dose is required to compensate for proliferation in late-responding tissues in humans is far beyond the overall time of any normal radiotherapy regimen.
early- and late-responding groups. This diagram compares mouse skin, representative of earlyresponding tissues, and rat spinal cord, representative of late-responding tissues. It is recognized that these may not be ideal examples, but suitable data for more relevant systems are simply not available; comparable quantitative data certainly are not available for humans. The point made by this figure is that the time after the start of a fractionated regimen at which extra dose is required to compensate for cellular proliferation is quite different for late- versus early-responding tissues. The other point made, of course, is that these are data from rodents and that in the case of humans, the time scales (although they are not known with any precision) are likely to be very much longer. In particular, the time at which extra dose is required to compensate for proliferation in late-responding tissues in humans is far beyond the overall time of any normal radiotherapy regimen.
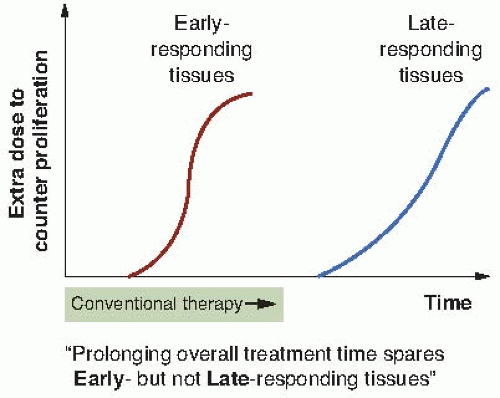
Figure 23.5 is an attempt to convert the experimental laboratory data contained in Figure 23.4 into a general principle that can be applied to clinical practice. Early-responding tissues are triggered to proliferate within a few weeks of the start of a fractionated regimen so that the “extra dose to counter proliferation” increases with time, certainly during conventional radiotherapeutic protocols. By contrast, conventional radiotherapy extending to 6 or 8 weeks is never long enough to allow the triggering of proliferation in late-responding tissues. These considerations lead to the following important axiom:
Prolonging overall time within the normal radiotherapy range has little sparing effect on late reactions, but a large sparing effect on early reactions.
This has far-reaching consequences in radiotherapy. Early reactions, such as reactions of the skin or of the mucosa, can be dealt with easily by the simple expedient of prolonging the overall time. Although such a strategy overcomes the problem of the early reactions, it has no effect whatsoever on the late reactions.
▪ THE SHAPE OF THE DOSE-RESPONSE RELATIONSHIP FOR EARLY- AND LATE-RESPONDING TISSUES
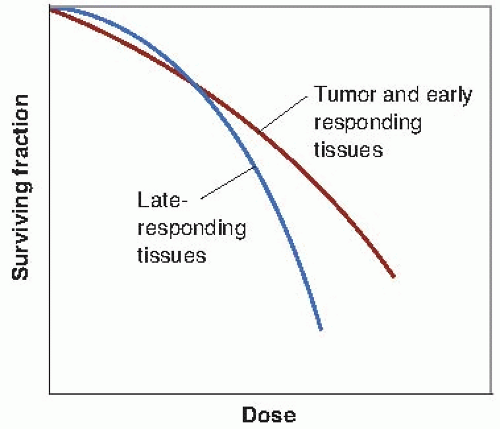
Clinical and laboratory data suggest that there is a consistent difference between early- and late-responding tissues in their responses to changing fractionation patterns. If fewer and larger dose fractions are given, late reactions are more severe, even though early reactions are matched by an appropriate adjustment in total dose. This dissociation can be interpreted as differences in repair capacity or shoulder shape of the underlying dose-response curves. The dose-response relationship for late-responding tissues is more curved than that for early-responding tissues. In terms of the linear-quadratic relationship between effect and dose, this translates into a larger α/β ratio for early effects than for late effects. The difference in the shapes of the dose-response relationships is illustrated in Figure 23.6. The α/β ratio is the dose at which cell killing by the linear (α) and the quadratic (β) components are equal. (See Fig. 23.12)
For early effects, α/β is large; as a consequence, α dominates at low doses, so that the dose-response curve has a marked initial slope and does not bend until higher doses. The linear and quadratic components of cell killing are not equal until about 10 Gy. For late effects, α/β is small, so that the β term has an influence at low doses. The dose-response curve bends at lower
doses to appear more curved; the linear and quadratic components of cell killing are equal by about 2 Gy.
doses to appear more curved; the linear and quadratic components of cell killing are equal by about 2 Gy.
Dose-response curves for organ function must be distinguished clearly from those for clonogenic cell survival. The distinction is not a trivial one. Organ function obviously is related more to the proportion of functional cells remaining in an irradiated organ at a particular time than to the proportion of clonogenic (stem) cells. The dose-effect curves for clonogenic cells tend to be straight, with relatively small shoulders, whereas dose-effect relations for organ function tend to be more curved, with larger shoulders. It is, of course, the dose-response curves for organ function that are more relevant to the tolerance of normal tissues.
There are three pieces of information from clinical experience and animal studies that represent circumstantial evidence for the conclusion that the shape of the dose-response relationship differs for early- and late-responding tissues. First, if a fractionation scheme is changed in clinical practice from many small doses to a few large fractions and the total dose is titrated to produce equal early effects, the treatment protocol involving a few large fractions results in more severe late effects. There is an abundance of clinical evidence for the truth of this statement.
Second, clinical trials of hyperfractionation, in which two doses are delivered per day for 6 or 7 weeks, appear to result in greatly reduced late effects if the total dose is titrated to produce equal or possibly slightly more severe acute effects. Tumor control is the same or slightly improved. This important clinical observation has been made in several centers and, again, is compatible with the same difference in shape of dose-response curves between early- and late-responding tissues. Late-responding tissues are more sensitive to changes in fractionation patterns than are early-responding tissues.
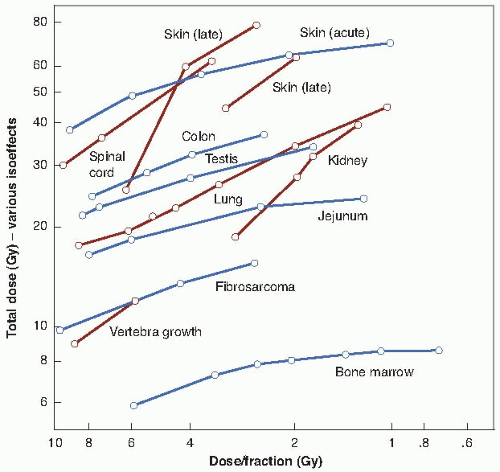
Third, in experiments with small laboratory animals, the isoeffect curves (i.e., dose vs. number of fractions to produce an equal biologic effect) are steeper for a range of late effects than for various acute effects. The data are shown in Figure 23.7, in which early effects are represented by, for example, skin desquamation or jejunal crypt colonies, and late effects are represented by, for example, lung or spinal cord injury.
Table 23.1 is a summary of the values of α/β for several early- and late-responding tissues. The important result is that for early-responding tissues, α/β (i.e., the dose at which single- and multiple-event cell killing is about equal) occurs at the dose of about 10 Gy. By contrast, α/β for late-responding tissues is about 2 Gy. The values of α/β shown in Table 23.1 come from experiments in which the reciprocal of the total dose is plotted against the quadratic relationship in biologic systems in which it is possible to observe equal effects from various fractionation regimens, even though single cell dose-survival curves cannot be generated. (See Fig. 19.28)
The parameters derived from curves reconstructed from multifraction experiments are specifically relevant to the end point measured in each experiment, whether it is a proportion of clonogenic cells or a stated reduction in organ function. The dose-response curve constructed from multifraction experimental data by making simple assumptions is a functional dose-response curve, deduced from data in which repair after each fractional dose is basically the quantity being measured. It is just such functional dose-response curves that are required to elucidate the relationship between tolerance dose in radiotherapy and size of dose per fraction, with overall time considered separately.
TABLE 23.1 Ratio of Linear to Quadratic Terms from Multifraction Experiments | ||||||||||||||||||||||||||||||||||
|---|---|---|---|---|---|---|---|---|---|---|---|---|---|---|---|---|---|---|---|---|---|---|---|---|---|---|---|---|---|---|---|---|---|---|
| ||||||||||||||||||||||||||||||||||
▪ A POSSIBLE EXPLANATION FOR THE DIFFERENCE IN SHAPE OF DOSE-RESPONSE RELATIONSHIPS FOR EARLY- AND LATE-RESPONDING TISSUES
The radiosensitivity of a population of cells varies with the distribution of cells through the cycle. In general, cells are most resistant in late S phase; slowly growing cells with a long cycle, however, may have a second resistant phase in the early G1 phase, which may be termed G0 if the cells are out of cycle. Thus, two quite different cell populations may be radioresistant.
A population proliferating so fast that S phase occupies a major portion of the cycle.
A population proliferating so slowly that many cells are in early G1 or not proliferating at all, so that many resting cells are in G0.
It is thought that many late-responding normal tissues are resistant, owing to the presence of many resting cells. This type of resistance applies particularly to small doses per fraction and disappears at larger doses per fraction.
If resistance results from the presence of many cells in S phase in a rapidly proliferating population, redistribution occurs through all the phases of the cell cycle, which can be considered as a “self-sensitizing” activity. The fast proliferation itself is a form of resistance because the new cells produced by division offset those killed by the dose fractions. This applies to acutely responding tissues and also to tumors. Proliferation occurring during a protracted, fractionated regimen helps to spare normal tissues but, of course, is a potential danger as far as the tumor is concerned. This is discussed later in this chapter.
▪ FRACTION SIZE AND OVERALL TREATMENT TIME: INFLUENCE ON EARLY- AND LATE-RESPONDING TISSUES
The difference in shape of the dose-response relationship for early- and late-responding tissues leads to an important axiom:
Fraction size is the dominant factor in determining late effects; overall treatment time has little influence. By contrast, fraction size and overall treatment time both determine the response of acutely responding tissues.
It is remarkable that neither clinical radiation oncologists nor experimental radiobiologists came to recognize this simple fact before it was described by Withers in the 1980s.
▪ ACCELERATED REPOPULATION
Treatment with any cytotoxic agent, including radiation, can trigger surviving cells (clonogens) in a tumor to divide faster than before. This is known as accelerated repopulation.
Figure 23.8 illustrates this phenomenon in a transplanted rat tumor. Figure 23.8A shows the overall growth curve for this tumor, together with the shrinkage and regrowth that occurs after a single dose of 20 Gy of x-rays. Figure 23.8B shows the proliferation of individual surviving cells (i.e., clonogenic cells), which, after treatment, are dividing with a cycle time of 12 hours. The important point to note is that during the time that the tumor is overtly shrinking and regressing, the surviving clonogens are dividing and increasing in number more rapidly than before treatment.
There is evidence for a similar phenomenon in human tumors. Withers and his colleagues surveyed the literature on radiotherapy for head and neck cancer and estimated the dose to achieve local control in 50% of cases as a function of the overall duration of fractionated treatment. The results are summarized in Figure 23.9. The analysis suggests that clonogen repopulation in this rapidly growing human cancer accelerates at about 28 days after the initiation of radiotherapy in a fractionated regimen. A dose increment of about 0.6 Gy per day is required to compensate for this repopulation. Such a dose increment is consistent with a 4-day clonogen doubling rate, compared with a median of about 60 days for unperturbed growth.
The conclusion to be drawn from this is that radiotherapy, at least for head and neck cancer and probably for other fast growing tumors, should be completed as soon after it has begun, as is practicable. It may be better to delay initiation of treatment than to introduce delays during treatment. If overall treatment time is too long, the effectiveness of later dose fractions is compromised because the surviving clonogens in the tumor have been triggered into rapid repopulation.
The experimental data referred to here all relate to radiotherapy. It might be anticipated, however, that similar considerations would apply to chemotherapy or to a combination of radiotherapy and chemotherapy. There is evidence in some human malignancies that radiotherapy produces poorer results if preceded by a course of chemotherapy. It may be that accelerated repopulation, triggered by the chemotherapy, is the explanation.
▪ MULTIPLE FRACTIONS PER DAY
We are now in a position to sum up the pros and cons of fractionation and prolongation of treatment in a much more sophisticated way than would have been possible at the beginning of this chapter. The advantages of prolongation of treatment are to spare early reactions and to allow adequate reoxygenation in tumors. Excessive prolongation, however, has two disadvantages, they are as follows:
It can decrease deceptively the acute reactions without sparing late injury, and
It allows the surviving tumor cells to proliferate during treatment.
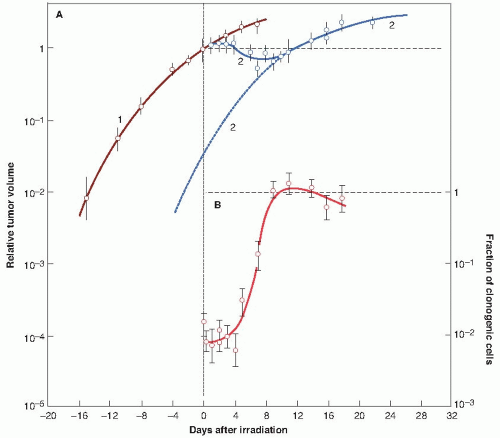 FIGURE 23.8 Accelerated repopulation. Growth curves of a rat rhabdomyosarcoma showing the shrinkage, growth delay, and subsequent recurrence following treatment with a single dose of 20 Gy of x-rays. A: Curve 1: Growth curve of unirradiated control tumors. Curve 2: Growth curve of tumors irradiated at time t = 0, showing tumor shrinkage and recurrence. B:
Get Clinical Tree app for offline access
Stay updated, free articles. Join our Telegram channel
Full access? Get Clinical Tree


|

