Fig. 16.1
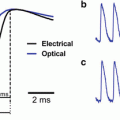
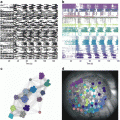
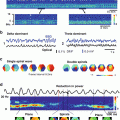
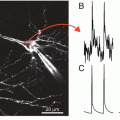
Comparison of optical and electrical activation times in isolated rat hearts. (a) Activation map based on time of maximal upstroke velocity (tF*) following stimulation in the center of the field-of-view. (b) Activation map based on a 50 % fluorescence threshold (tF50) for the same activation sequence as in Panel a. The white dashed lines indicate the directions of fastest propagation. (c) Comparison between electrical (black) and optical (blue) upstrokes measured in point 1 in Panels a and b. (d) Comparison between electrical (black) and optical (blue) upstrokes measured in point 2 in Panels a and b. The crosses indicated the point of maximal upstroke velocity both in the optical (blue) and electrical (black) traces. The vertical dashed lines indicate the electrical activation time, while the horizontal line indicates the 50 % fluorescence level. Modified from Walton et al. (2012)
2.2 Upstroke Morphology and Sub-surface Wave Front Orientation
The optical blurring of the upstroke can be seen as a limitation on the effective spatial resolution that can be achieved independent of the optical setup. However, it has been shown that the optical upstroke also contains useful 3D information. Indeed, the slope of the optical upstroke is steepest when myocardium depolarizes in layers that contribute the most to the optical signal. In the case of epi-fluorescence optical mapping, where the imaged surface is also the illuminated surface, the near-surface layers of the optical integration volume contribute more than the deeper layers. The timing of the steepest portion of the optical upstroke is therefore determined by the orientation of the wave front (Hyatt et al. 2005, 2008; Zemlin et al. 2008). In the case of a wave front originating and propagating from the imaged surface toward deeper layers, the maximum positive slope of the fluorescent signal occurs early during the rise of the optical upstroke (Fig. 16.2a). Conversely, a wave front propagating from the deeper myocardium, toward the imaged surface produces the maximal slope later in the optical upstroke (Fig. 16.2b). Therefore, the orientation of the electrical wave front, with respect to the imaged surface, can be extrapolated from the relative level at which the maximal slope occurs during the optical upstroke, denoted as VF*. Furthermore, there appears to be a good correlation between VF* and the angle of the sub-surface wave front with respect to the imaged surface. This important observation has been verified experimentally in various conditions (Hyatt et al. 2008; Zemlin et al. 2008).
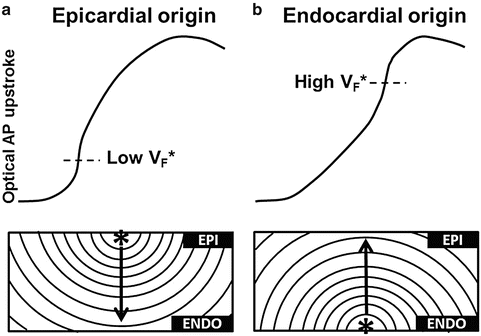

Fig. 16.2
Optical upstroke morphology vs sub-surface wave front orientation. (a) Representative optical upstroke (top) measured from the epicardium for a wave front originating at the epicardium and propagating intramurally towards the endocardium (bottom), with a typical low relative fluorescence level at which the steepest portion of the upstroke occurs (VF*). (b) Representative optical upstroke (top) measured from the epicardium for a wave front originating at the endocardium and propagating towards the epicardium (bottom), with a typical high relative fluorescence level at which the steepest portion of the upstroke occurs (VF*)
3 Probing Deeper in to the Myocardium
3.1 Transillumination
As discussed above, the most common application of optical mapping is the epi-fluorescence mode. In this configuration measured electrical activity is confined predominantly to a thin layer close to the tissue surface (<2 mm) constituting only a small portion of the ventricular wall. Several studies have attempted to measure electrical activity from a greater range of depths of the myocardium in the transmural plane, including multiple plunge needle electrodes and measuring directly from the cut surface in wedge preparations (Di Diego et al. 2013; Glukhov et al. 2010). The former approach has relatively limited spatial resolution and can only yield electrograms (no action potentials), whereas the latter only provides information from a specific transmural plane. In order to circumvent the limitations associated with cut surfaces and extend the optical penetration depth of optical mapping, a new technique using a transillumination approach was proposed by Baxter et al. (2001). Transillumination consists of aiming the excitation light on to the opposite surface of tissue to the photodetector, as shown schematically for a ventricular wedge preparation in Fig. 16.3a. Baxter et al. (2001) examined transillumination signals in right ventricular wedge preparations dissected from sheep hearts. A CCD camera was aimed at one tissue surface and the contralateral surface illuminated for acquisition in transillumination mode. Surface pacing was used to drive the excitation wave front in a regular and controlled manner so that wave fronts originated from the imaged surface and propagated transmurally, activating lastly the opposing illuminated surface. Under such activation sequences, there is a latency in the earliest AT identified during transillumination imaging relative to reflected imaging whereby illumination was switched to the imaged surface (Fig. 16.3b). The AT latency is due to the orientation of the propagating wave front, which originated at the imaged surface and travelled toward the opposing surface therefore confirming that transillumination signals originate from deeper layers of the myocardium than reflected signals. A biophotonic model showing that the depth contribution to the optical signal was significantly increased in transillumination vs. epi-fluorescence corroborated these various observations.
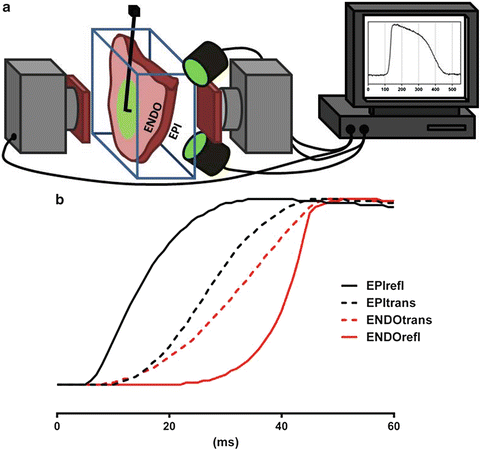

Fig. 16.3
(a) Schematic representation of a typical dual camera transillumination setup where one surface (epicardium) is illuminated and fluorescence is acquired both in epi-fluorescence and transillumination. (b) Optical action potential traces from different imaging modalities acquired from both epi- and endocardium illustrating a typical epi- to endocardium activation sequence. Modified from Baxter et al. (2001)
Re-entrant activation patterns in cardiac tissue are believed to underlie ventricular tachycardia and ventricular fibrillation. In thick ventricular myocardium, functional re-entrant activity is organized as a scroll wave rotating around a singularity line called a filament (Medvinsky et al. 1984; Winfree 1994). Where filaments terminate at the tissue surface, activation patterns reveal distinguishable rotating activation wave fronts around the filament. However, filaments are dynamic and non-linear and their trajectories are not strictly transmural. Therefore, the main body of the filament, which is intramural, commonly runs obliquely or parallel to the tissue surface (Gray et al. 1996). Often a center of rotation is not observed at the surface and activation patterns generally occur as breakthroughs and/or planar waves emerging from the edges of the mapped region (Chen et al. 1988; El-Sherif et al. 1996; Frazier et al. 1989; Gray et al. 1998; Janse et al. 1980; Pogwizd and Corr 1990; Witkowski et al. 1998), characteristic of intramural scroll waves with filaments located deeper in the myocardium. For a more detailed description of scroll waves and arrhythmias, see Chaps. 13 and 14.
Scroll wave filaments are thought to be the drivers of lethal ventricular arrhythmias. Visualizing and locating these filaments is therefore key to a better understanding and treatment of SCD. The filaments have various shapes and orientations and can also drift within the myocardium. Identifying and locating an intramural scroll wave filament is often challenging, particularly when limited to mapping the tissue surface. Transillumination imaging has been shown to allow visualizing filaments located intramurally that would otherwise go unnoticed with epi-fluorescence (Baxter et al. 2001). More recently, new image processing techniques were proposed to directly visualize intramural scroll wave filaments by Bernus et al. (2007) who proposed three approaches based on computer simulations of intramural scroll waves in ventricular slabs: (1) amplitude maps; (2) time-space plots and (3) power-of-dominant-frequency maps (Fig. 16.4).
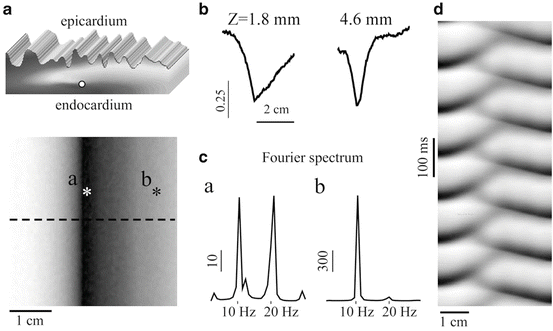

Fig. 16.4
Transillumination imaging of intramural scroll waves. (a) Epicardial amplitude map (bottom) showing a region of low amplitude directly above the intramural scroll wave’s location (top—filament position indicated by the white disk). (b) Amplitude profiles along the dashed line in panel a for two different depths Z of the intramural filament. (C) Power spectra obtained directly above (point a in panel a) and away from the filament (point b). (d) Time-space plot along the dashed line in panel a. Modified from Bernus et al. (2007)
Amplitude maps provide the maximal amplitude of the optical signal throughout a single activation cycle. It was shown that filaments can be identified as the minimum in the amplitude maps due to the unexcited core around which a scroll wave rotates (in other words no fluorescence is produced in the core or filament of a scroll wave). Amplitude maps were successful in determining the in-plane location of filaments positioned at a range of 1.8–4.6 mm depth from the imaged surface. Time-space plots show the spatiotemporal dynamics of electrical activity along a profile. A profile perpendicular to the filament plotted against time reveals the rotating excitation gives rise to a zigzag pattern with two mutually phase-shifted branches either side of the filament, which is a signature of rotating waves. The intersection of the phase-shifted portions of the plots indicates the location of the filament. Finally, power-of-dominant-frequency analysis revealed reduced power of the dominant frequency component along the filament compared to distant regions of the tissue. A filament depth-dependent second harmonic at twice the dominant frequency was also observed exclusively along filaments. A second harmonic was attributed to dual humped action potentials recorded above the filament due to the optical integration volume being excited twice, superficial and deep to the filament, during each activation cycle. This property had originally been observed and described in epi-fluorescence recordings of VT in rabbit hearts by Efimov et al. (1999).
While the approaches proposed by Bernus et al. (2007) do not strictly reconstruct the depth of the filament, they infer their locations within the imaging plane. Amplitude mapping requires however that the filament remains stable for at least one cycle and the power-of-dominant-frequency approach must analyse frequency over multiple activation cycles and therefore requires highly stable filaments over longer periods of time. Conversely, time-space plotting enables tracking of the spatiotemporal dynamics of meandering filaments. Interestingly, it was found that absorptive transillumination, rather than fluorescence transillumination, would yield the highest depth penetration. Transillumination enables identification and localization of intramural filaments, whereas surface mapping would only reveal surface breakthrough activity.
3.2 Near-Infrared Optical Mapping
Conventional voltage-sensitive dyes such as the styryl dye, Di-4-ANEPPS, have been used successfully for optical mapping in cardiac cells and near-surface electrical activity in the myocardium. However, their utility for probing at deeper layers in the myocardium has been limited due to light scattering and absorption by endogenous chromophores at blue-green excitation wavelengths. An emergence of novel voltage-sensitive dyes with absorptive properties in the near infrared (NIR) range has pushed depth-resolved optical mapping to new bounds. A range of such dyes were developed (Matiukas et al. 2006, 2007), the most effective being DI-4-ANBDQBS, which has low susceptibility to photobleaching, internalization or phototoxicity and relatively strong signal-to-background ratios (10–15 %). These NIR dyes were developed in order to overcome enhanced scattering and absorption conditions in blood-perfused tissue, due to the presence of hemoglobin, which strongly absorbs green light so that even conventional surface recordings are difficult to obtain (Huizar et al. 2007). The absorption spectra of NIR dyes are shifted towards the red beyond the absorption maxima of hemoglobin and therefore improve significantly both transillumination and reflected fluorescent signals in blood-perfused tissue (Matiukas et al. 2007). In addition, NIR dyes allow for better transillumination signals, which are orders of magnitude smaller than epi-fluorescence signals in the blue-green excitation range (Baxter et al. 2001). The absorption spectra of NIR dyes are shifted towards the red beyond the absorption maxima of hemoglobin and therefore improve significantly both transillumination and reflected fluorescent signals in blood-perfused tissue (Matiukas et al. 2007). In addition to imaging blood-perfused preparations, NIR dyes have applications in saline-perfused myocardium. Shifting excitation light from green to red increases transmittance through cardiac tissue by more than an order of magnitude (Van Gemert et al. 1990). Photon penetration of tissue upon uniform illumination of the epicardium with 530 and 660 nm excitation light has been estimated using Monte Carlo photon transport models (Walton et al. 2010). Figure 16.5 shows normalized fluence of photons, i.e. the total number of photons intersecting a unit area in a specific time, as a function of depth for green and red illumination. The peak fluence of green light is observed at the epicardial surface and decays rapidly with depth. Red light however peaks intramurally and shows reduced rates of decay. A lower absorption in the red part of the spectra is accompanied with decreased light scattering. Both factors contribute to improved fluorescent signal-to-background ratios. Attenuation of absorption and light scattering by shifting to the red coincidentally increases the optical integration volume and therefore tissue penetration. Up to 90 % of the total contribution to the optical signal has been estimated to originate from depths of just 0.75 mm using green excitation light, but is extended twofold to 1.55 mm for NIR.
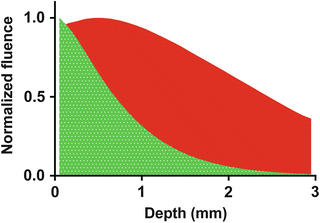

Fig. 16.5
Normalized fluence of excitation photons as a function of depth in tissue for green (532 nm) and red (660 nm) light
4 Towards 3D Optical Imaging of Cardiac Electrical Activity
Thus far in this chapter we have discussed the impact of scattering and absorption on optical recordings, and techniques to increase the depth penetration of optical imaging through the development of novel dyes or application of new imaging modalities such as transillumination. Recently, new techniques have emerged that specifically seek to probe transmural electrophysiological properties by optical means with a view in obtaining 3D information. These methods are described in detail in this section (Fig. 16.6).
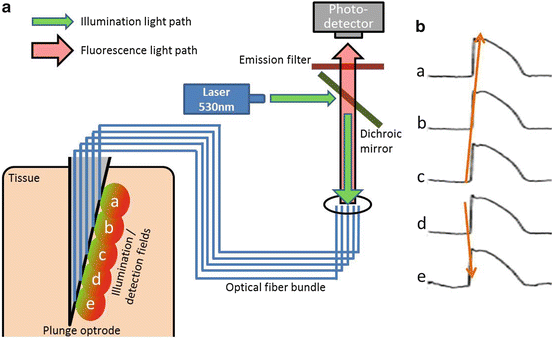

Fig. 16.6
(a) Schematic representation of a multi-channel optrode imaging systems for intramural optical recordings. (b) Optical recordings using a 5-channel optrode showing spread of action potentials from an intramural location (red arrows)
4.1 Optrodes
Enhanced optical integration volumes by imaging using transillumination mode probes electrical activity over deeper layers of the myocardium compared to the epi-fluorescence mode. However, the transmural plane continues to be represented only by a single value. Furthermore, transillumination imaging is not readily applicable to intact hearts. Alternative optical approaches applied to better resolve electrical activity in the transmural plane includes the use of optrodes. These are optical fibers that permit excitation and collection of emission light at multiple localized sites along an insertion needle that may be injected intramurally (Fig. 16.6). Optical recordings may be made at discrete sites along the optrode. Unlike epi-fluorescence or transillumination modalities, optrodes are not limited by the depth of light penetration as excitation light is delivered via the optical fibers directly to the optrode tips to illuminate the myocardium from the same site as fluorescence is detected. Caldwell et al. (2005) assessed the usability of optrodes for measuring optical electrical activity in the ventricles. Due to recording from such discrete localized sites, voltage-sensitive signal-to-noise ratio was typically superior to epi-fluorescent imaging. Moreover, optical AT and repolarization gradients across the ventricular wall reliably reproduced those measured from unipolar electrical recordings at adjacent sites in the myocardium. Optrodes have since been further employed to characterize complex electrical activity transmurally, such as ventricular fibrillation (Kong et al. 2009). However, the drawbacks of optrode recordings echo those of electrical plunge electrode recordings. The spatial resolution in the surface plane is limited to the sites and number of optrodes inserted in to the myocardium and the insertion of needles is in itself a destructive approach.
Stay updated, free articles. Join our Telegram channel

Full access? Get Clinical Tree


