chapter 21 Tracer Kinetic Modeling
The spatial distribution of a radiotracer in the body is time varying and depends on a number of components such as tracer delivery and extraction from the vasculature, binding to cell surface receptors, diffusion or transport into cells, metabolism, washout from the tissue, and excretion from the body. Thus the temporal component often is very important in nuclear medicine studies, and the timing of the imaging relative to the administration of the radiopharmaceutical must be carefully chosen such that the images reflect the biologic process of interest. Furthermore, the rate of change of radiotracer concentration often provides direct information on the rate of a specific biologic process. This chapter discusses how the temporal information that can be obtained from nuclear medicine studies is incorporated to provide quantitative measures of physiologic parameters, biochemical rates, or specific biologic events. Further examples are provided in reference 1.
A Basic Concepts
Dynamic nuclear medicine studies enable the radiotracer concentration to be measured as a function of time, as shown in Figure 20-10. With an understanding of the biologic fate of the radiotracer in the body, it is possible to construct mathematical models with a set of one or more parameters that can be fit to explain the observed time-activity curves. In some cases the model parameters can be related directly to physiologic or biologic quantities. Examples include tissue perfusion (measured in mL /min /g) and the rate of glucose use (measured in mol/min/g). The mathematical models that describe the time-varying distribution of radiopharmaceuticals in the body are known as tracer kinetic models.
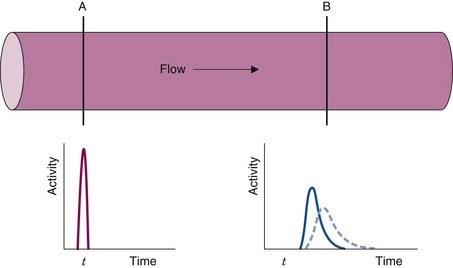
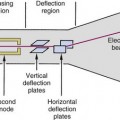
The following example illustrates the principle of tracer kinetic techniques. Figure 21-1 shows a hollow tube with a substance flowing through it. If a small amount of tracer is injected instantaneously at time t and at point A and the measured activity at point B is plotted as a function of time, the resultant time-activity curve represents a histogram of the transit times for the tracer molecules from point A to point B. If the flow rate through the tube is decreased (dashed curve in Fig. 21-1), then the tracer molecules will on average take longer to get from point A to point B and the shape of the measured time-activity curve will change accordingly. This simple example illustrates conceptually how the kinetic information (i.e., the time-activity curve) varies in response to a change in a parameter in the system (flow rate). The flow rate, F, through the tube can be calculated as
B Tracers and Compartments
1 Definition of a Tracer
A tracer is a substance that follows (“traces”) a physiologic or biochemical process. In this chapter, tracers are assumed to be radionuclides or, more commonly, small molecules or larger biomolecules (e.g., antibodies and peptides) that are labeled with radionuclides. These labeled molecules are also known as radiotracers or radiopharmaceuticals. For simplicity, we refer to them as tracers in the remainder of this discussion. Tracers can be naturally occurring substances, analogs of natural substances (i.e., substances that mimic the natural substance), or compounds that interact with specific physiologic or biochemical processes in the body. Examples include diffusible tracers for blood flow, tracers that follow important metabolic pathways in cells, and tracers that bind to specific receptors on cell surfaces. Table 21-1 lists some examples of tracers that are used in nuclear medicine and their applications.
TABLE 21-1 Selected Examples of Tracers Used in Nuclear Medicine
| Process | Tracer |
| Blood flow/perfusion: | |
| Diffusible (not trapped) | H215O, 133Xe, 99mTc-teboroxime (heart) |
| Diffusible (trapped) | 201TlCl (heart), 99mTc-sestamibi (heart), |
| 13NH3 (heart), 82RbCl, 99mTc-ECD (brain), | |
| 99mTc-tetrofosmin (heart), 62Cu-PTSM, 99mTc-HMPAO (brain) | |
| Nondiffusible (trapped) | 99mTc-macroaggragated albumin (lung) |
| Blood volume | 11CO, 51Cr-RBC, 99mTc-RBC |
| Ventricular function | 99mTc-pertechnetate, 99mTc-DTPA |
| Esophageal transit time/reflux | 99mTc-sulphur colloid |
| Gastric emptying | 99mTc-sulphur colloid, 111In-DTPA |
| Gallbladder dynamics | 99mTc-disofenin, 99mTc-mebrofenin |
| Infection | 111In-WBC, 67Ga-citrate, 99mTc-WBC |
| Lung ventilation | 133Xe, 81Kr, 99mTc-technegas™ |
| Metabolism: | |
| Oxygen | 15O2 |
| Oxidative | 11C-acetate |
| Glucose | 18F-fluorodeoxyglucose |
| Free fatty acids | 11C-palmitic acid, 123I-hexadecanoic acid |
| Osteoblastic activity | 99mTc-MDP, 18F– |
| Hypoxia | 18F-fluoromisonidazole, 62Cu-ATSM |
| Proliferation | 18F-fluorothymidine |
| Protein synthesis | 11C-leucine, 11C-methionine |
| Receptor systems: | |
| Dopaminergic | 18F-fluoro-L-dopa, 11C-raclopride, 18F-fluoroethylspiperone, 11C-CFT |
| Benzodiazepine | 18F-flumazenil |
| Opiate | 11C-carfentanil |
| Serotonergic | 11C-altanserin |
| Adrenergic | 123I-mIBG |
| Somatostatin | 111In-octreotide |
| Estrogen | 18F-fluoroestradiol |
ATSM, diacetyl-bis (N4-methylthiosemicarbazone); CFT, [N-methyl-11C]-2-β-carbomethoxy-3-β-(4-fluorophenyl)-tropane; DOPA, 3,4-dihydroxyphenylalanine; DTPA, diethylenetriamine penta-acetic acid; ECD, ethyl cysteinate dimer; HMPAO, hexamethyl propylene amine oxime; MDP, methylene diphosphonate; mIBG, metaiodobenzylguanidine; PTSM, pyruvaldehyde bis(N4-methylthiosemithiocarbazone); RBC, red blood cell; WBC, white blood cell.
Some specific requirements for an ideal tracer include the following:
If a tracer is labeled with an element not originally present in the compound (this is often the case with radionuclides such as 99mTc, 123I, and 18F), it should behave similarly to the natural substance or in a way that differs in a known manner. The strictness of this requirement depends on the process under investigation. One common use of tracers in clinical nuclear medicine is to examine gross function and distribution, including blood flow, filtration, and ventilation. Although the elements represented by radionuclides such as 99mTc, 67Ga, 111In, and 123I are not normally present in biologic molecules, it is possible to incorporate these radionuclides in physiologically relevant tracers that can measure simple parameters that are related to distribution, transport, and excretion.
Analog tracers are compounds that possess many of the properties of natural compounds but with differences that change the way the analog interacts with biologic systems. In many cases, analog tracers are deliberately created to simplify the analysis of a biologic system. For example, analogs that participate through only a limited number of steps in a sequence of biologic reactions have been developed in biochemistry and pharmacology. Analogs are used to decrease the number of variables that must be measured, to increase the specificity and accuracy of the measurement, or to selectively investigate a particular step in a biochemical sequence. In other cases analog tracers are used because of the need to label the tracer with an element that is not normally present in the molecule of interest. As discussed earlier, this can lead to very significant deviations in the biologic properties (particularly in small molecules) compared with the natural compound. Correction factors based on the principles of competitive substrate or enzyme kinetics are employed in studies using analog tracers to account for differences between the analog and the natural compound. A well-known and widely used example of an analog tracer in nuclear medicine is 2-deoxy-2[18F]fluoro-D-glucose (FDG) to measure glucose metabolism (see Section E.5).
3 Distribution Volume and Partition Coefficient
This equation is the basis for the dilution principle, which provides a convenient method for determining the distribution volume of a closed compartment, as shown by the following example.
Answer
More commonly, a compartment will be open; that is, the tracer will be able to escape from it. This applies, for example, to tracers that are distributed and exchanged between blood and tissue. In this case, after the tracer reaches its equilibrium distribution,* the concentration in blood will typically be different from that in the tissue (Fig. 21-2A). The ratio of tissue concentration Ct (Bq/g) to blood concentration Cb (Bq/mL) at equilibrium, is called the partition coefficient, λ, defined by
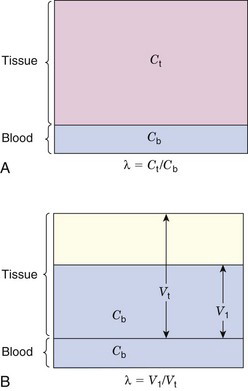
The equilibrium blood concentration, Cb, can be directly measured by taking blood samples. If one assumes that the concentration of tracer in tissue is the same as the concentration in blood (Fig. 21-2B), and applies Equation 21-2, this leads to an apparent distribution volume in tissue given by V1 = At /Cb, in which At is the activity in the tissue. One also knows that At = Ct × Vt, in which Vt is the volume (or mass) of tissue; therefore combining these relationships and Equation 21-3 yields

Thus another interpretation of the partition coefficient is that it is the distribution volume per unit mass of tissue for a diffusible substance or tracer. This interpretation is employed in some models for estimating blood flow and perfusion, as discussed in Section E.
4 Flux
Flux refers to the amount of substance that crosses a boundary or surface per unit time (e.g., mg /min or mol / min) (Fig. 21-3). It also can refer to the transport of a substance between different compartments in terms of flux per unit volume or mass of tissue (e.g., mol /min /mL or mg /min /g).
Flux is a general term that can refer to a variety of processes. For example, the total mass of RBCs moving through a blood vessel per unit time is a flux. The “boundary” or “surface” in this case could be any transverse plane through the vessel. The amount of glucose moving across a cell membrane per unit time also is a flux. Fluxes therefore may either be closely related or unrelated to blood flow.
5 Rate Constants

For first-order processes, the units of k are (time)–1. If “amount” refers to the mass of tracer in the compartment, the units of flux are mass/time (e.g., mg/min). If “amount” refers to concentration of tracer in the compartment, the units of flux are mass/time per unit of compartment volume (e.g., mg/min/mL), or mass/time per unit of compartment mass (e.g., mg/min/g). Note that, as illustrated by Figure 21-3, different directions of transport between two compartments can be characterized by different rate constants.
Thus the fractional rate constant k is analogous to the decay constant λ for radioactive decay, whereas the mean transit time is analogous to the average lifetime of a radionuclide (see Chapter 4, Section B.3). In first-order models, transport out of a compartment through a single pathway (without back-transport) is described by a single exponential function, e–kt, analogous to the radioactive decay factor e–λt.
where m is the number of pathways by which the tracer can leave the compartment.
Most compartment models used in nuclear medicine are based on the assumption that first-order kinetics describe the dynamics of the system of interest. The tracer kinetics of such systems are linear. That is, doubling the input (amount or concentration) doubles the output (flux) of the system. As shown in Section E, linear first-order tracer kinetic models adequately describe many systems even when the dynamics of the natural substances are nonlinear.
A more general expression for the relationship among rate constants, fluxes, and concentrations (or masses) is

where n refers to the order of the reaction. The units of rate constants for nth order reactions (in terms of concentration) are [concentrations(1—n) • time–1]. Thus only first-order rate constants represent a constant fractional turnover and Equations 21-6 and 21-7 apply only to first-order processes.
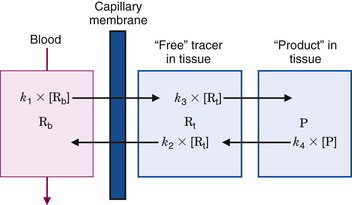
Figure 21-3 illustrates a three-compartment system consisting of a blood compartment separated by a membrane barrier (e.g., capillary wall) from two sequential tissue compartments. R and P refer to chemical reactant and product, whereas the subscripts b and t refer to reactant in blood and tissue compartments, respectively. [Rb],* [Rt], and [P] are the blood and tissue concentrations of reactant and product, whereas the fluxes between the compartments are the first-order rate constants, k1, k2, k3, and k4, multiplied by corresponding concentrations. The thicknesses of the arrows in Figure 21-3 are proportional to the magnitude of the corresponding rate constant. In this example, the rate constants into and out of tissue are larger than the corresponding rate constants between the reactant and product compartments in tissue. Thus the majority of the reactant initially transported into the tissue space is transported back into blood without undergoing any biochemical reactions. This is a common occurrence in actual biochemical systems and introduces a reserve capacity into the system that can accommodate changes in metabolic supply and demand (e.g., by changing k3).
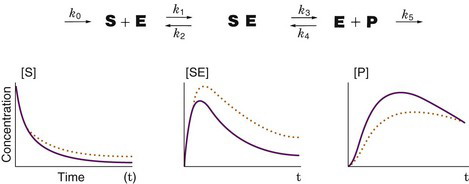
Figure 21-4 illustrates the relationship between first-order rate constants and the relative concentrations of the substrates in a biochemical sequence. If a substrate (S) and enzyme (E) combine to form a substrate-enzyme complex (SE), which then dissociates into a product (P) with release of the enzyme, the fluxes of the first-order reaction steps are concentrations multiplied by the corresponding rate constants. If a small amount of labeled substrate is introduced into the system at time zero, the tracer will go through the reaction steps, producing concentrations of labeled S, SE, and P as shown in the graphs in Figure 21-4. If k3 (the forward rate constant for the reaction converting SE to E and P) is reduced by 50% with all the other rate constants remaining unchanged, the concentrations of labeled S, SE, and P are then represented by the dotted orange lines in Figure 21-4. Decreasing k3 causes a slower production of P and causes a compensatory increase in labeled S and SE.
6 Steady State
The term steady state refers to a condition in which a process, parameter, or variable is not changing with time. For example, a flux through a biochemical pathway is said to be in a steady state when the concentration of reactants and products are not changing with time. In all tracer kinetic models, it is assumed that the underlying process that is being measured by the tracer is in a steady state. Because of biorhythms, steady states almost never exist in the body; however, if the magnitude or temporal period of change is small compared with the process being measured, then the steady-state assumption is reasonable. In many cases, the experimental sampling rate is slow compared with the biorhythm (e.g., blood sampling rate vs. pulsatile nature of blood flow) and it is not perceived in the measured data. In these cases, the measured parameters represent average values of the function measured. However, if the experimental sampling rate is fast compared with the biorhythm, significant errors can be introduced in the model calculations. In this case, the calculated parameters typically do not represent a simple average of the non-steady-state values.
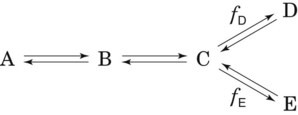
An important and useful property of a steady-state condition is that the rates (fluxes) of all steps in a nonbranching transport or reaction sequence are equal. Thus if a tracer technique is used to measure one step in a sequence, the rate for each step in the entire sequence can be determined. If the reaction branches into two or more separate pathways then the sum of each pathway must equal the rate of the preceding step. In this case, if one determines the rate of any of the preceding steps and also knows the branching fractions, then the rate of each branch can be determined by multiplying the rate of the preceding step by the branching fraction. For example, if the reaction sequence in Figure 21-5 is in a steady state and the rate of disappearance of A is RA, the rates of formation of B, C, D, and E are RB, RC, RD, and RE, respectively, and fd and fe are the branching fraction down the corresponding pathways, then
C Tracer Delivery and Transport
1 Blood Flow, Extraction, and Clearance
Blood flow through vessels is described in units of volume per unit time (usually in units of mL /min). For regional tissue measurements it is blood flow per mass of tissue that is determined (mL /min /g). Blood flow per mass of tissue is more properly referred to as perfusion; however, in the literature the term blood flow is used to indicate both blood flow and blood flow per mass of tissue. In both cases the basic phenomenon is still blood flow. Thus relationships involving blood flow apply equally to blood flow and perfusion, provided that care is taken to ensure that the units are consistent. For example, in the relationship between blood flow and blood volume (see Section E.4), if blood flow is in units of mL / min, then blood volume must be in units of mL. If blood flow is in units of mL /min /g, then blood volume must be in units of volume per mass of tissue (mL /g). In this text, the term blood flow, symbolized by F, is used to denote either blood flow or blood flow per mass of tissue. The units indicate which quantity is being discussed.
Unidirectional extraction refers to the amount of tracer extracted only from blood to tissue. It does not include the amount transferred back from tissue to blood. Thus the unidirectional extraction fraction, Eu, generally is larger than the net extraction fraction. An exception to this general rule occurs with O2. Virtually all oxygen extracted by tissue is metabolized; thus the net and unidirectional extraction fractions are the same. For essentially all other substances, a major portion of what is extracted by the tissue is transported back to blood. This is the situation represented by the bidirectional transport in the model shown in Figure 21-3.
As an example, if the arterial and venous concentrations of oxygen and the blood flow to an organ are measured, Equation 21-14 can be used to determine the oxygen utilization rate for that organ. If blood flow F in Equation 21-14 is replaced by blood flow per mass of tissue (perfusion), then the uptake or utilization is given in units of utilization per mass of tissue (mg/min/g).
Stay updated, free articles. Join our Telegram channel

Full access? Get Clinical Tree


