Fig. 1
Development of time-stretch imaging in ultrafast microparticle and single-cell imaging in microfluidic flow. (a) An ultrafast microfluidic flow of water-suspended metal microspheres (sphere diameters ranging from 10 to 30 μm) was established in a hollow fibre with an inner diameter of 50 μm. On the left, one out of every 17 snapshots is shown, for clarity. On the right, consecutive snapshots with the full temporal resolution of 163 ns and shutter speed of 440 ps are shown [6]. (b) Performance of the time-stretch microscopy at 1.5 μm and the comparison with a conventional CCD camera and a state-of-the-art CMOS camera [7]. (c) A new generation of time-stretch imaging, called ATOM, capturing images of label-free chondrocytes and osteoblasts at 1.0 μm, a wavelength window more favorable for biological imaging. Internal details of individual cells can be clearly revealed, e.g., nucleus and vesicle-like structures. ATOM can also provide two different image contrasts simultaneously, namely absorption and differential phase-gradient contrasts (see the text for details). The arrows indicate the flow direction of the cells (at a speed on the order of m/s). Scale bars represents 20 microns
1.1 Asymmetric-Detection Time-Stretch Optical Microscopy
Time-stretch microscopy had mostly been operated in bright-field (BF) imaging mode in the longer wavelength range (~1500 nm), and is thus incapable of revealing high-contrast and high-resolution morphology of the transparent cells—hindering accurate cell recognition and screening. As a result, effective use of time-stretch imaging had been limited to microparticle or cell screening in high-speed flow with trivial size and shape differences, especially when the targeted cells are labeled with contrast agents [6, 7]. Similar to the classical optical imaging modalities, the time-stretch image quality, which is typically characterized by image resolution and image contrast, is still compromised by the higher imaging speed. To enlarge the scope of time-stretch imaging applications, particularly in biomedical diagnostics, we have recently introduced a new generation of time-stretch imaging, dubbed ATOM, for obtaining label-free, high-contrast images of the transparent cells at ultrahigh speed, and with sub-cellular resolution.
ATOM relies on the same spectral-encoding strategy as its BF time-stretch imaging counterpart. The key difference is that ATOM generates the enhanced phase-gradient contrast in the time-stretch image based on a simple asymmetric detection scheme after the spectral-encoding step (see Fig. 4). The phase-gradient contrast results in three-dimensional (3D) appearance in the image, resembling the contrast-enhancement effect in Schlieren imaging [8]. Moreover, by time-multiplexing two ATOM images with opposite phase-gradient contrasts, we further obtain two different contrasts from the same specimen: one with differential (enhanced) phase-gradient contrast and another with absorption contrast, simultaneously (Fig. 2). This method decouples the phase-gradient information from absorption, resulting in further enhancement of the image contrast. Together with operating in the 1 μm wavelength regime, a more favorable spectral window for biophotonic applications as opposed to the telecommunications wavelength band (~1500 nm) used by most of the previously reported time-stretch imaging systems, the ATOM system is able to achieve higher diffraction-limited resolution and high-contrast cellular time-stretch imaging. Similar to the original time-stretch imaging, the detection sensitivity in ATOM is not compromised by the high-speed operation because of the in-line optical image amplification—a feature rarely implemented in typical optical microscopy. We have demonstrated the unique capability of ATOM in visualizing the detailed cellular morphology (e.g. normal human blood cells from fresh blood and human leukemic monocytes) without contrast agent in ultrafast microfluidic flow (up to ~10 m/s), which is yet to be demonstrated in the existing time-stretch imaging modality (Fig. 2) [8]. The achieved flow speed here is equivalent to an imaging throughput of ~ 100,000 cells/s. ATOM thus represents a significant advancement in bringing the essential imaging metrics—high resolution and high contrast—to high-speed time-stretch imaging, making it a genuinely appealing platform for realizing high-throughput image-based cellular assays.
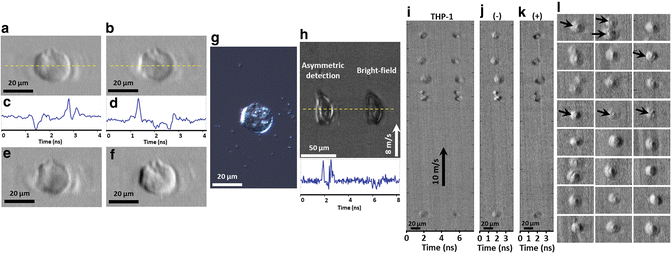
Fig. 2
High-contrast and dual-contrast cellular imaging in flow by ATOM. (a, b) Two single-angle ATOM images of a normal hepatocyte (MIHA) fixed on a glass slide, which show the opposite phase-gradient contrasts, respectively. (c, d) The corresponding line profiles (yellow dotted lines) of the single-angle ATOM images in a, b, respectively. Each line scan of the image is captured within ~4 ns. (e) By calculating the sum of the two single-angle ATOM images (i.e., a + b), an image with absorption contrast can be revealed. (f) Dual-angle ATOM image with differential (enhanced) phase-gradient contrast can be obtained by calculating the difference of the two single-angle ATOM images (i.e., a − b). (g) White-light DIC image of the same MIHA cell for comparison. (h) Demonstration of the contrast enhancement in ATOM by comparing the single-angle asymmetric detection scheme (i.e. off-axis fiber coupling) and the bright-field (BF) scheme (i.e. on-axis fiber coupling), in the context of high-speed flow imaging (8 m/s) of the MIHA cells in a PDMS microfluidic channel. In the time-multiplexed ATOM image, it shows the image replica of the same cell, as if they are flowing in parallel: one is captured by asymmetric detection (left) whereas another is captured by on-axis detection, i.e., BF time-stretch image (right). The bottom inset is the corresponding line profiles (yellow dotted lines) of ATOM image and BF time-stretch image shown. Note that in one single-shot line-scan, both phase-gradient and BF contrasts of the same cell are captured within ~8 ns. (i) Time-multiplexed single-angle ATOM images of the stain-free THP-1 cells flowing at a speed of 10 m/s. (j) Dual-angle (differential) ATOM image obtained by subtraction of the two opposite-contrast images (the left and right group of cells) in (i). (k) Dual-angle (absorption) ATOM image obtained by addition of the two opposite-contrast images (the left and right group of cells) in (i). More dual-angle (differential) ATOM images of THP-1 cells are shown in (l). The enhanced contrast enables visualization of the nuclei of the cells (indicated by the arrows)
1.2 Interferometric Time-Stretch Microscopy
The functional and structural information of the biological cells and tissues can commonly be inferred by the correlated image contrasts. While exogenous fluorescent labels are the well-acclaimed and thus the prevalent contrast agent used in many applications, they are however not always ideal in view of the complication introduced by cytotoxicity and photobleaching. In contrast, endogenous image contrast, e.g., absorption and scattering, could sometimes serve as the effective intrinsic biomarker without the need for label or stain and the associated laborious sample preparation procedures. Among different label-free optical imaging modalities, quantitative phase-contrast imaging (QPI) is proven to be an effective approach to scavenge different useful intrinsic information about the cells and tissues. By mapping the optical phase shift across the transparent cells or tissues, QPI can provide not only high image contrast non-invasively, but also quantitative evaluation of cellular information (e.g., cell volume, mass, refractive index, stiffness, membrane tension) at nanometer scale based on the optical phase [14, 15]. The scattering properties of the cells/tissues can also be extracted from the optical phase [16–19]. All information derived from QPI can then be used as the intrinsic biomarkers for cellular identification and understanding the corresponding physiological information, such as disease state of cells/tissues. Notably, refractive index of cell nuclei serves a distinct indicator for label-free detection of cancer cells with high sensitivity [20, 21].
Motivated by that time-stretch imaging is intrinsically compatible with label-free phase-contrast imaging, it has been demonstrated iTS microscopy for quantitative phase contrast tissue and cellular imaging at an ultrahigh imaging scan rate as high as tens of MHz, with nanometer precision [13, 15]. Again, iTS microscopy employs the same spectral-encoding imaging scheme as ordinary BF time-stretch imaging. The key difference is that an additional interferometer (e.g., Michelson interferometer) is required in iTS microscopy such that the spectrally-encoded pulsed beam from the sample arm is interfered with its uncoded replica from the reference arm. The interfered pulses then undergo optical time-stretch which generates the temporal interferograms. The quantitative phase information can then be extracted from the interferograms by the phase-retrieval and unwrapping algorithms routinely used in classical QPI (e.g., Goldstein’s algorithm) (Fig. 3). It should be emphasized again that the quantitative phase information has long been known as valuable biomarkers of label-free cellular bioassay [13]. However, the use of these intrinsic biomarkers for large-scale screening has almost been impossible because of the limited imaging throughput of the existing technologies.
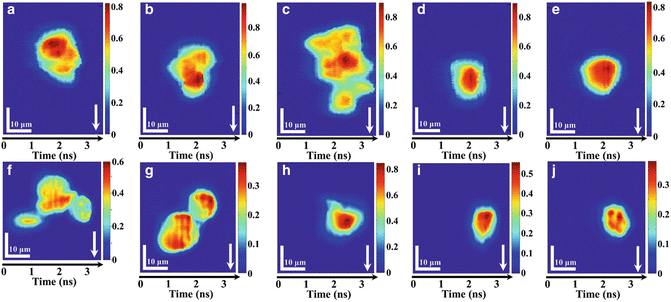
Fig. 3
Imaging of mammalian cells by iTS microscopy in ultrafast flow: (a–e) iTS microscopic images of stain-free HeLa cells flowing at a speed of 8 m/s. (a–c) Clusters of HeLa cells can be easily distinguished under iTS microscopy with subcellular resolution (~1.2 μm). (d–e) Single HeLa cells flowing at ultrahigh speed. (f–j) iTS microscopic images of stain-free MIHA cells flowing at a speed of 0.4 m/s. (f–g) Clusters of MIHA cells can be easily distinguished under iTS microscopy with subcellular resolution. (h–j) Single MIHA cells flowing at 0.4 m/s. All color bars represent the phase in radian. Arrows indicate the flow direction
2 Materials and System Preparation
In general, a time-stretch imaging system consists of three main modules: a broadband pulsed laser source, a spectral-encoded imaging module and a time-stretch module (Fig. 4). This configuration essentially refers to the BF imaging mode of time-stretch imaging. In this chapter, we focus on two other imaging modalities: ATOM and iTS microscopy, each of which has an additional module in the system. In ATOM, an asymmetric-detection module is added to enable enhanced dual contrast of the images. In iTS microscopy, an interferometer module is inserted to obtain the quantitative phase information of the image (see Fig. 4). In this section, we describe the enabling components required for each of these modules.
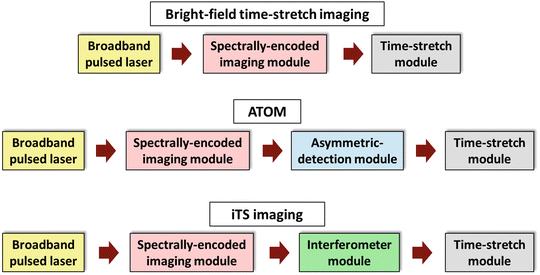
Fig. 4
Generic schematics of the BF time-stretch, ATOM, and iTS imaging configurations
2.1 Equipment and Materials for Microfluidic Chip Fabrication
In both ATOM and iTS microscopy, cellular imaging is performed in the microfluidic platform. Here below are the key materials and equipment for microfluidic channel fabrication:
1.
Polydimethylsiloxane (PDMS).
2.
Silicon wafer.
3.
Incubator (Thermo Scientific, Heratherm, IGS60).
4.
Expanded plasma cleaner (Harrick Plasma, PDC-002).
5.
Cover slips.
6.
Polymethyl methacrylate (PMMA).
7.
Maskless soft lithography machine (Intelligent Micro Patterning, LLC SF-100 XCEL).
8.
Photoresist (MicroChem Corp. SU-8 2025).
9.
Spin coater (Apex Instruments Co. spin NXG-P1).
10.
Hot plate (IKA, C-MAG HP 7).
11.
SU-8 developer.
12.
Isopropyl alcohol.
13.
PDMS precursor (SYLGARD 184 Silicone Elastomer): 18 g Sylgard 184 Silicone elastomer oligomer and 2 g cross-linker were mixed together by an agitator.
14.
Biopsy punch (Miltex 33-31AA).
15.
Plastic tubing (Scientific Commodities, Inc. BB31695-PE/2).
2.2 Essential Components for Spectral Encoding in Both ATOM and iTS Systems
As described in Subheading 1, spectral-encoding is the step in which the spatial information of the cells is optically encoded into the wavelength spectrum of the laser pulse. Here below is the list of the key components for configuring this module:
1.
A broadband pulsed laser, which is preferably to be optical fiber-based laser, e.g., mode-locked fiber laser, or supercontinuum (SC) fiber laser, for the sake of system compactness, in contrast to the use of the bulky solid-state pulse lasers (e.g., Ti:Sapphire laser, or Nd:YAG laser).
2.
Fiber collimator ×2.
3.
Beam splitter ×1.
4.
Diffraction grating ×1.
5.
Objective lens ×2.
6.
Mirror ×1.
7.
Compatible kinematic mounts, post holders, and posts for assembling the optics stated in items 1–6.
2.3 Essential Components for Enabling ATOM Operation
The following components are required for setting up the asymmetric detection module of the spectrally-encoded optical pulsed beam:
1.
Beam splitter ×1.
2.
Several mirrors for beam propagation alignment.
3.
Knife edge.
4.
Fiber collimator ×2.
5.
Linear translation stage ×2.
6.
Fiber coupler ×1.
7.
Compatible kinematic mounts, post holders, and posts for assembling the optics stated in items 1–6.
2.4 Essential Components for Enabling iTS Operation
These are the components required for constructing a Michelson interferometer of the iTS microscope. The input beam to the interferometer is spectrally-encoded with the spatial information of the specimen:
1.
Linear translation stage ×1.
2.
Several mirrors for optical beam propagation alignment within the interferometer.
3.
Compatible kinematic mounts, post holders, and posts for above optics.
2.5 Key Components for Time-Stretch Operation
These are the components to perform wavelength-to-time mapping of the spectrally-encoded image data (either the ATOM or iTS signal) and thus enable ultrafast image capture:
1.
Optical fiber module for time-stretch (with a total GVD value such that the spatial resolution is limited by the diffraction limit, but not by the dispersion process nor the electronic bandwidth of the detection.)
2.
A multistage optical fiber amplifier with a total gain high enough to compensate the loss due to dispersion (see Note 4.1.5 ).
3.
High-speed single-pixel photodetector (8 GHz, Picometrix).
4.
A real-time oscilloscope with a recommended sampling rate greater than 10 GS/s and electrical bandwidth more than 10 GHz (e.g., Agilent, 16 GHz, 80 GS/s) or any high-speed data-acquisition (DAQ) system with high sampling rate of >10 GS/s).
3 Methods
3.1 Construction of the Spectral-Encoded Imaging Module
The general schematic of a spectral-encoded imaging module is shown in Fig. 5. A fiber-based pulsed laser (see Note 4.1.10 ) is first launched to free space from a fiber collimator and passes through a beam splitter and then a diffraction grating (e.g., a transmission holographic grating as shown in Fig. 5) to perform spatial dispersion. This generates a one-dimensional (1-D) line-scan beam called, spectral shower. This spectral shower maps different wavelengths of the light source into 1-D spatial coordinates. It is then focused by an objective lens for illumination. Another identical objective lens and a mirror are added behind the sample in order to operate spectral-encoding imaging in a double-pass transmission mode, which is favorable especially for transparent biological cells in flow. The double-passed spectral shower that encodes the spatial information of the sample, is then restored back to original pulsed beam by the same grating. This encoded pulsed beam is then routed by the same beam splitter toward the optical fiber through a fiber collimator. With the above settings, the sample information is now mapped into the spectrum of the pulsed laser, which can be detected using any ordinary optical spectrometer to perform spectral-encoding imaging. However, a time-stretch module is employed for high-speed “readout” of encoded wavelength spectrum in time domain, which is introduced in Subheading 3.2.
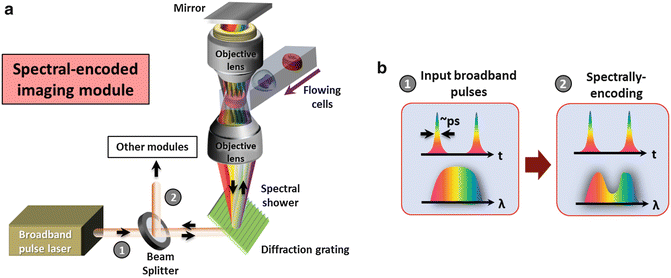
Fig. 5
(a) Schematic of the spectrally-encoded imaging module in time-stretch imaging. (b) Evolutions of the wavelength spectrum and the temporal waveforms in spectrally encoded imaging
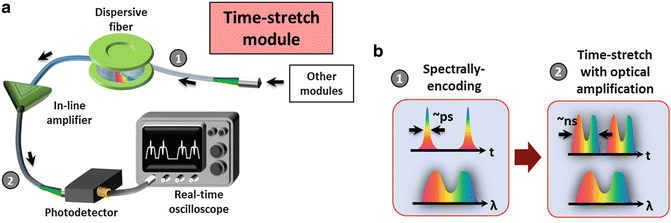
3.2 Construction of the Time-Stretch Module
After all the aforementioned imaging techniques (BF, ATOM, or iTS), a spectrally-encoded pulse can be detected in an ultrafast manner with the use of a time-stretch module. The spectrally-encoded light pulse is coupled into the dispersive fiber in which the encoded wavelength spectrum information is transformed into a serial temporal waveform by the process of GVD. The time-stretch signal is also amplified by an in-line fiber-based optical amplifier (see Note 4.1.5 ) in order to compensate the optical loss due to free-space coupling as well as the fiber attenuation. Without such optical (image) gain, the time-stretch signal could be too weak to be detectable. Finally, the signal is detected by a high-speed photo-detector and a real-time oscilloscope or any real-time DAQ system (Fig. 6).
 Quantitative Functional Morphology by Imaging Flow Cytometry
Principles of Amnis Imaging Flow Cytometry
Quantitative Functional Morphology by Imaging Flow Cytometry
Principles of Amnis Imaging Flow Cytometry
 Detection and Characterization of Rare Circulating Endothelial Cells by Imaging Flow Cytometry
 Assessment of Granulocyte Subset Activation: New Information from Image-Based Flow Cytometry
 Accurate Assessment of Cell Death by Imaging Flow Cytometry
 Screening for Drugs Against the Plasmodium falciparum Digestive Vacuole by Imaging Flow Cytometry


Related posts:
Quantitative Functional Morphology by Imaging Flow Cytometry
Principles of Amnis Imaging Flow Cytometry
Detection and Characterization of Rare Circulating Endothelial Cells by Imaging Flow Cytometry
Assessment of Granulocyte Subset Activation: New Information from Image-Based Flow Cytometry
Accurate Assessment of Cell Death by Imaging Flow Cytometry
Screening for Drugs Against the Plasmodium falciparum Digestive Vacuole by Imaging Flow Cytometry
Stay updated, free articles. Join our Telegram channel
Full access? Get Clinical Tree
