norm [3] and  norm [4] of partial field derivatives; using complex-valued random Markov field [5] and using regularizing conditions [6].
The aim of this work is to compare graph-cut and regularization based unwrapping methods and to analyze the influence of the cross-frame correlation on the unwrapping result. The comparison uses the generated test data set. The article starts with the Sect. 2 on the suggested CDFM test data generation; it is followed by a short Sect. 3 the filtering procedure for the CDFM data [7]; the cross-frame unwrapping methods are described in the Sect. 4; the article is finished with the experimental results and conclusions.
2 CDFM Test Data Generation
It is impossible to obtain real CDFM data with the precise knowledge of the blood flow dynamics to verify the unwrapping results. Thus, to compare the quality of phase unwrapping methods we generated artificial ultrasound slices. The goal of the modeling was to simulate the color Doppler flow artifacts and the model does not give the flow model possible to be used for other tasks. The used parameters give a realistic model of CDFM data wrapping.
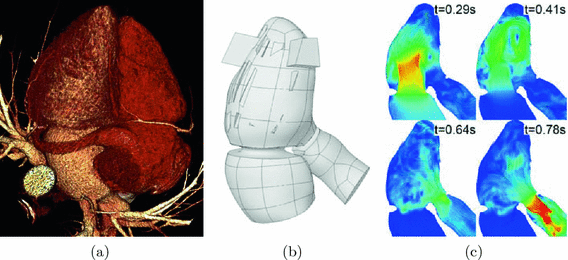
We used a real patient series of 250 CT slices with 0.6 mm resolution at XY and 0.45 mm at Z to build a 3D heart model (see Fig. 1(a)). A surface of the inner border of the left ventricle, left atrium and beginning of the aorta were extracted as a hounsfield isosurface using marching-cubes algorithm [8]. Than the polygonal mesh was transformed to a set of parametric surfaces. 25 vertical volumetric stripes were cut from the ventricle to imitate papillary muscles. The heart geometry was static for the flow calculations, therefore additional open areas were added in the apex of the ventricle to let the redundant blood exit and enter the chamber during the systole and diastole (see Fig. 1(b)).


Fig. 1.
Model of heart: (a) anatomical volume rendering of CT slices, (b) heart model, (c) different time moments of cardiac cycle flow.
ANSYS CFX 15.0 was used for blood flow modeling. The blood was set as a Newton liquid with density  and viscosity
  . These parameters correspond to normal blood parameters [9]. The Reynolds number is about 25000, therefore laminar and Reynolds-Averaged Navier-Stokes (RANS) models are not suitable for this case [10] (pp. 292–303). Thus, Large Eddy Simulation turbulent model (LES) was used in our approach to take into account small vortices [10] (pp. 277–291). The finite element mesh was regular with the element size
  , in total 2400881 elements. 7 total heart cycles (1 s each cycle) were simulated. The
  time step was selected (in total 14000 steps) to satisfy the Courant number less than 1 [11]. Inflow and outflow with the sine-form shape
  duration and
  peak velocity were used.

 and viscosity
  . These parameters correspond to normal blood parameters [9]. The Reynolds number is about 25000, therefore laminar and Reynolds-Averaged Navier-Stokes (RANS) models are not suitable for this case [10] (pp. 292–303). Thus, Large Eddy Simulation turbulent model (LES) was used in our approach to take into account small vortices [10] (pp. 277–291). The finite element mesh was regular with the element size
  , in total 2400881 elements. 7 total heart cycles (1 s each cycle) were simulated. The
  time step was selected (in total 14000 steps) to satisfy the Courant number less than 1 [11]. Inflow and outflow with the sine-form shape
  duration and
  peak velocity were used.
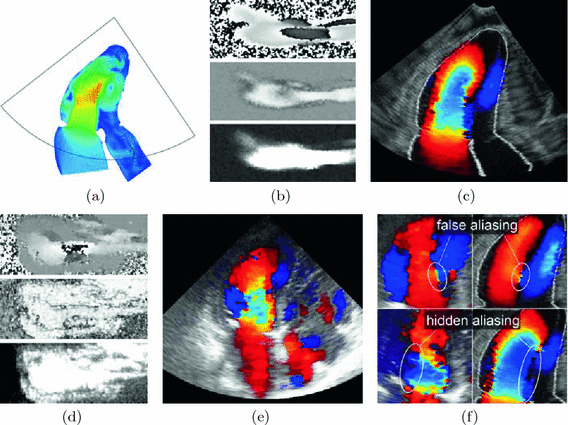
Fig. 2.
(a) selected plane and area of virtual US scan for  , (b) generated fields, top to bottom: real phase F, amplitude A, power P, (c) artificial color Doppler flow mapping image, (d) real image fields, (e) real ultrasound Doppler image, (f) false aliasing and hidden aliasing artifacts for real (left) and artificial (right) series.
 , (b) generated fields, top to bottom: real phase F, amplitude A, power P, (c) artificial color Doppler flow mapping image, (d) real image fields, (e) real ultrasound Doppler image, (f) false aliasing and hidden aliasing artifacts for real (left) and artificial (right) series.
For the calculated flow streams (see Fig. 1(c)) a single 2D-plane was fixed and virtual US scans of a convex probe were simulated. The scanning plane imitated the 3-chamber probe position (see Fig. 2(a)). The 3-chamber view position is the most challenging for the unwrapping task because it shows peak blood velocities for both inflow and outflow. Frame rate was limited to  (total 100 frames per 7 cycles) It is a typical frame rate for real Doppler investigation. 5 different virtual pulses were modeled for each beam direction. Real phase F, amplitude A and power P (see Sect. 3) were constructed with the resolution 80 beams and 200 pixels per beam (see Fig. 2(b)). Artificial color Doppler flow image was generated (Fig. 2(c)) with the following added distortions corresponding to the real probe conditions: random shift of a measured point with maximum displacement
  , region averaging, 7 dB white noise and velocity wrapped to
 ![$$[-0.5, 0.5]\ \mathrm{m/s}$$](/wp-content/uploads/2016/09/A339585_1_En_31_Chapter_IEq12.gif) .
.
 (total 100 frames per 7 cycles) It is a typical frame rate for real Doppler investigation. 5 different virtual pulses were modeled for each beam direction. Real phase F, amplitude A and power P (see Sect. 3) were constructed with the resolution 80 beams and 200 pixels per beam (see Fig. 2(b)). Artificial color Doppler flow image was generated (Fig. 2(c)) with the following added distortions corresponding to the real probe conditions: random shift of a measured point with maximum displacement
  , region averaging, 7 dB white noise and velocity wrapped to
 ![$$[-0.5, 0.5]\ \mathrm{m/s}$$](/wp-content/uploads/2016/09/A339585_1_En_31_Chapter_IEq12.gif) .
.Undistorted images were also stored as a set of phase F fields with the same resolution as noisy fields. This set is a reference data to validate the results of unwrapping methods.
Generated artificial images have all drawbacks inherent to real ultrasonic Doppler scans: phase wrapping, noise, false aliasing and hidden aliasing (see Fig. 2(f)).
3 Complex Phase Restoration
Most of common CDFM systems rely on estimating the rate of phase change of the signal returning from a given sample volume [12]. Scanning transducer estimates phases and amplitudes of the returned echoes. Several impulses (8–16) are formed for better stability. For the blood flow the unwanted clutter signal from solid tissues can exceed the signal from blood by 40–60 dB [13–15] due to rejection of echoes from stationary or nearly stationary tissue. This problem is difficult to resolve in CDFM applications because of the low number of samples available for analysis.
In each image pixel a set of returned signal echoes are given as n complex values  . The power P and complex phase
  can be calculated:
 where A is the amplitude of R and the colorized real phase F is the basic information for the device output blood flow image.
 . The power P and complex phase
  can be calculated:
The use of clutter rejection filters will color the system noise leading to a bias in the mean frequency estimate [16, 17]. The phase for pixels with low power becomes close to a bias value  . This value can be estimated as the mean of complex phases of pixels with the power P less than a threshold
  .
.
 . This value can be estimated as the mean of complex phases of pixels with the power P less than a threshold
  .
.To restore original phase  when the measured phase R, power P and bias point M are known the following equation can be used [7]:
 This preprocessing procedure suppresses the noise so the low velocities become visible and the amplitude becomes more reliable. It results in the better quality of unwrapping methods.
 when the measured phase R, power P and bias point M are known the following equation can be used [7]:
4 Graph-Based Unwrapping Algorithms
As a graph cut based method we used the method based on energy minimization via graph cut described in [2]. In this method the preprocessed amplitude field representing the accuracy of the detected phase is used as a weight function for each edge in the graph. Weights of all edges that are used to realize the energy between two nodes p and q in frames i and j respectively are multiplied by  .
.
 .
.Stay updated, free articles. Join our Telegram channel

Full access? Get Clinical Tree


