Fig. 1.1
Schematic diagram of an ultrasound beam. The primary (main) beam narrows as it approaches the focal zone and then diverges. Grating lobes and slide lobes are both off-axis lobes
Fig. 1.2
Schematic diagram shows the side lobe artifact. The blue beams represent multiple side lobes of ultrasound energy which encounter an object (a single black dot). The display will assume that the echoes returning from this off-axis object have come from the main beam. As a result, the dot will be misplaced and multiplicated in the structure as shown
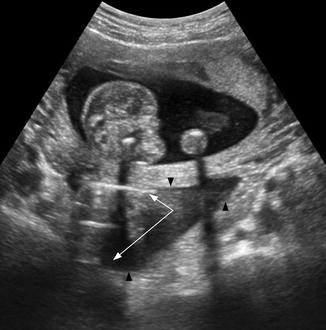
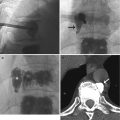
Fig. 1.3
US image shows the grating lobe artifact in which the bowel with reverberation artifacts (white arrows) is misregistered in an anechoic ovarian cyst (black arrowheads) which lies behind a gestational sac
1.2.1.2 Beam Width Artifact
This artifact occurs due to incorrect position of the focal zone (Feldman et al. 2009). A strong reflector located within the widened beam beyond the margin of the transducer will generate detectable echoes (Fig. 1.4). These echoes are assumed to have originated from the narrow imaging plane and are displayed as such. Beam width artifact is typically encountered with spurious echoes displayed in an anechoic area. For example, reflections from bowel generated by the edge of the beam are displayed inside the sagittal view of the urinary bladder where the beam is centered (Fig. 1.5).
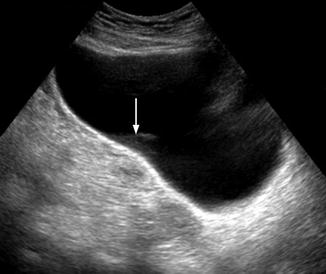
Fig. 1.4
Schematic diagram shows the beam width artifact. The ultrasound image localization software assumes an imaging plane as shown by the dotted lines. Left diagram shows the effect of imaging an object of interest which is not positioned within the focal zone. Echoes from an object located in the peripheral field (black dot) are displaced and seen to overlap the object of interest (white circle). Right diagram shows how this false image is eliminated by adjusting the focal zone so that it corresponds with the object of interest
Fig. 1.5
Beam width artifact (white arrow) in the sagittal US image of the urinary bladder. The reflections from bowel generated by the edge of the beam are displayed inside the sagittal view of the urinary bladder where the beam is centered
1.2.1.3 Slice Thickness Artifact
This is similar to the beam width artifact but occurs due to the thickness of the beam which is 90° to the scan plane (Feldman et al. 2009). The slice of transducer will receive echoes from either side of the intended slice and will be included in the displayed image. These artifacts are displaced in front of and behind the assumed plane of origin. Increasing slice thickness will increase the number of artifactual echoes seen in the display. Slice thickness artifacts are typically seen in transverse views of the urinary bladder when adjacent structures are incorporated into the anechoic urinary bladder fluid (Fig. 1.6).
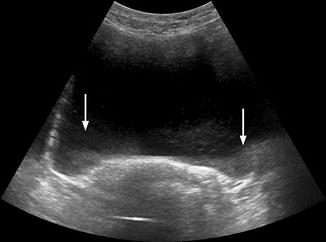
Fig. 1.6
Slice thickness artifact (white arrows) in the transverse US image of the urinary bladder. This artifact is typically seen in transverse views of the urinary bladder when adjacent structures are incorporated into the anechoic urinary bladder fluid
1.2.2 Artifacts Due to Multiple Echoes
1.2.2.1 Reverberation (Comet Tail) Artifact
Multiple reflections (reverberations) can occur between two strong parallel reflectors or between the transducer and a strong parallel reflector (Feldman et al. 2009). The echoes are reflected back and forth repeatedly and may be strong enough to be detected by the instrument and displayed (Fig. 1.7). The spuriously reflected echoes are displayed beneath the real reflector at intervals equal to the distance between the transducer and the real reflector (Gibbs et al. 2009). Each subsequent reflection is weaker than the previous one due to attenuation. Comet-tail artifacts are usually seen in echo-free regions and are short, being less than 2 cm in length. Examples of reverberation artifacts include crystalline deposits of cholesterol in the near wall of the gallbladder, calcification within tissues, or metallic structures. Reverberation artifact may also occur at the anterior peritoneal interface of the abdomen (Fig. 1.8a, b).
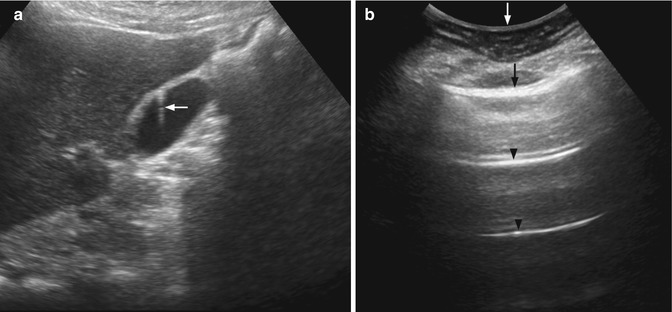
Fig. 1.7
Schematic diagram shows the reverberation artifact. Repeated reflections between two interfaces cause reverberation of the displayed echoes
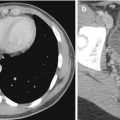
Fig. 1.8
(a) US image shows the comet-tail artifact (white arrow) from cholesterol crystals trapped in an Aschoff-Rokitansky sinus of the gallbladder wall. (b) US image shows reverberation artifacts (black arrowheads) arising between the transducer-skin interface (white arrow) and strongly reflective gas in a bowel loop (black arrow)
1.2.2.2 Ring-Down Artifact
Ring-down (or resonance) artifact has a similar ultrasonographic appearance to comet-tail artifact but is generated by a different mechanism (Feldman et al. 2009). When the transmitted ultrasound beam passes through small gas or fluid bubbles, the energy within the beam causes vibration of the gas or fluid bubbles which, as a result, emit and return sound waves back to the transducer (Fig. 1.9). Discrete echogenic lines or parallel bands of ring-down artifact extend from the point of origin. An example of ring-down artifact can be found with air or fluid in the duodenum (Fig. 1.10).
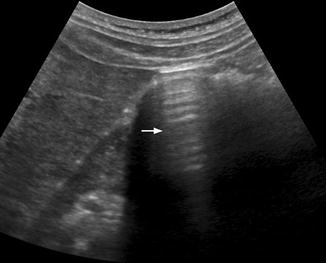
Fig. 1.9
Schematic diagram shows the ring-down artifact which occurs when the main beam encounters air bubbles. The vibrations from the air bubbles cause a continuous source of sound energy that is transmitted back to the transducer for detection
Fig. 1.10
Ring-down artifacts (white arrow) arising from air bubbles within the bowel seen on US
1.2.2.3 Mirror-Image Artifact
This artifact occurs when an object is located directly in front of a highly reflective smooth surface (Hedrick et al. 2005; Abu-Zidan et al. 2011). The ultrasound beam is totally reflected by the strong reflector towards the object. When the beam hits the object, part of the energy is reflected back to the strong reflector, which then redirects this echo towards the transducer. The true and false images are equidistant from but on opposite sides of the strong reflector (Fig. 1.11). Mirror-image artifacts are most commonly seen where there is a large acoustic mismatch, such as an air-fluid interface. The diaphragm, for example, is a strong reflective interface, and the liver parenchyma is displaced above and below the diaphragm. Similarly, during scanning of the urinary bladder, the rectum can act as a specular reflector leading to a mirror image of the urinary bladder being displayed posterior to the rectum (Fig. 1.12).
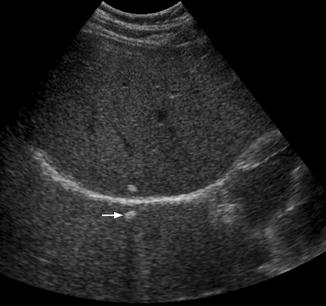
Fig. 1.11
Schematic diagram shows the mirror-image artifact. A strong reflector allows sampling of the object removed from the main beam as the sound beam does not follow a straight path
Fig. 1.12
US image shows the mirror-image artifact (white arrow) of a calcified granuloma in the liver appearing above and below the diaphragm which acts as a strong reflector
1.2.3 Artifacts Due to Velocity Errors
1.2.3.1 Velocity (Speed) Error Artifact
The speed of sound varies within different tissues (Feldman et al. 2009). However, ultrasound technology assumes that sound has a constant speed (1,540 m/s) within human tissue. If the average speed through the tissues is greater than 1,540 m/s, the returning echo will return faster to the transducer than calculated. The structure will thus be displayed more superficially on the image than expected. Conversely, if the average speed through the tissues is lower than 1,540 m/s, the structure will appear deeper than it is in reality (Fig. 1.13). Examples of velocity artifact include ultrasound imaging of a hyperechoic hepatic mass that leads to an ambiguous image of the diaphragm or ultrasound imaging of a silicon breast implant that results in a distorted image of the fibrous capsule surrounding the implant (Fig. 1.14). The image posterior to the hyperechoic lesion/silicone implant will appear deeper than it is in reality. As a result, the diaphragm or capsule appears to be distorted.
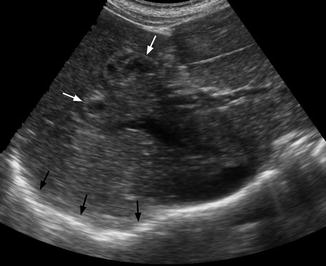
Fig. 1.13
Schematic diagram shows the velocity error artifact. The reflector is actually in position 1. If the actual propagation speed is more than assumed, the reflector will appear in position 3. If the actual propagation speed is less than assumed, the reflector will appear in position 2
Fig. 1.14
Velocity error artifact seen on US. The diaphragm appears undulating (black arrows) due to a velocity speed error caused by the heterogeneous hyperechoic liver mass (white arrows)
1.2.3.2 Refraction Artifact
Refraction of the ultrasound beam at the boundary between two media with different acoustic velocities (due to different density and elasticity) will result in misregistration and defocusing artifact (Feldman et al. 2009). In refraction artifact, a non-perpendicular incident ultrasound beam will refract and change direction at a boundary between two materials of different acoustic impedance. The ultrasound display process assumes that the beam travels in a straight line and thus misplaces the returning refracted echoes to the side of the true object location (Fig. 1.15).