Fig. 1
Monocyte and phagocytosis gating. Using all collected events, single cells are identified using a dot plot of bright-field aspect ratio vs. bright-field area (a) followed by the identification of monocytes using a dot plot of CD14 vs. SSC (b) After the monocyte population is identified, a daughter plot is generated of oxLDL vs. CD14 for the “inhibitor” (c) and respective “non-inhibitor” (d) files. The “inhibitor” treated sample is used to set the position of the oxLDL-population. By applying this position to the “non-inhibitor” sample it is possible to identify CD14+/oxLDL+ events
3.
Create a daughter plot from single cells of CD14 vs. side scatter (SSC) to positively identify monocytes (CD14+) (Fig 1b).
4.
5.
Save the file as a template and use the batch-processing wizard to apply the template and compensation matrix to the .rif files for all samples (see Note 15 ).
4 Notes
1.
Stock solutions should be prepared in a biological safety cabinet to maintain sterility.
2.
All fluorescent antibodies were titrated in a series of experiments completed prior to this method with the exception of the oxLDL. A final concentration of 15 μg/mL for oxLDL is recommended by the manufacturer.
3.
Unconjugated CD16 was purchased from eBioscience and conjugated in our laboratory using a PE/Atto594 lighting-link kit from Innova Biosciences (Cambridge, UK). PE/Atto594 has a similar emission profile as PE/Texas Red.
4.
Create an antibody cocktail by adding equal parts of each antibody to a light resistant tube. This will reduce variability by limiting the number of pipette transfers.
5.
Steps 3–5 of Subheading 3.1 should be completed in a Class 2 Biological Safety cabinet or similar equipment to maintain assay sterility.
6.


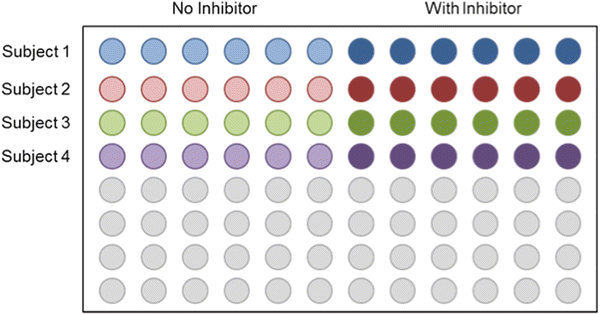
Plate map example can be seen in Fig. 2.


Fig. 2
Plate map example. Patient samples should be separated by treatment condition (inhibitor or no inhibitor) using rows and columns respectively. Organization of any other condition depends on the assay
Stay updated, free articles. Join our Telegram channel

Full access? Get Clinical Tree


