Fig. 1
Representative fluorescent cell image. Image gallery for one monocyte (CD14+) depicting all channels of fluorescence used for the present method. Ch01: Bright-field; Ch04: CD14-PE-eFluor610; Ch06: SSC; Ch02: TNF-α-FITC; Ch11: QuantiGene Probe TNF-α mRNA—AF647; and merge mRNA/Protein image
3.10 Intracellular TNF-α Protein and mRNA Analysis
1.
Open the 0 h control raw image file (.rif) and apply a predefined compensation matrix (.ctm). Save as compensated image file (.cif).
2.
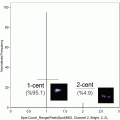
Separate single cell events from doublets and debris by creating a dot plot of bright-field aspect ratio (cell width/cell height) vs. bright-field area (Fig. 2a).
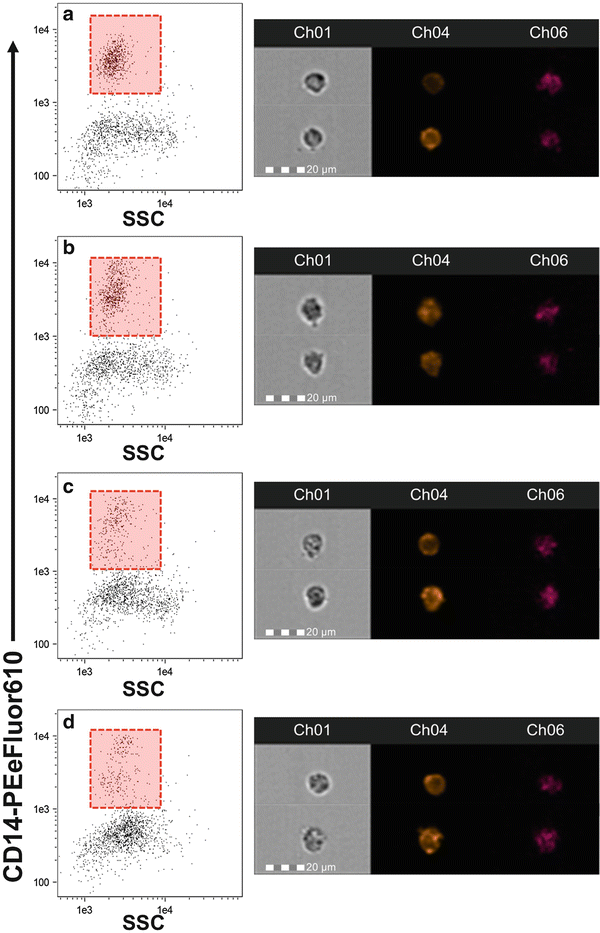
Fig. 2
Time course change in CD14 expression. Monocytes were stimulated for 1 (b), 3 (c), and 6 (d) h or held on ice as a control (a). Images to the right of each plot are representative of the cells from the corresponding time point. While we observed no change in the relative abundance of CD14 expression over time, the distribution of monocytes and the SSC appeared to change. Care should be taken when identifying CD14+ monocytes to ensure that the gate is placed properly
3.
4.
5.
Run the co-localization wizard in the IDEAS software to identify cells that are co-localizing mRNA and protein in the same location. A high co-localization index is indicative of active protein translation (see Note 21 ).
6.
Save the template (.ast) and use batch processing to apply to remaining time points (1, 3, and 6 h) for the same patient sample.
4 Notes
1.
PBMC were prepared according to a previously used method in our laboratory (1–3). Prior to PBMC isolation, prepare Leucosep tubes by adding 15 mL Ficoll-Paque and centrifuge for 5 min at 200 × g. Decant additional Ficoll-Paque into original container.
2.
PBMC need to be added starting with the longest incubation period so that all incubations finish at the same time. In other words, begin the incubation with the 6 h stimulation. Then add the 3 h stimulation, followed by the 1 h stimulation. When the incubation period finishes, remove all sample preparations at the same time, then add PBMCs to the 0 h control tube.
3.
EDTA should be added to sample preparations to release adherent monocytes from the walls of the tube. It has been our experience that failure to use EDTA after LPS stimulation results in fewer monocytes per mL, and ultimately fewer monocytes collected.
4.
With any mention of “resuspend cells in residual buffer,” this simply means to vortex the samples after aspirating.
5.
Although not required for cell surface staining, a residual volume as close to 100 μL is critical to the success of this assay during probe hybridization and signal amplification. When aspirating, use the 100 μL mark on the microcentrifuge tube as a guide.
6.
During cell surface staining, prepare Fixation Buffer 1 (1 mL per sample) by combining equal parts of Fixation Buffer 1A and Fixation Buffer 1B. Mix by inversion. Do not vortex. Prepare Fixation Buffer 1 fresh for each day and discard any unused buffer.
7.
 Quantitative Functional Morphology by Imaging Flow Cytometry
Principles of Amnis Imaging Flow Cytometry
Quantitative Functional Morphology by Imaging Flow Cytometry
Principles of Amnis Imaging Flow Cytometry
 Detection and Characterization of Rare Circulating Endothelial Cells by Imaging Flow Cytometry
 Assessment of Granulocyte Subset Activation: New Information from Image-Based Flow Cytometry
 Screening for Drugs Against the Plasmodium falciparum Digestive Vacuole by Imaging Flow Cytometry
 Quantitation of Chromosome Damage by Imaging Flow Cytometry


During Fixation Buffer 1 incubation, prepare 1× Permeabilization Buffer (3 mL per sample) with RNasin by diluting 10× Permeabilization Buffer with ultrapure water. RNasin should be added to a final concentration of 1:1000. Mix by inversion. Do not vortex. Keep at 2–8 °C. Prepare 1X Permeabilization Buffer fresh for each day and discard any unused buffer.
Related posts:
Quantitative Functional Morphology by Imaging Flow Cytometry
Principles of Amnis Imaging Flow Cytometry
Detection and Characterization of Rare Circulating Endothelial Cells by Imaging Flow Cytometry
Assessment of Granulocyte Subset Activation: New Information from Image-Based Flow Cytometry
Screening for Drugs Against the Plasmodium falciparum Digestive Vacuole by Imaging Flow Cytometry
Quantitation of Chromosome Damage by Imaging Flow Cytometry
Stay updated, free articles. Join our Telegram channel
Full access? Get Clinical Tree
