Valvular Heart Disease
Robert W. W. Biederman
Cardiovascular magnetic resonance (CMR) is generally believed to be an excellent modality for nearly every cardiac or vascular application. However, if there is a perceived weakness related to non-coronary imaging of the cardiovascular system, the general perception in the non-CMR community is that valvular heart disease poses the greatest limitation for CMR. Consequently, echocardiography has assumed the major workload for clinical valvular assessments, and CMR has classically been relegated to a secondary modality upon the failure of echocardiography. As one might infer from the direction of this prose, this notion has clearly changed over the last 5 years, making many elements of CMR comparable, or, in some indications, superior to echocardiography. The main limitation that persists, with the greatest clinical impact, is the relatively limited ability for the CMR-based evaluation of endocarditis.
The severity of valvular heart disease can be assessed in a number of ways by CMR, providing another example of the diversity of the modality to perform a comprehensive cardiovascular examination, especially for valvular assessments. The steady state free precession (SSFP) and the phase velocity mapping (PVM) sequences offer the greatest ability to assess and quantitate the extent of disease. Less often, resorting to the older gradient-recalled echo (GRE) sequences with long echo times (TEs), offers more physiologic representation of the true severity of valvular lesions through loss of signal in jet flow due to the greater intervoxel dephasing phenomena.
By definition, the two lesions that dominate valvular evaluations are regurgitant and stenotic pathologies. Each is approached in a distinct manner, which will be illustrated here by means of case study examples.
In many CMR textbooks valve anatomy is not well described because it has traditionally not been well depicted by CMR. The image in Fig. 9-1 of the aortic valve and its cusp anatomy suggests that this: notion is erroneous and outdated. Using this approach, planimetry of the aortic valve can be formally measured, not grossly estimated, as when employing various geometric formulae available to the echocardiographer or angiographer utilizing the continuity equation or the Gorlin formula. Theoretically and practically, this direct approach yields information closest to what might be obtained in the surgical suite. It would seem intuitive that the closer an imaging modality comes to demonstrating that which is visible to the eye the more accurate and robust the measurement generated would be. The following are a series of case studies and examples of valvular anatomy and lesions.
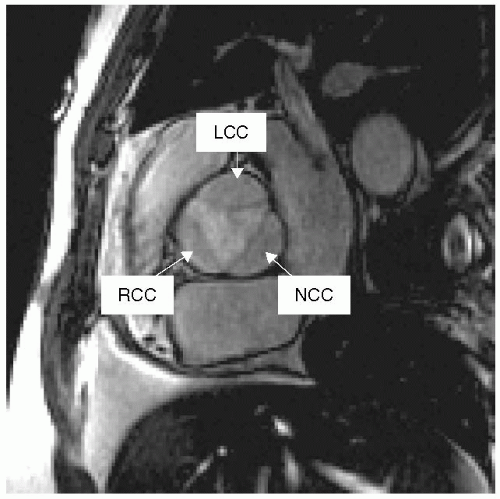 FIGURE 9-1 Gradient-recalled echo (GRE) image demonstrating a cross-sectional and anatomic view of the normal trileaflet aortic valve. LCC, left coronary cusp; RCC, right coronary cusp; NCC, noncoronary cusp. |
CASE STUDIES
Case Study 1.
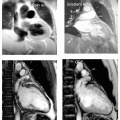
SSFP imaging of all four valves in a healthy 38-year-old black man demonstrating the normal anatomic structure of each of the valves (see Fig. 9-2). Note also the incidental atrial septal aneurysm seen in middle panel, as well as tricuspid valve prolapse. In the right panels, the trileaflet aortic valve is shown in diastole and systole. Note the high resolution that can be obtained with standard imaging sequences.
Case Study 2.
A 67-year-old man presents with syncope and several months of dyspnea on exertion (see Fig. 9-3). The examination demonstrated a harsh systolic ejection murmur radiating to the right upper sternal border, in addition to a diastolic murmur. Both lesions are depicted in the SSFP images (best seen in the DVD). Using PVM, the peak and mean gradients were 72 and 43 mm Hg, with the patient requiring aortic valve replacement (AVR). Using an SSFP sequence, visualization of the aortic valve and its associated intervoxel dephasing artifact gives substantial clinical information concerning the severity of the lesion. General severity can be gauged by the depth of radiation of the jet into the ascending aorta, with a more cranial excursion indicating worse severity (for constant scanner performance and variables). The extent of calcification can also be seen, as well as aortic root calcification, which is important for the cardiothoracic surgeon to plan a course of action. Additionally, the extent of the sinus of Valsalva, sinotubular junction, and ascending aortic dilation are easily appreciated.
Case Study 3.
In aortic regurgitation (AR) (see Fig. 9-4 left and middle panels) the primary method for initially detecting disease severity is exactly the same as that used in echocardiography, in which the width of the jet relative to the left ventricular outflow tract (LVOT) dimension is related to severity of the regurgitant lesion. Specifically, mild corresponds to a jet less than one third, moderate to between one third and two thirds, and severe is greater than two thirds of the LVOT dimension in the three-chamber view. Although echocardiographically derived, this measurement in comparison with angiography, the CMR LVOT view reveals an eccentric jet of AR (left panel, arrow). The short-axis view shows two smaller jets of AR (middle panel, arrows) composing the one jet seen in the orthogonal view. CMR permits mathematical quantitation to be performed, providing the ability to track serial changes and/or assess response to management strategies.
Case Study 4.
The Coanda effect is illustrated in the right panel (see Fig. 9-4), whereby a small jet of AR is seen radiating along the anterior mitral leaflet (arrow) but is underestimated by all semiquantitative techniques because of the energy dissipation that occurs as the jet travels along the leaflet. This is also an example of the imaging equivalent of the Austin Flint murmur.
Case Study 5.
Evaluation of the mitral valve typically begins with an SSFP sequence in the short-axis view, depicting the anterior and posterior leaflets. Shown in Fig. 9-5 are images from a 56-year-old white woman demonstrating the individual anatomy of the mitral valve leaflets (single phase of an SSFP sequence taken from a short-axis acquisition). The individual scallops of the posterior leaflet are visible. This information is critical when considering mitral valve repair or replacement. Delineation of this information for the surgeon adds a clear extra dimension, as the leaflets are directly visualized and related to cardiac anatomy.
Case Study 6.
A 43-year-old white man presents for routine evaluation with a dilated aortic root on transthoracic echocardiography and concern for bicuspid aorta, both confirmed by CMR (see Fig. 9-6). Note the underestimation of the ascending aortic dilation (right panel) but, just as importantly, the relative prolapse of the posterior cusp is well seen in this flagrant example of a bicuspid aortic valve (right panel). Believed to be a failure of neural crest cell migration, lack of proper migration of elastic fibers contributes to the above scenario, which also includes aortic coarctation (not present in this patient). In this case, the combination of SSFP (left and middle panels) and double-inversion recovery (DIR) (right panel) sequences answered the entire spectrum of clinical questions posed. PVM was performed to quantitate the degree of peak and mean gradient. 3D volumetrics complete the picture, with full delineation of mild left ventricular hypertrophy, suggesting the growing physiologic significance to this common congenital anomaly. Yearly follow-up and endocarditis prophylaxis were recommended with a high likelihood for requiring aortic valve surgery in the near future (<10 years).
Mitral regurgitation (ERO) (MR) has been shown to be associated with increased morbidity and mortality, even in asymptomatic patients. Yet, estimation of MR by echocardiography has been primarily limited to quantification of effective regurgitant orifice area derived from various geometric assumptions. CMR also permits indirect quantitation of MR. MR is the most ubiquitous valvular lesion for which a patient may present. Discussed in an earlier chapter, several aspects bear reiteration. First, MR is depicted as a dephasing intervoxel
artifact and is used clinically to gauge semiquantitatively the extent of mitral valve leakage. Using PVM, the exact amount of regurgitation can be measured in a manner very distinct and very different from the many physiologic and geometric assumptions utilized by echocardiography. Measurement of all the blood volume that passes through a plane positioned parallel to the mitral valve annulus completely interrogates the extent (volume) of MR. Moreover, elements to define the underlying anatomic mechanistic perturbations can also be well defined by CMR. In Fig. 9-7, there are several metrics used surgically and clinically to better describe the etiology of MR, where, for two patients with essentially the same left ventricle (LV) metrics, there is a very discordant degree of MR. Examining the mitral valvular apparatuses demonstrates the explanation for the differences in MR (see Table 9-1). In patient A, as opposed to patient B, the mitral annulus, tenting angle, coaptation distance (valve closure point from mitral annulus), and tenting area (area of triangle formed by the junction of the mitral annulus and the valve closure point) are near normal.
artifact and is used clinically to gauge semiquantitatively the extent of mitral valve leakage. Using PVM, the exact amount of regurgitation can be measured in a manner very distinct and very different from the many physiologic and geometric assumptions utilized by echocardiography. Measurement of all the blood volume that passes through a plane positioned parallel to the mitral valve annulus completely interrogates the extent (volume) of MR. Moreover, elements to define the underlying anatomic mechanistic perturbations can also be well defined by CMR. In Fig. 9-7, there are several metrics used surgically and clinically to better describe the etiology of MR, where, for two patients with essentially the same left ventricle (LV) metrics, there is a very discordant degree of MR. Examining the mitral valvular apparatuses demonstrates the explanation for the differences in MR (see Table 9-1). In patient A, as opposed to patient B, the mitral annulus, tenting angle, coaptation distance (valve closure point from mitral annulus), and tenting area (area of triangle formed by the junction of the mitral annulus and the valve closure point) are near normal.
 FIGURE 9-2 Steady state free precession (SSFP) images: far left panel is a standard three-chamber view demonstrating the mitral valve and aortic valve, middle left panel shows the redundant tricuspid valve leaflets and a moderate size atrial septal aneurysm, whereas the right panels shows a cross-section of both the aortic (systole far right, and diastole mid right) and pulmonic valve (arrow). Images relate to case study 1. |
Stay updated, free articles. Join our Telegram channel

Full access? Get Clinical Tree


