12 Vascular ultrasound of abdominal aortic branches
INTRODUCTION
Doppler investigation of abdominal vessels often forms part of an abdominal ultrasound study. Texts on abdominal ultrasound include details of Doppler investigations, although this is not their main emphasis. For those centers or units whose main interest is vascular ultrasound, there is an increasing requirement to investigate the major aortic branches, particularly the renal vessels, because:
• The staff have skills and equipment to conduct high-quality Doppler studies of renal and other visceral vessels
• Many patients have coexisting arterial disease of leg, carotid, and renal arteries
• Renal and mesenteric arteries are frequently involved in aortic aneurysms; noninvasive examination of the flow in these is useful pre- and postoperatively and can complement computed tomography (CT) investigation.
RENAL VASCULAR ANATOMY, HEMODYNAMICS, AND DOPPLER APPEARANCE
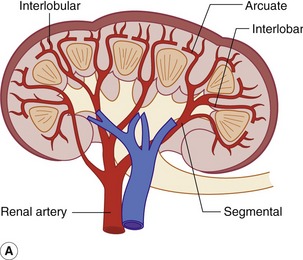
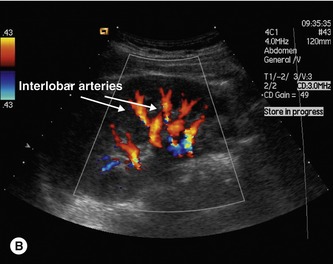
The kidneys are supplied most commonly by a single renal artery from the aorta, which arises within 3 cm distal to the superior mesenteric artery. The renal artery divides, usually at the level of the renal hilum into five segmental arteries. These further branch into interlobar arteries which in turn lead to arcuate arteries at the cortex/medulla border (Fig. 12.1). In the cortex, these branch into interlobular arteries from which arise the afferent arterioles to the glomeruli where filtration occurs as part of the renal process. There are no major arterial collateral paths. Venous drainage is similar in pattern, draining to the renal vein which leaves the kidney through the hilum.
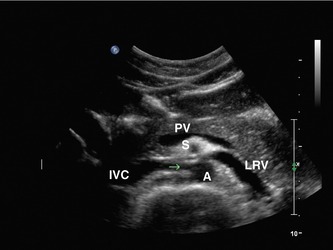
The right renal artery passes under the inferior vena cava and posterior to the renal vein. The left renal vein passes between the aorta and superior mesenteric artery with the left renal artery posterior to it (Figs 12.2 and 12.3).
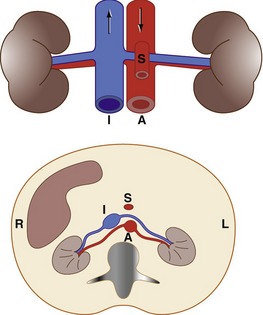
Figure 12.2 The most common renovascular anatomy. The right renal artery passes deep to the inferior vena cava (I). The left renal vein passes between the superior mesenteric artery (S) and the aorta (A).
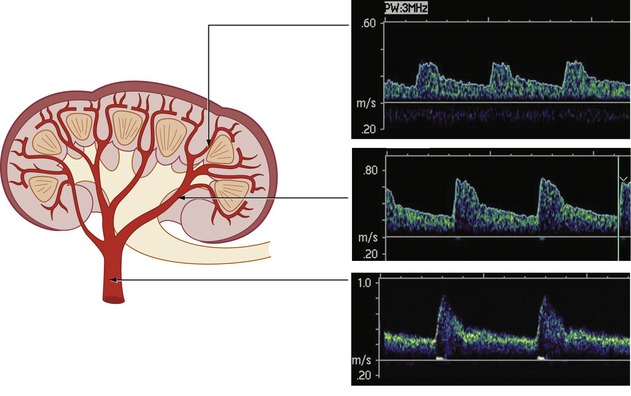
The rapid subdivision from renal artery to over 1 million afferent arterioles within a few centimeters means that there is a high density of medium-sized arteries and veins in the kidney, with a corresponding vivid appearance on color flow imaging. In good health kidneys receive approximately 20% of resting blood flow, approximately 1000–1200 ml/min. Flow is fairly constant, with a slight rise following a high-protein meal. The high flow and low resistance lead to flow waveforms with high diastolic flow. Resistance index (RI) at interlobar artery is in the range 0.55–0.7, rising slightly with age. Flow waveforms are slightly more pulsatile in the proximal renal artery and progressively dampen as blood flows to the smaller arteries within the kidney (Fig. 12.4). Blood velocities diminish rapidly as the arteries subdivide. For those with experience of imaging carotid arteries, the flow waveforms and velocities in the renal artery are similar to those in the internal carotid artery. This is a useful aide-mémoire when considering velocity increases to indicate RAS.
SCANNING THE RENAL VASCULATURE
It is imperative to use low-frequency transducers to image the renal arteries. High velocities in deep abdominal arteries produce problems of aliasing and pulse repetition frequency (PRF) limits. Using low color and spectral Doppler transmit frequencies results in low Doppler frequencies, leading to a better chance of unambiguous velocity measurement. Low frequencies also penetrate better and give improved color and spectral sensitivity at large depths. Low-frequency curvilinear arrays (typically 4−1 MHz operating at 2 MHz for Doppler modes) can be used but it may be an advantage to use low-frequency phased array transducers which have good color flow and Doppler sensitivity and are useful when access is limited, for example when the ribs overlie the kidney. However, the phased array B-mode imaging is markedly inferior to its curvilinear counterpart. For imaging intrarenally, higher transducer frequencies give higher Doppler frequencies and improved visualization of the flow waveform for lower velocities in the smaller arteries.
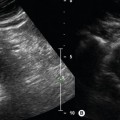
If possible, the patient should be examined in a fasting state. The intrarenal vessels are best imaged by ultrasound from the flank (Figs 12.5 and 12.6). The patient lies in the left (for the right kidney) and right (for the left) decubitus position and the kidneys are imaged with the transducer placed below the ribs. In longitudinal view the large intrarenal arteries in the mid-pole flow towards the transducer, giving good color and spectral Doppler images (Fig. 12.6) adequate for flow waveform analysis. By angling the probe, changing focal position, and reducing transmit frequency, the renal artery can be followed to the origin from the aorta. If images are clear this view may include both renal arteries, the classic “banana peel” image (Fig. 12.7), more commonly reproduced in textbooks than in everyday scanning. If there are clear views and if the beam/vessel angle correction is acceptable then it is worthwhile obtaining velocities from the opposite renal artery origin since this may be the clearer view than when scanning from the opposite flank.
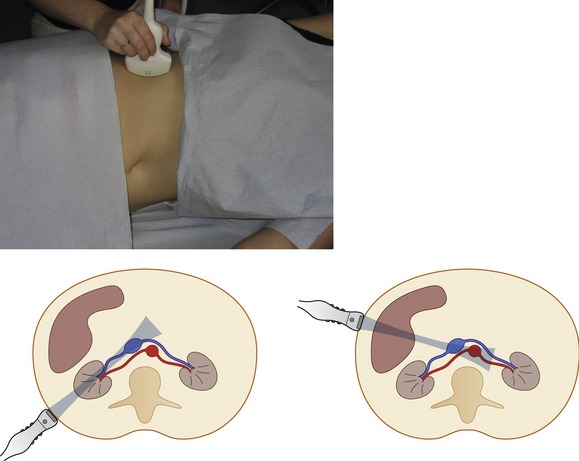
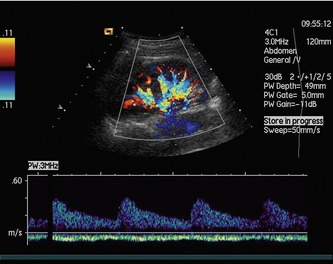
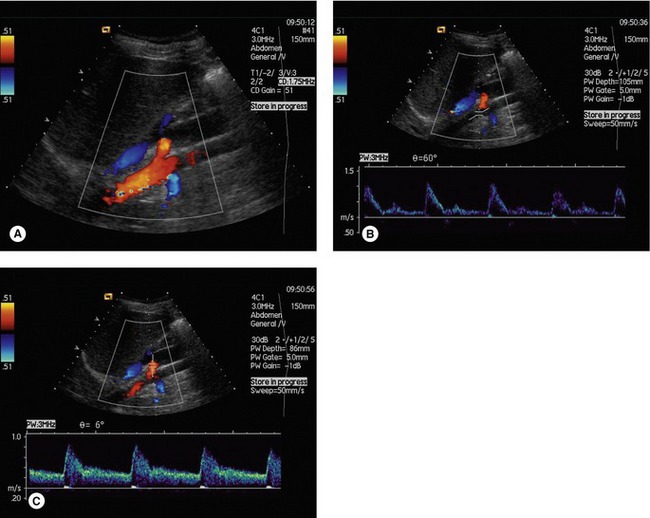
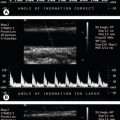
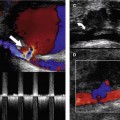
Figure 12.7 (A) Right (red) and left (blue) proximal renal arteries arising from the aorta from a flank view. Flow waveforms from (B) the aorta and (C) proximal renal arteries. Note the low angle correction required for the renal artery sonogram. In practice, angle correction need not be made if beam/flow angles are low since velocities will be minimally affected between 0 and 20°.
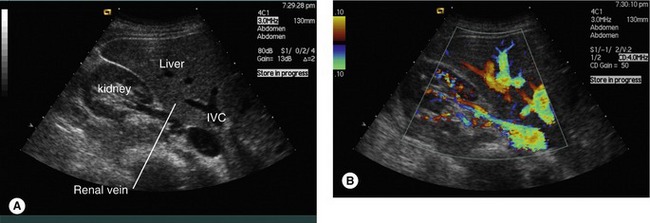
The probe can be turned in the transverse plane, which often allows the entire length of the renal artery and vein to be viewed in one plane (Fig. 12.8). There is no standard optimum approach to use from the flank and sometimes the best image of the renal arteries can be obtained from a more anterior approach.
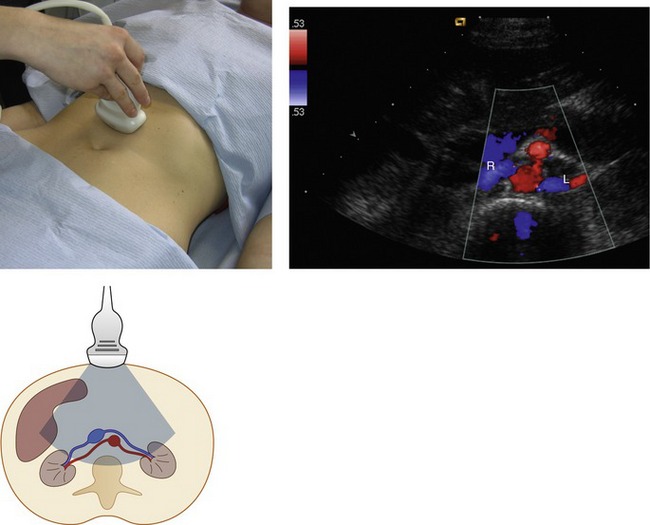
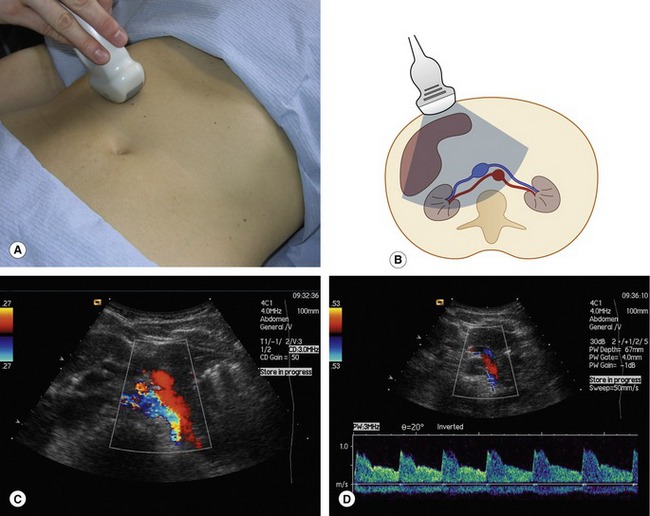
The proximal renal arteries are also usually imaged successfully from an anterior approach. Scanning transversely, the renal arteries are seen in B-mode. From a midline approach the renal arteries are almost perpendicular to the ultrasound beam − good for B-mode images but unsuitable for Doppler imaging (Fig. 12.9). By moving the transducer slightly to the left the beam can image ‘down’ the right renal artery with Doppler angles suitable for velocity measurement. Similarly, Doppler images of the left renal artery are best if the probe is translated slightly to the right of the midline. Angle correction is usually required for peak systolic velocity (PSV) measurement in this view (Fig. 12.10). Examination of the renal arteries should also include imaging of the aorta, both to exclude unsuspected aortic aneurysm and to measure aortic flow velocities for comparison.
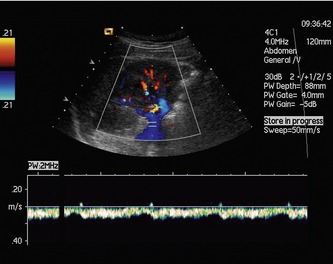
Renal vein flows are seen in the same images as arteries. Intrarenal venous velocities are lower than arterial velocities but veins are larger and at low scales/PRFs can dominate the color image. Renal veins show pulsations dependent on proximal pressure changes from the right heart and from breathing (Fig. 12.11). If venous blood pressure is high, then pulsations in the renal vein may be very high with reverse flow (Fig. 12.12). If arterial flow is difficult to identify, venous fluctuations may mask the arterial signal. This can cause confusion for inexperienced operators.