Fig. 18.1
Diagram of the lateral surface of the brain illustrating its main anatomic features
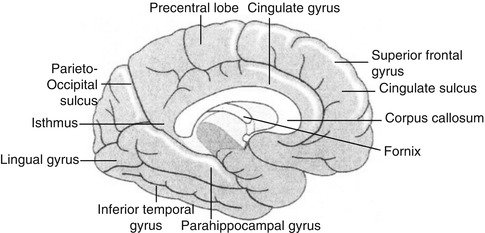
Fig. 18.2
Diagram of the brain illustrating the main internal structures
Knowledge of cross-sectional anatomy of the brain (Figs. 18.3, 18.4, and 18.5) is a prerequisite for proper interpretation of brain imaging since tomographic imaging is the rule in current functional neuroimaging. The interpretation of brain SPECT and PET studies depends on a background of neuroanatomy which with current techniques allows co-registration of MRI and CT with the functional SPECT and PET images (Figs. 18.3, 18.4, and 18.5).
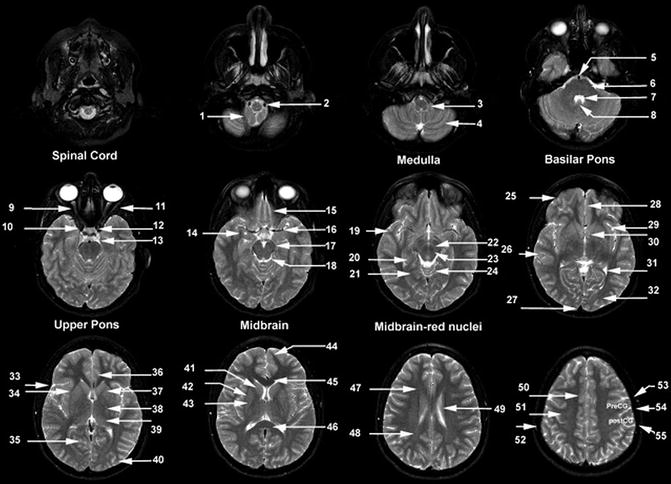
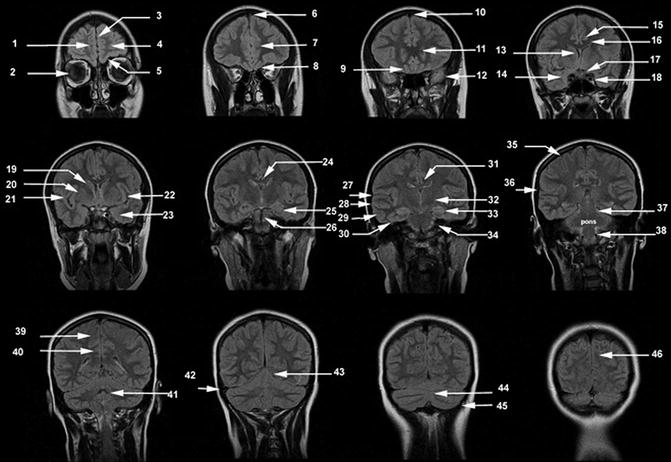
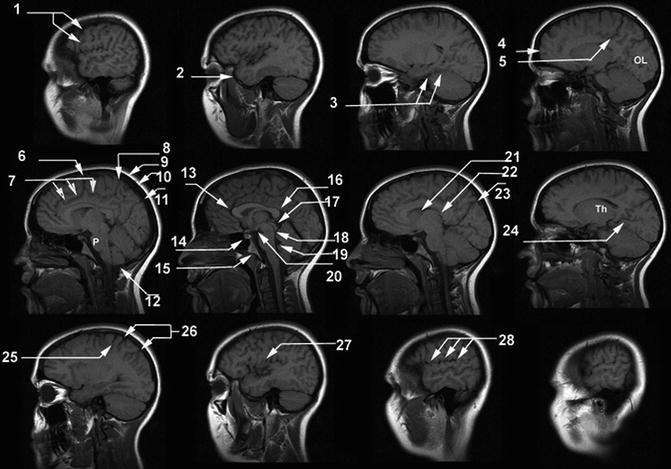
Fig. 18.3
Axial T2-weighted MR images. (1) Cerebellar tonsil, (2) vertebral artery, (3) medulla, (4) cerebellar hemisphere, (5) basilar artery, (6) pons, (7) 4th ventricle, (8) uvula, (9) optic nerve, (10) internal carotid artery siphon, (11) lateral rectus muscle, (12) pituitary gland, (13) ambient cistern, (14) amygdala, (15) gyrus rectus, (16) middle cerebral artery, (17) posterior cerebral artery, (18) mesencephalic cistern, (19) temporal pole, (20) hippocampus, (21) parahippocampal gyrus, (22) substantia nigra, (23) red nucleus, (24) cerebellar vermis, (25) frontal lobe, (26) temporal lobe, (27) superior sagittal sinus, (28) gyrus rectus, (29) insular cortex, (30) anterior commissure, (31) posterior horn lateral ventricle, (32) occipital lobe, (33) Sylvian fissure, (34) external capsule, (35) calcarine sulcus, (36) cingulate gyrus, (37) anterior limb of the internal capsule, (38) posterior limb of the internal capsule, (39) thalamus, (40) occipital lobe, (41) head of the caudate nucleus, (42) putamen, (43) globus pallidus, (44) frontal pole, (45) genu of the corpus callosum, (46) splenium of the corpus callosum, (47) forceps minor, (48) forceps major, (49) caudate nucleus, (50) cingulate gyrus, (51) centrum semiovale, (52) calvarial marrow, (53) precentral sulcus, (54) central sulcus, (55) postcentral sulcus. PreCG, precentral gyrus; PostCG, postcentral gyrus
Fig. 18.4
Coronal FLAIR MR images. (1) Superior frontal gyrus, (2) orbit, (3) interhemispheric fissure, (4) frontal pole, (5) orbital gyrus, (6) superior sagittal sinus, (7) cingulate gyrus, (8, 9) gyrus rectus, (10) superior sagittal sinus, (11) genu of the corpus callosum, (12) temporal pole, (13) anterior horn lateral ventricle, (14) mesial temporal lobe, (15) cingulate gyrus, (16) corpus callosum, (17) optic nerve, (18) cavernous sinus, (19) head of the caudate nucleus, (20) lenticular nucleus, (21) Sylvian fissure, (22) insular cortex, (23) amygdala, (24) corpus callosum, (25) hippocampus, (26) basilar artery, (27) Sylvian fissure, (28) superior temporal gyrus, (29) middle temporal gyrus, (30) inferior temporal gyrus, (31) cingulate gyrus, (32) thalamus, (33) parahippocampal gyrus, (34) vestibulocochlear nerve, (35) central sulcus, (36) Sylvian fissure, (37) mesencephalon, (38) medulla, (39) paracentral lobule, (40) cingulate gyrus, (41) 4th ventricle, (42) transverse sinus, (43), tentorium (44) cerebellar vermis, (45) cerebellar hemisphere, (46) cuneus
Fig. 18.5
Sagittal T1-weighted MR images. (1) Central sulcus, (2) temporal pole, (3) parahippocampal gyrus, (4) frontal pole, (5) ascending branch of cingulate sulcus, (6) paracentral sulcus, (7) cingulate sulcus, (8) ascending branch of cingulate sulcus, (9) scalp, (10) calvarium, (11) superior sagittal sinus, (12) cerebellar tonsil, (13) genu of the corpus callosum, (14) pituitary gland, (15) clivus, (16) splenium of the corpus callosum, (17) tectal plate, (18) aqueduct of the 3rd ventricle, (19) 4th ventricle, (20) mammillary body, (21) head of the caudate nucleus, (22) thalamus, (23) parieto-occipital sulcus, (24) calcarine sulcus, (25) central sulcus, (26) postcentral sulcus, (27) insular cortex, (28) Sylvian fissure. OL occipital lobe, P pons, Th thalamus
18.2.2 Physiology
18.2.2.1 Perfusion
Blood flow utilization by neurons is primarily related to synaptic activity at the neuron cell body; thus, gray matter requires about four times as much blood flow as white matter. In the normal brain, the overall determinant of regional cerebral blood flow (rCBF) is dependent on vascular integrity, cerebral anatomy, and cerebral function. Since diseases of the brain can disrupt one or more of these functions, for accurate diagnosis it is important to integrate these three physiological functions with the pattern of rCBF change from normal to arrive at an accurate diagnosis of disease. Perfusion changes noted with SPECT radiotracers are appreciated due to the differences in the cortical gray to white matter perfusion related to the large amount of neurons in the cortex. Coupling of perfusion and metabolism provides functional information regarding the state of the patient during tracer injection with 99mTc-HMPAO and 99mTC-ethyl cysteinate dimer (ECD).
18.2.2.2 Metabolism
In the brain, glucose metabolism provides approximately 95 % of adenosine triphosphate (ATP) required for brain function. Under normal physiological conditions, glucose metabolism is tightly connected to neuronal activity. 18F-FDG is an analog of glucose and is taken up by living cells via the normal glucose pathway. 18F-FDG is suitable for imaging regional cerebral glucose consumption with PET since it accumulates in neuronal tissue depending on facilitated transport of glucose and hexokinase-mediated phosphorylation. The rationale behind its use as a tracer for cancer diagnosis depends on an increased glycolytic activity in neoplastic cells. The cell alterations related to neoplastic transformation are associated with functional impairments that are discernible before structural alterations occur. Therefore, changes in neuronal activity induced by disease are reflected in an alteration of glucose metabolism.
18F-FDG PET is currently the most accurate in vivo method for the investigation of regional human brain metabolism in health and disease states, when conventional morphologic diagnostic modalities (i.e., CT, MRI) do not yet detect any evident lesions.
18.3 Pathophysiology
18.3.1 Cerebrovascular Disease
Stroke is the third leading cause of death (∼1 in 17 deaths) and the most expensive form of disability in the United States [1]. Disruption in blood flow usually results in transient ischemic episode or a stroke. The pathologic mechanism is most often thrombotic or embolic (87 %), but arterial occlusion by atheromatous disease combined with the lowering of systemic arterial blood pressure could also produce “hemodynamic” stroke; alternatively, cerebrovascular compromise results from intraparenchymal (10 %) and/or subarachnoid (3 %) hemorrhage with acute effects because of blood and/or elevated intracranial pressure and delayed effects because of ischemic deficits from cerebral vasospasm (CVS) [2].
Through early studies with 15O-water PET [3, 4], hypoperfusion to the brain was classified into three stages: irreversible cerebral infarction occurring with cerebral blood flow (CBF) <7–12 mL/100 g/min (ischemic core), abnormally functioning but viable tissue with the potential for recovery or progression to infarction with CBF <20 mL/100 g/min but above the infarction threshold (penumbra), and mildly hypoperfused but otherwise normally functioning and not at-risk tissue with CBF >20–22 (oligemia; normal CBF is 50–55 mL/100 g/min) [5]. The infarction rCBF threshold allowed the prediction of tissue necrosis in a probabilistic way, while the fate of penumbral tissue depends on events after the scan, namely, early reperfusion or not. Viability additionally required regional metabolic rate of oxygen >1.3 mL/100 g/min [2–4]. Thus, the brain distal to a vascular occlusion could remain viable, with relatively preserved cerebral metabolic rate of oxygen (CMRO2), through compensatory increase in oxygen extraction fraction (misery perfusion) [3, 4, 6, 7], or conversely, infarcted brain could demonstrate relative or absolute increase in rCBF with low oxygen extraction fraction (OEF) secondary to delayed reperfusion (luxury perfusion) [8–11].
18.3.2 Dementia
Approximately 3–4 % of the adult population in the United States demonstrates significant cognitive impairment. In general, the causes of dementia include primary neurodegenerative disorders with the most prevalent being Alzheimer’s disease, followed by frontotemporal dementia, Lewy body dementia, parkinsonian dementia, progressive supranuclear palsy, Pick’s disease, cortical basilar degeneration, Huntington’s disease, and Wilson’s disease [12]. Vascular dementias are categorized as multi-infarct, Binswanger’s, cerebral autosomal dominant arteriopathy with subcortical infarctions, and leukoencephalopathy. Inflammatory etiologies include multiple sclerosis and vasculitis. Infectious etiologies include syphilis, human immunodeficiency virus (HIV), Lyme disease, and other viral diseases and fungal diseases. Cancers are a rare cause of dementia which can be attributed to primary result of the disease, metastatic disease to the brain, and perineoplastic syndromes. Other causes and physical abnormalities include trauma and hydrocephalus.
The prevalence of dementia in the population increases significantly with age, with approximately 13 % of the population having dementia in the 77–84-year-old range, and almost 50 % in the population 95 years and older. With the increasing age of the population of the United States, dementia is expected to be a significant health-care problem. It has been documented [13] that approximately 80 % of all dementias are attributable to Alzheimer’s disease or Lewy body dementia. Vascular dementia comprises approximately 18% of the dementias, with the other dementias comprising approximately 5.5 %.
18.3.2.1 Alzheimer’s Disease (AD)
Alzheimer’s disease (AD) is the most common cause of dementia in patients over 65 years of age. It causes approximately 50–60 % of all dementias, followed by dementia with Lewy bodies (DLB) and frontotemporal dementia (FTD) [14]. Approximately 27 million individuals are diagnosed with AD worldwide, a number that is estimated to quadruple by 2050, meaning 1 in 85 people will be affected [15, 16].
Alzheimer’s disease was first described by Alois Alzheimer in 1906 as an unusual disease of the cerebral cortex in a 51 year old woman named Auguste Deter. Her symptomatology included presenile dementia with memory loss, disorientation, hallucinations, and ultimately death by the age of 55. The autopsy showed classic neuropathological changes as senile plaques and neurofibrillary tangles. He also described a granulovascular degeneration and amyloid angiopathy. The diagnosis of Alzheimer’s disease has traditionally been through the NINCDS/ADRDA criteria [17]. In these clinical criteria, dementia is established by clinical examination and documented by the mini-mental test or Blessed Dementia Scale and confirmed by a neuropsychological examination. Alzheimer’s dementia requires cognitive deficits in two or more areas, with progressive worsening of memory and other cognitive function. There should be no disturbances in consciousness. The age of onset is typically between the ages of 40 and 90 years, most often after 65 years. In addition, the absence of systemic disorders or other brain diseases are required as these can confound the diagnosis of Alzheimer’s disease.
The two basic types of Alzheimer’s disease are familial and sporadic. Familial AD (FAD) is a rare form of AD, affecting less than 10 % of AD patients. All FAD is early onset, meaning the disease develops before age 65. Apolipoprotein E (APOE) epsilon4 gene dose (i.e., the number of epsilon4 alleles in a person’s APOE genotype) is associated with a higher risk of AD and a younger age at dementia onset [18], and correlates with reduced regional hypometabolism in brains of patients with AD. In addition, advanced age, prior head trauma, low educational levels, and gender, with female greater than male predominance, have been associated with an increased risk for Alzheimer’s disease.
Previous guidelines for the detection of AD included meeting the Diagnostic and Statistical Manual of Mental Disorders (fourth edition) criteria for dementia, which required an episodic memory disorder and impairment in >1 cognitive domain that interfered with daily life activity or social function. Beyond that, a diagnosis of “probable AD” was essentially a diagnosis of exclusion [16, 19, 20]. The Diagnostic and Statistical Manual of Mental Disorders (fifth edition), released in May 2013, replaces the term dementia with major neurocognitive disorder and mild neurocognitive disorder. For a diagnosis of AD, it requires memory problems and impairment in at least one other cognitive domain interfering with functional independence. For those with Mild Neurocognitive Disorder, AD diagnosis can only be made if the subject additionally tests positive for a mutation in an autosomal dominant AD gene or certain biomarkers. However, for the first time in 27 years, the National Institute on Aging and the Alzheimer’s Association established new guidelines for the diagnosis and treatment of dementia. The new guidelines examine the biological changes underlying symptoms of dementia, whereas previous diagnosis relied primarily on neuropsychological evaluation, clinical assessment, and evaluation of family history or reports. Albert et al. [21] described three distinct phases for AD: presymptomatic, mildly symptomatic but predementia, and dementia caused by AD. Furthermore, in conjunction with clinical evaluation, three biomarkers—cerebrospinal fluid (CSF), magnetic resonance imaging (MRI) volume, and PET—were identified to be useful for diagnosis. The presymptomatic stage marks a preclinical form of AD when biomarker changes indicate the presence of an early stage of a dementia process, but memory loss or other behavioral symptoms are not yet noticeable. At this stage, individuals could potentially benefit from vaccination approaches or other preventive strategies. The mildly symptomatic phase is marked by noticeable cognitive changes that do not necessarily interfere with daily life. The last stage is distinguished by definite memory, cognitive, and behavioral deficits that disrupt daily tasks.
18.3.3 Seizures and Epilepsy
Epilepsy is the most common serious brain disorder in children, occurring in all parts of the world and within every stratum of the population. Through its effects, it exerts a significant physical, psychological, economic, and social toll on children and their caregivers. An epileptic seizure is defined as an excessive burst of abnormally synchronized neuronal activity affecting small or large neuronal networks that results in clinical manifestations that are sudden, transient, and usually brief.
The 1981 International League Against Epilepsy classification dichotomizes seizures into generalized and partial based solely on electroclinical features [22]. Generalized seizures are those that arise from large areas of the cortex in both hemispheres and in which consciousness is invariably impaired from the onset. Generalized seizures are subdivided into multiple categories. Typical absence (petit mal) seizures comprise an abrupt loss of consciousness, often described as a vacant look, and cessation of all motor activity, classically with preservation of tone. The attack ends as abruptly as it started, and previous activity is resumed as if nothing had happened. A myoclonic seizure is a brief contraction of a muscle, muscle group, or several muscle groups due to a cortical discharge. It can be single or repetitive, varying in severity from an almost imperceptible twitch to a severe jerking. Clonic seizures are typically seen in young children and consist of clonic jerking, which is often asymmetric and irregular. Tonic seizures take the form of a tonic muscle contraction with altered consciousness, without a clonic phase. Tonic–clonic (grand mal) seizures are the classic form of epileptic seizure, with altered consciousness followed by tonic extension and then clonic convulsive movements of all four extremities. Atonic seizures may manifest as the classic drop attack, in which all postural tone is suddenly lost, or more subtle changes, such as a slight head drop or bowing at the knees.
Partial seizures are those that arise in specific, often small, loci of the cortex in one hemisphere. They are divided into simple partial seizures, which occur without alteration of consciousness and have motor, sensory, autonomic, or psychic manifestations, and complex partial seizures, in which consciousness is impaired or lost. Either type of partial seizure may evolve into a secondarily generalized seizure. Importantly, from a surgical perspective, partial seizures invariably imply focal brain pathology, although this may not always be readily apparent on investigation.
Medical treatment of a first seizure is controversial, as the recurrence risk of a subsequent seizure is approximately 50 %. Antiepileptic drug therapy after the first seizure appears not to alter the long-term prognosis for developing epilepsy, but may reduce the risk for a second seizure. The risk of having a third seizure on the background of two previous events is higher, and for these reasons, most neurologists advocate institution of antiepileptic drug therapy after the second seizure. Clearly, treatment should be individualized, as the recurrence risk is affected by such patient-specific variables as etiology (structural brain abnormalities carry a higher risk), electroencephalography (EEG) findings (spike and wave discharges on the first EEG carry a higher risk), and age (younger patients are at higher risk of recurrence, likely because of the confounding effect of etiology). Other issues such as seizure type, timing, and frequency (impact of seizures on quality of life); the cognitive, behavioral, and psychosocial side effects of antiepileptic drug therapy; and patient compliance with therapy must also be considered.
18.3.4 Brain Tumors
Brain tumors manifest with the subacute or chronic onset of generalized symptoms, such as confusion, headaches, seizures, and nausea or focal symptoms and signs, such as visual field deficit, loss of language, unilateral weakness, sensory neglect, or difficulty walking. There are no symptoms or signs specific to any brain tumor because the anatomic location of the tumor in the brain dictates the presentation. A tissue diagnosis through a biopsy or surgical resection is necessary to confirm the pathology, except in patients with metastatic tumors with a known primary tumor. The differential diagnosis of mass lesions in the brain includes abscess, multiple sclerosis lesions, inflammatory disease, and other infections, such as toxoplasmosis and cysticercosis.
Brain tumors share some features and challenges for diagnosis and therapy with tumors elsewhere in the body, but they also pose specific issues that are related to the unique properties of the organ they sit in. Most of the brain is separated from the blood by the blood–brain barrier (BBB) that exerts a much more restrictive control over substances that are allowed to pass (or may even be subject to facilitate transport) than most other organs.
Brain tumors are categorized as metastatic or primary. The incidence and prevalence of metastatic tumors outweighs primary tumors by 4:1. Lung and breast carcinoma make up the majority of metastatic tumors, largely because of the fact of their increased prevalence in the population compared with other tumors. Melanoma is a less prevalent malignancy but has a high propensity to metastasize to the brain. Meningioma is usually a benign tumor that is found most often in the fourth through sixth decade with a female to male ratio of 2:1. Primary central nervous system lymphoma (PCNSL) is a rare tumor that usually affects patients in the sixth decade and older.
Primary brain tumors or gliomas consist of astrocytomas, oligodendrogliomas, and ependymomas in decreasing order of prevalence. It was once thought that these tumors are derived from mutations of normal glial cells, but it is increasingly recognized that gliomas are derived from brain tumor stem cells.
Histologic features of gliomas give them a grade according to the World Health Organization (WHO) system [23].
Grade I glioma (pilocytic astrocytoma) is rarely ever seen in adults. Grade II gliomas are low-grade gliomas (LGG) with subtypes astrocytoma and oligodendroglioma and usually affect patients in the third and fourth decades. They show little cellular atypia and proliferation but frequently infiltrate healthy surrounding brain and, therefore, cannot be cured by surgery or radiotherapy. Despite being lower-grade tumors, LGG are not benign. The natural history is that patients with LGG ultimately progress to HGG. LGG make up about 15 % of all primary brain tumors. LGG are more likely to present with seizures than HGG.
Grade III and IV tumors are high-grade gliomas (HGG) and include tumors with gross cellular atypia and necrosis. They are made up predominantly of glioblastoma multiforme (GBM) and anaplastic astrocytoma (AA) (WHO grade III), whereas anaplastic oligodendroglioma and anaplastic ependymoma are less common. Glioblastoma (GBM) is the most malignant glioma and makes up 60–70 % of all gliomas.
Symptoms and signs of brain tumor should prompt neuroimaging. Magnetic resonance imaging (MRI) has largely replaced computed tomography (CT) for evaluating brain tumors, although CT serves as a quick screening modality and must be used in patients who have contraindications to MRI. Radiographic features on MRI can predict the type of tumor, but cannot accurately confirm the pathology. MRI and CT rely on blood–brain barrier (BBB) damage (frequent in grades III and IV, absent in grade II) and morphologic appearance (e.g., presence of necrosis, vascularity) for grading. Although this is regarded as largely sufficient in untreated gliomas, it becomes unreliable in treated tumors because BBB damage and necrosis also can result from formation of reactive tissue after therapy. In that situation, imaging methods that distinguish tumor from reactive nonneoplastic tissue will contribute significantly to clinical decision making. Contrast enhancement also cannot provide proper grading in brain tumors with a constitutive lack of BBB, such as meningiomas and lymphomas. In general, functional measures related to tumor proliferation are expected to deliver more reliable information on prognosis than morphologic imaging methods.
Because of the BBB, many tracers that easily reach tumors in other parts of the body would only reach brain tumors once there is a disruption of the BBB by the brain tumor. Thus, the disruption of the BBB, which can easily be detected on contrast-enhanced magnetic resonance imaging (MRI) and computed tomography (CT), is regarded as the main diagnostic indicator for malignant gliomas, meningiomas, and brain metastases, as well as for some less frequent tumors without an intact BBB.
As a consequence of the exclusion of all radiotracers that cannot pass the BBB from the normal brain, there usually also is a good tumor-to-brain contrast for all tracers with these properties, which historically included 99mTc-pertechnetate and 68Ga-diethylene triamine pentaacetic acid and currently also fluorothymidine (FLT) and virtually all labeled macromolecules (although low-capacity slow-specific transfer by receptors has been observed for some). However, the excellent contrast may not indicate much more than the presence of BBB damage, which can readily be seen and even quantified by contrast-enhanced MRI. Therefore, much interest and effort has been invested into the development and evaluation of brain tumor tracers that do not depend on BBB damage, such as fluorodeoxyglucose (FDG) and labeled amino acids, because they are being transferred by large-capacity specific transporters across the intact BBB.
There is a large variation in the response of tumors to therapy by irradiation and cytostatic drugs within tumor types and often even in different areas of the same tumor. However, with morphologic imaging, it is difficult to determine whether a tumor is responding, and only late after completion of therapy, the outcome becomes evident. Especially with chemotherapy, monitoring of therapeutic efficacy is a major goal to modify inefficient therapy before the patient’s condition worsens to a degree that reduces any further therapeutic options. Thus, molecular imaging techniques are expected to provide improved outcome parameters for therapy monitoring, which also is relevant for conducting efficient clinical trials of new therapeutics.
18.3.5 Movement Disorders
Parkinson’s disease is the most common of the movement disorders, affecting approximately 1.5 % of people over 65 years and 2.5 % of those over the age of 80. As degeneration occurs in dopaminergic neuron in the substantia nigra, patients exhibit clinical symptoms of resting tremor, rigidity, and bradykinesia. Parkinsonian syndromes are a group of diseases that share similar cardinal signs of parkinsonism.
Although the neurodegenerative condition Parkinson’s disease is the most common cause of parkinsonism, numerous other etiologies can lead to a similar set of symptoms, including multiple system atrophy, progressive supranuclear palsy, corticobasal degeneration, drug-induced parkinsonism, vascular parkinsonism, and psychogenic parkinsonism. Essential tremor typically occurs during voluntary movement rather than at rest; however, some patients with essential tremor can demonstrate resting tremor, rigidity, or other isolated parkinsonian features, mimicking other etiologies. Clinical diagnosis of parkinsonism is often straightforward, obviating additional tests in many cases. However, for incomplete syndromes, or an overlap between multiple concurrent conditions, particularly early on, an improvement in diagnostic accuracy may be possible using a test for dopamine transporter (DaT) visualization [24–26].
18.3.6 Hydrocephalus
18.3.6.1 Anatomy and Physiology of Hydrocephalus
CSF is a clear fluid similar to blood plasma. The intracranial and spinal cord structures float in CSF and are protected from jolts and blows. Principally, the choroid plexus in the lateral, third, and fourth ventricles produces the major portion of CSF. Normally, between 125 and 150 mL of CSF is circulating within the ventricles and subarachnoid space at any given time. Approximately 600 mL of CSF is produced daily. The CSF normally drains from the lateral ventricles sequentially through the interventricular foramen of Monro, the third ventricle, and the cerebral aqueduct of Sylvius into the fourth ventricle and then leaves the ventricular system through the median foramen of Magendie and two lateral foramina of Luschka. Here, the CSF enters the subarachnoid space. Along the base of the brain, this space extends into a number of lakes called cisterns. The CSF is absorbed through the pacchionian granulations of the pia-arachnoid villi into the superior sagittal sinus.
The term hydrocephalus generally refers to those conditions that produce an imbalance between the rate of production and absorption of the cerebrospinal fluid, leading to dilatation of the ventricular system. Hydrocephalus normally occurs as a result of obstruction to the flow and absorption of CSF, although there are rare cases of choroid plexus papillomas causing hydrocephalus by the overproduction of CSF.
Hydrocephalus is traditionally classified as communicating and noncommunicating, based on whether ventricular obstruction is present. In the former, the ventricular system continues to communicate with the subarachnoid spaces outside the brain through the fourth ventricular foramina of Luschka and Magendie.
Noncommunicating hydrocephalus correspondingly refers to the presence of occlusion within the ventricular system. Hydrocephalus may be either congenital or acquired. Arnold–Chiari malformation, Dandy–Walker malformations, and aqueductal stenosis/atresia are common causes of the congenital variety. In the acquired type, many pathologic conditions, including inflammatory, infectious, traumatic, and neoplastic disorders, can cause hydrocephalus [27].
18.3.6.2 Pathology Causing Hydrocephalus
Noncommunicating hydrocephalus can be the result of intraventricular mass, aqueductal obstruction, or fourth ventricular obstruction. Communicating hydrocephalus, on the other hand, results from meningitis, meningeal carcinomatosis, or cerebral dural sinus thrombosis, or it is idiopathic in elderly patients. Normal-pressure hydrocephalus (NPH) is a communicating hydrocephalus of particular interest to nuclear medicine professionals since radionuclide cisternography is useful in its diagnosis and management. In NPH, the usual flow of CSF is impaired somewhere in the intracranial subarachnoid space, resulting in a reversal of CSF flow and dilatation of the lateral ventricles. There is free communication between the ventricular system and the subarachnoid pathways and no elevation of CSF pressure. Clinically, the entity presents as dementia, gait disturbances, and fecal and urinary incontinence. Most commonly, this condition results from subarachnoid hemorrhage or meningoencephalitis.
18.3.6.3 Cerebrospinal Fluid Leakage
Leaking of CSF may be etiologically classified into:
1.
Traumatic: occurring in about 30 % of basilar skull fractures. Two percent of all head injuries develop a CSF fistula. This leak is usually unilateral, scanty, seen within 48 h after trauma, and resolves in 1 week.
2.
Nontraumatic: taking place in tumors (pituitary, brain, skull), skull infections, and congenital defects (encephalocele). This leak is profuse and may persist for years. Infection complicates the untreated leak in 25 % of the cases. CSF rhinorrhea may occur anywhere from the frontal sinus to the temporal bone. The cribriform plate is the most susceptible to fracture and rhinorrhea. Otorrhea is much less common [28, 29].
18.4 Scintigraphic Evaluation of CNS Diseases
18.4.1 Radiopharmaceuticals
There are three main classes of radiopharmaceuticals now available for functional brain imaging in nuclear medicine (1) regional cerebral blood flow, (2) regional cerebral metabolism, and (3) central nervous system receptor binding and other molecularly targeted agents. After intravenous injection, the regional uptake and distribution of radiotracers are measured by single-photon emission computed tomography (SPECT) or positron emission tomography (PET) imaging systems. In this chapter, we describe the most important tracers routinely employed in clinical nuclear medicine practice. More comprehensive descriptions of radiopharmaceuticals for brain imaging have been provided in numerous prior reports [33–35].
SPECT radiopharmaceuticals used for measuring regional cerebral blood flow (rCBF) are lipophilic agents which are transported from the arterial vascular compartment to the normal brain tissue compartment by diffusion and are distributed proportional to regional tissue blood flow. After this first phase of transport, the tracers are essentially irreversibly trapped in the tissue compartment. The two major blood flow agents used in brain SPECT imaging are technetium-99m hexamethylpropylene amine oxime (99mTc-HMPAO) and Tc-99 m ethyl cysteinate dimer (99mTc-ECD) [36, 37]. Xenon-133 (133Xe) is unique since it is freely diffusible and not trapped in the tissues. Inhaled or IV injection of 133Xe dissolved in saline can more accurately and quantitatively provide measurements of blood flow by determination of the clearance rate of this tracer from the cerebral compartment, after a brief uptake period (Lassen) [38]. The major PET radiopharmaceutical used to measure cerebral perfusion is 15O-water [39].
The second major class of radiopharmaceuticals is those that measure brain metabolism. These radiopharmaceuticals are transported to the brain tissues by regional cerebral blood flow, but subsequent regional cerebral distribution reflects the utilization rate of the tracer in a cerebral metabolic pathway. Currently, there are no SPECT tracers that specifically measure normal cerebral metabolism. However, in brain tumor imaging, where the blood–brain barrier is broken, ionic tracers such as Thallium-201(201Tl) [40] or other SPECT tracers such as 99mTc- methoxyisobutyl 99mTc-sestamibi [41] can be used to detect new, recurrent, or residual viable tumor. The PET radiopharmaceutical predominantly used is fluorine-18 2-fluoro-2-deoxy-d-glucose (18F-FDG), [42]. [18F]-fluoro-3′-deoxy-3′-l-fluorothymidine (18F-FLT) is a new tracer used to indicate tumor proliferation to more specifically identify new, recurrent, or residual viable brain tumor. Other tracers being used in research include amino acids and amino acid analog PET tracers like 11C-methionine (11C-MET) and 3,4-dihydroxy-6-18F-fluoro-l-phenylalanine (18F-FDOPA).
The third class of radiotracers important in brain imaging is central nervous system receptor binding agents, which measure neuronal receptor density and binding affinity [26]. In SPECT, a tracer which has been well characterized is 123I-β-CIT. This benzamide compound has been used to image the dopaminergic (D2) transporter system in the corpus striatum [43]. In the United States, 123I-ioflupane (123I-FP-CIT) SPECT radiotracer dopamine receptor imaging was approved by the Food and Drug Administration on January 2011 and is commercially available. It has now been established as a standard part of diagnostic assessment in movement disorders [44].
Numerous reviews have been published describing PET tracers that have been developed for application in brain PET imaging, primarily for brain receptor studies or metabolic incorporation into essential biochemical pathways [45, 46]. After IV injection, these tracers initially follow first-order kinetics compartmental distribution since their delivery depends on cerebral blood flow. Over time, there is clearance of nonspecific uptake, and the delayed scan reflects specific receptor binding.
18.4.1.1 99mTc- Hexamethylpropyleneamine Oxime (99mTc-HMPAO)
To understand the uptake mechanism of 99mTc-hexamethylpropyleneamine oxime (99mTc-HMPAO), a three-compartmental analysis model can be used for analysis [47]. In this model, the first compartment is the lipophilic tracer in the blood pool of the brain, but outside of the blood–brain barrier. The second compartment is consisting of the lipophilic tracer inside of the blood–brain barrier. The third compartment is the hydrophilic form of the tracer that is retained in the brain. Transport from the first compartment to the second compartment represents efflux of lipophilic tracer from the blood compartment to the brain compartment. Back-exchange from the third compartment to the second compartment represents back-diffusion of the lipophilic form of the tracer and is essentially equal to zero since the tracer is irreversibly trapped (by intracellular reaction with glutathione) in the brain. Figure 18.6 shows a normal brain SPECT scan after injection of 20 mCi (740 MBq) IV of 99mTc-HMPAO and acquired on a triple-head Picker Prism (Picker International, Cleveland, OH). There is noted to be excellent uptake of this tracer in the gray matter of the brain, and there is clear distinction of small brain structures.
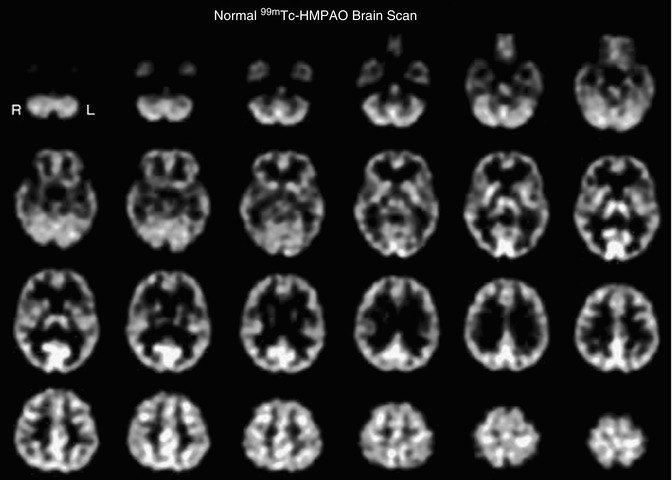
Fig. 18.6
Transverse tomographic images from a normal 42-year-old female subject after injection of 20 mCi 99mTc-HMPAO. The transverse images are arranged parallel to and sequentially above the canthomeatal line, with the cerebellum at the top left and the vertex of the brain at the bottom right. The scan slice thickness is 4 mm. The scan resolution is approximately 7-mm full width at half maximum. There is seen to be high uptake of tracer in the cerebellum (top row), the thalamus and basal ganglia (2nd row from top), and the primary visual cortex (2nd and 3rd row from top). There is high uptake in all cortical structures compared to white matter. This is expected since the white matter physiologically has approximately 25 % lower blood flow than gray matter. The ventricles in this patient are extremely small, and the central reduction in tracer uptake is almost completely due to lower uptake in the white matter. These differences in uptake bestow the functional scan with anatomic definition
18.4.1.2 Technetium-99m Ethyl Cysteinate Dimer (99mTc-ECD)
The second tracer commonly used in brain SPECT to measure regional cerebral perfusion is 99mTc-ECD [48]. This radiopharmaceutical is lipophilic, similar to 99mTc-HMPAO, and rapidly traverses the endothelium and capillary membranes into the brain cells [49]. However, in the third compartment irreversible trapping mechanism of this tracer differs from 99mTc-HMPAO, since 99mTc-ECD is enzymatically metabolized to a polar complex, which is trapped in the brain. This tracer has been reported to demonstrate less nonspecific scalp and facial tissue background activity compared with 99mTc-HMPAO. Figure 18.7 shows a normal 99mTc-ECD scan brain SPECT scan after injection of 20 mCi (740 MBq) IV. However, it has been reported that there are differences in regional uptake of these tracers, predominantly in the thalamus and the cerebellum.
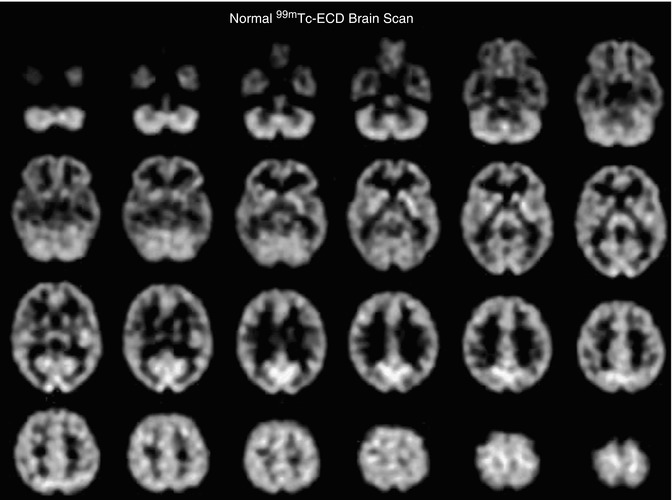
Fig. 18.7
Transverse tomographic images from a normal 41-year-old female subject after injection of 20 mCi 99mTc-ECD. The transverse images are arranged parallel to and sequentially above the canthomeatal line, with the cerebellum at the top left and the vertex of the brain at the bottom right. The scan slice thickness is 4 mm. The scan resolution is approximately 7-mm full width at half maximum. While the distribution of 99mTc-ECD is similar to 99mTc-HMPAO, it is not identical, as described in the text
This difference in distribution is illustrated by scans from a 42-year-old female normal subject who received both tracers separated by a 48-h time period (Fig. 18.8).
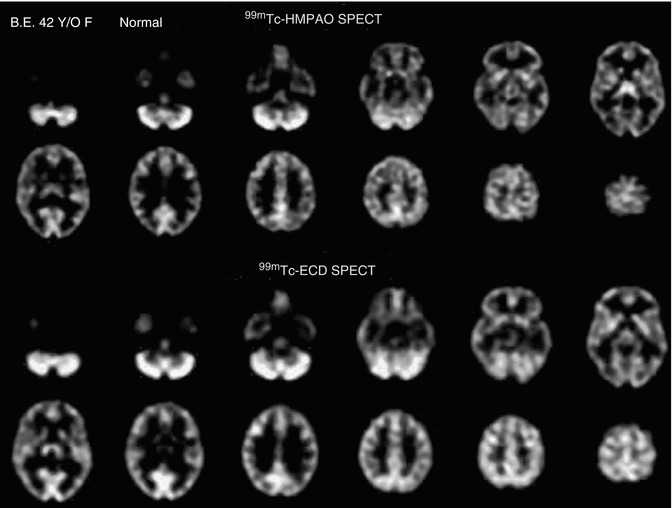
Fig. 18.8
Images of a 99mTc-HMPAO brain SPECT scan (top) compared with a 99mTc-ECD brain SPECT scan (bottom) from a 42-year-old normal female. The 99mTc-HMPAO SPECT scan was oriented parallel to and sequentially above the canthomeatal line (rows 1 and 2). The 99mTc-ECD brain SPECT scan from the same patient was count normalized and spatially co-registered with the 99mTc-HMPAO SPECT scan and corresponding sections are displayed in rows 3 and 4 to facilitate comparison. Each scan section is 8 mm thick. The 99mTc-HMPAO brain SPECT scan shows increases in tracer uptake in the thalami but less uptake in the parietal and occipital regions, as compared to the 99mTc-ECD brain SPECT scan
18.4.1.3 133Xe for Quantitative Regional Cerebral Blood Flow
A recent advancement in brain SPECT imaging has been the development of special software primarily used on the Picker Prism triple-head camera system which allows dynamic scan acquisition (10 s per scan for 7 min). This acquisition results in a total of 42 scans of temporally separated individual tomographic image data sets. This allows calculation of tomographically displayed absolute quantification of regional cerebral perfusion (rCBF) in milliliters per 100 g of tissue per minute [50]. This is possible since the clearance of 133Xe is linearly proportional to the rCBF, and unlike tracers such as 99mTc-HMPAO or 99mTc-ECD, 133Xe does not underestimate rCBF due to the limitations on extraction fractions at high cerebral blood flow rates. In our experience, we have found that the 133Xe clearance technique is more sensitive to changes in blood flow during Diamox augmentation of rCBF in the evaluation of hemodynamically significant vascular stenosis and in cases of cortical blood flow changes in brain activation studies. One of the major limitations of 133Xe SPECT is the relatively low energy of the emission photon resulting in a significant attenuation and loss of spatial resolution of the central structures of the brain. In addition, due to the rapid SPECT acquisition necessary to obtain accurate clearance on a pixel-by-pixel basis, the count rate is low, requiring use of a 64 × 64 matrix, resulting in reduction in spatial resolution throughout the scan.
Dynamic 133Xe SPECT is excellent in assessing large territorial vascular abnormalities due to its ease of quantitation and its ability to detect large major vessel territorial reductions in regional cerebral perfusion. Its utility is exemplified in a study designed to measure cerebrovascular perfusion reserve with rest/stress SPECT brain scans in patients with cerebrovascular disease (CVD) and suffering from TIA undergoing evaluation for extracranial/intracranial (EC/IC) arterial anastomosis or superficial temporal artery (STA)/middle cerebral artery (STA/MCA) bypass to assess and to specifically identify the presence or the absence of a vascular reserve constraint, which has been previously documented to be of value using increased oxygen extraction fraction PET [51]. Figure 18.9 illustrates the imaging results of a 62-year-old female with TIA. The angiogram showed the presence of a 99 % left ICA stenosis. The 133Xe SPECT study confirms the presence of hemodynamic vascular reserve constraint due to a high-grade stenosis of the left internal carotid artery.
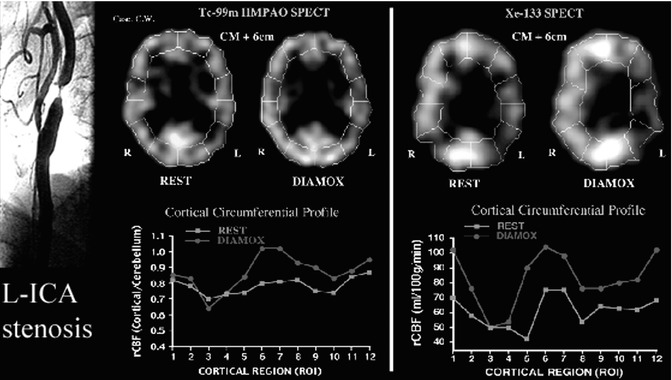
Fig. 18.9
Case of severe ischemia in a 62-year-old female with 99 % stenosis of the left ICA (left). The resting-state 99mTc-HMPAO SPECT scan (middle) was normal. The post-Diamox 99mTc-HMPAO SPECT scan (middle) showed mild perfusion reduction in the left ICA territory (middle). This can be seen on the circumferential graphs (regions 3 and 4 shown on the red graph). The 133Xe SPECT at rest showed mild vascular compromise (right). The post-Diamox 133Xe SPECT showed severe vascular constraint in the left ICA territory (right). This can be seen as a more clear reduction compared with the 99mTc-HMPAO SPECT scan (regions 3 and 4 shown on the circumferential red graph)
In a study on nine CVD patients, 99mTc-HMPAO SPECT was found to be a more specific indicator of hemodynamic constraint since it was asymmetric only in cases of severe ischemia [52]. 133Xe SPECT detected asymmetries, even in the mild ischemic group, and therefore is a more sensitive detector of vascular disease. Because 133Xe SPECT measures absolute rCBF (ml/100 g/min), it has one major advantage (i.e., to measure absolute perfusion) and thus can establish parameters of significant ischemia independent from semiquantitative asymmetry values.
18.4.1.4 15O-water for Quantitative Regional Cerebral Perfusion Measured by PET
Dynamic 15O-water PET scans with arterial sampling provide the ability for the quantitative assessment of regional cerebral perfusion. Each emission scan is short, approximately 3 min in duration. Data are typically analyzed using a 1-tissue-compartment model to obtain K1 (mL/min/mL), and quantification is expressed in standard units of ml/100 g/min [53].
The PET scan shown in Fig. 18.10a was acquired on a Siemens/CTI ECAT HR + scanner in 3D imaging mode (63 parallel planes); axial field-of-view, 15.2 cm; in-plane resolution, 4.1-mm full width at half maximum; and slice width, 2.0 mm. The scanner gantry is equipped with a Neuro-insert (CTI PET Systems, Knoxville, TN) to reduce the contribution of scattered photon events. PET data was reconstructed using filtered back-projection (Fourier rebinning and 2D back-projection with Hann filter: kernel FWHM = 3 mm). Data was corrected for photon attenuation, scatter, and radioactive decay. A windowed transmission scan (10–15 min) was obtained for attenuation correction using rotating 68Ge/68Ga rods, and a model-based correction was applied to account for the 3D scatter fraction. The final reconstructed PET image resolution was about 6 mm (transverse and axial planes). PET–MRI fusion images shown in Fig. 18.10b are obtained from the MRI data that were transferred to the PET facility and co-registered to the dynamic 15O-water PET scans by automated image registration (AIR) software [54].
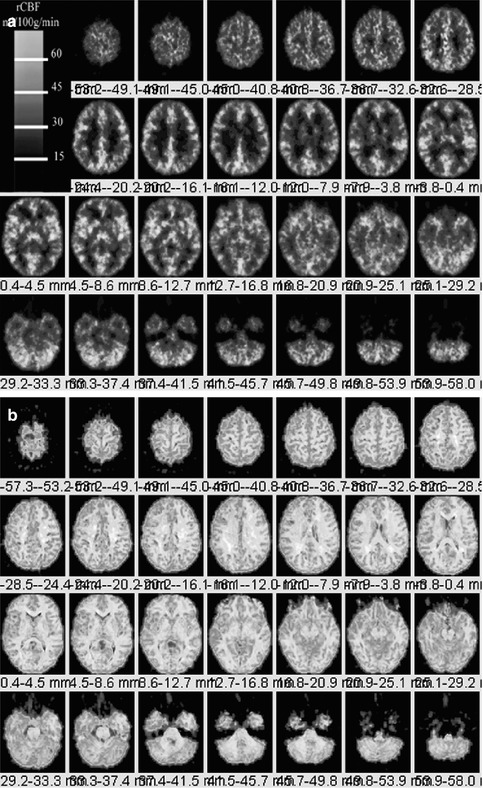
Fig. 18.10
(a) Left. Dynamic 15O-water PET scan from the top of the brain (top left) through the cerebellum (bottom right) from a 36-year-old normal female volunteer for the measurement of quantitative regional cerebral perfusion. PET scan are obtained from a Siemens CTI ECAT HR + operating in 3D mode. Regional cerebral blood flow (rCBF) quantified in units of ml/100 g/min (color bar). (b). Right. PET scan shown in Fig. 18.10a is co-registered using the automated image registration software onto a spoiled gradient echo (SPGR) MRI data volume (1-mm-thick MRI sections) resectioned and co-registered using the AIR routine to the 15O-water PET scan. Careful examination reveals increased blood flow localized to the gray matter regions of brain
18.4.1.5 Thallium-201(201Tl)
201Tl in the form of thallous chloride is a cyclotron produced radiopharmaceutical shown to have affinity for brain tumors as early as the 1970s [55]. Although more commonly used as a myocardial perfusion imaging agent, thallium has high sensitivity for detection of new, recurrent, or residual viable tumor, which is difficult to differentiate from postradiation necrosis and edema on CT or MRI.
Thallium decays by electron capture with a half-life of 73 h and emits photons with a range of 0.78–167.4 keV [56]. The useful energy for imaging is at 80 keV corresponding to mercury x-rays when thallium decays to stable Hg-201. In its intravenous form, 201Tl is supplied in isotonic solution at pH 4.5–7.0 and contains NaCl for isotonicity and 0.9 % benzyl alcohol as a bactericidal agent [57]. The uptake of thallium in normal tissues has been hypothesized to act as a potassium analog. Both elements belong to group IIIA of the periodic table. The distribution and retention of 201Tl in the normal brain and tumors is an active process related to blood flow, loss of integrity of the blood–brain barrier, tumor cell viability, tumor type, tumor cell membrane function, and the Na+–K+ ATPase pump activity.
Normal brain tissues show minimal to no uptake of 201Tl. The normal physiological distribution in the head and neck region includes the scalp, lacrimal gland, nasopharyngeal area, salivary gland, and the pituitary gland. There is also minimal thallium uptake in the choroid plexus. Thallium is normally taken up by regions of the brain which do not have a blood–brain barrier (BBB) such as the pituitary gland and pineal gland and minimally taken up by the choroid plexus (Fig. 18.11). The evaluation of viable tumor can be performed with great accuracy using brain SPECT or brain PET imaging. Brain SPECT imaging employs the tracer 201Tl to detect new, residual, or recurrent viable tumor due to the fact that there is transport of 201Tl across the breakdown in the blood–brain barrier and uptake of 201Tl into regions of hypermetabolism. 201Tl is postulated to represent “potassium analog” with affinity for the sodium–potassium ATPase enzyme [58]. Thallium accumulates in the residual or recurrent viable tumor cells in proportion to malignant grade and total viable tumor bulk.
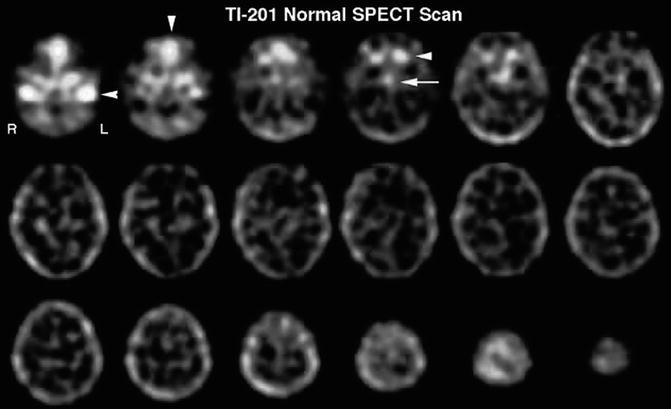
Fig. 18.11
SPECT scan of 201Tl in the normal brain. Uptake of 201Tl in the normal brain is very low. It is important to note that there is significant uptake by some of the structures just inferior to the cranium, which can interfere with the positive detection of tumor in the inferior frontal and inferior midportions of the brain. There is significant uptake in the jugular veins (row one, image one, arrow), the nasopharynx (row one, image two, arrow), and the salivary glands and pituitary glands (row one, image four, arrowhead and arrow, respectively)
18.4.1.6 99mTc-Hexakis-2-methoxy-2-isobutyl Isonitrile (99mTc-Sestamibi)
Tc-99m Hexakis-2-methoxy-2-isobutyl isonitrile is a monovalent cation complex formed by a central technetium atom surrounded by six 2-methoxy-2-isobutyl isonitrile groups. This compound is also used extensively in myocardial perfusion imaging. The normal brain tissue shows minimal uptake of 99mTc-sestamibi. The normal physiological distribution in the head and neck region is similar to that of thallium and includes the scalp, nasopharyngeal area, salivary gland, and pituitary gland. There is notable significant choroid plexus uptake, much greater when compared to 201Tl. The choroid plexus uptake may be due in part from the pertechnetate in the solution that is known to be actively taken up and secreted by the cells. This may account for secretion into the CSF and the presence of activity in the 4th ventricle which is visible on careful scrutiny of MIBI brain SPECT images (Fig. 18.12). It is postulated that after crossing the cell membrane MIBI is taken by the mitochondria in relation to negative electric potential. Normal myocardial uptake of MIBI depends on blood flow and the uptake of the mitochondria in metabolically active tissue. In brain tumors, the mechanism of tumor uptake is also thought to be dependent on mitochondrial activity and the presence of P-glycoprotein [59].
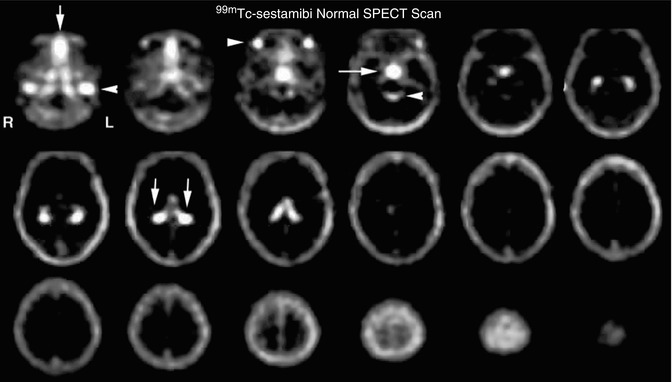
Fig. 18.12
Normal 99mTc-MIBI brain SPECT scan. The figure shows very low uptake of MIBI in the normal brain. However, similar to the thallium brain SPECT scan, there are several structures just inferior to the cranium which can interfere with accuracy of tumor recurrence identification. As seen in the normal 201Tl brain SPECT scan, there is intense uptake in the jugular veins (row one, image one, arrow) and the nasopharynx (row one, image one, arrow). There is also intense uptake in the salivary glands (row one, image three, arrow) and the pituitary gland (row one, image three, arrow). In addition, there seemed to be increased uptake in the ambient cistern (row one, image four, arrow) due to secretion of significant 99mTc-MIBI through the choroid plexus (row two, image two, arrows). This secretion by the choroid plexus often significantly limits the utility of this tracer in the detection of recurrent tumor since many tumors tend to recur in the region of the basal ganglia
18.4.1.7 2-[F-18]-Fluoro-2-deoxy-d-glucose (18F-FDG)
A 36-year-old normal female volunteer underwent a fully dynamic 18F-FDG PET with arterial sampling at rest as shown in Fig. 18.13. 18F-FDG PET scan image slice thickness = 2.0 mm and reconstructed in-plane image resolution = 4 mm FWHM. The 18F-FDG PET data is acquired over 90 min (34 frames) with arterial blood sampling throughout the scan period. The method of quantitative assessment of 18F-FDG PET has been well established [60–64].
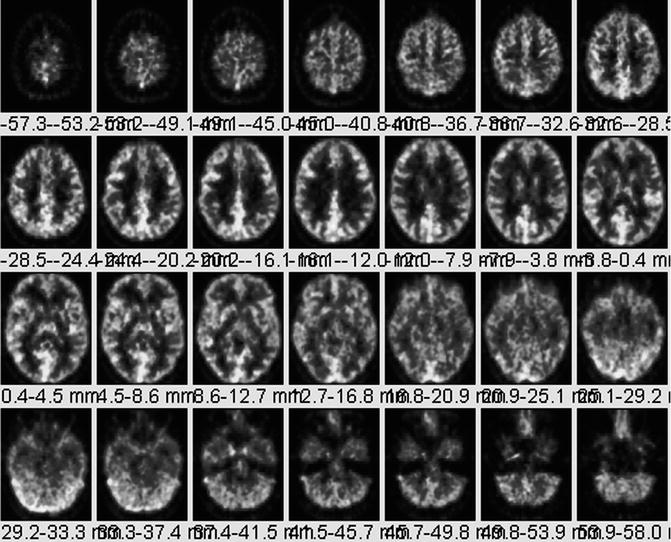
Fig. 18.13
Normal 18F-FDG PET. A 36-year-old normal female volunteer underwent fully dynamic 18F-FDG PET with arterial sampling at rest. For purposes of comparison of a normal scan to tumor, 18F-FDG brain PET can be nonspecific since low-grade tumors produce areas of reduced metabolism relative to normal gray matter. High-grade brain tumors may produce areas of uptake equal to or only slightly greater than gray matter
18F-FDG PET has led to a more widespread capability in allowing evaluation of cerebral neoplasms as well as other diseases of the brain which were previously imaged using SPECT radiopharmaceuticals [65, 66]. In addition, due to the relatively long half-life of 18F (109 min), it can be transported regionally (within approximately 2–4-h travel time from a cyclotron production facility) enabling a centrally located production facility to supply several camera sites.
18.4.1.8 l-[Methyl-11C] methionine (11C-MET)
A PET amino acid isotope, l-[methyl-11C] methionine (11C-MET) [67] has a relatively short half-life of 20 min. The tracer’s use requires a nearby cyclotron. A study by Hustinx et al. explains its potential role in differentiating tumor recurrence from radiation necrosis [68]. The extent of tracer uptake is greater than the degree of contrast enhancement indicative of better delineation of tumor margins [69].
The tracer uptake has been shown to correlate with prognosis and survival in low-grade gliomas [70, 71], where the uptake is increased in the absence of BBB breakdown which is a significant advantage over CT, conventional MRI, and 18F-FDG PET [72, 73]. In high-grade gliomas, 11C-MET uptake is greater than in low-grade tumors [74–76] establishing its potential for use in monitoring anaplastic transformation.
In a study of 21 patients with brain metastases status post stereotactic radiosurgery, the tracer accurately identified 7 of 9 recurrences and 10 of 12 radiation injuries [77]. A combined 18F-FDG and 11C-MET study for stereotactic biopsy of 32 unresectable glioma patients demonstrated that 11C-MET generates a more sensitive signal, making it a potential single-tracer PET agent for neurosurgical intervention of gliomas [78].
A study by Ullrich et al. shows that increased 11C-MET uptake during tumor growth parallels an upregulation of angiogenic markers such as vascular endothelial growth factor (VEGF) [79]. A study by Yamane et al. talks about the clinical impact of 11C-MET and that the addition of 11C-MET PET changed patient management [80].
18.4.1.9 O-(2-[18F] fluoroethyl)-l-tyrosine (18F-FET)
O-(2-[18F] fluoroethyl)-l-tyrosine (18F-FET) is a PET tracer studied for its potential role in the differentiation of radiation necrosis and residual tumor. Studies have shown the absence of 18F-FET uptake in a case of radiation necrosis [81], but further systematic studies are necessary to confirm this finding. In contrast to 18F-FDG, 18F-FET uptake was absent from macrophages, a common inflammatory mediator [82]. In another study, the ratio of 18F-FET uptake in radiation necrosis to that in the normal cortex was much lower than the corresponding ratios for 18F-FDG and 18F-choline suggestive of its potential for differentiating radiation necrosis from tumor recurrence [83].
In the last decade, studies on combined 18F-FET and MRI have shown improved identification of tumor tissue as compared to either modality alone [84, 85]. The specificity of distinguishing gliomas from normal tissue could be increased from 68 % with the use of MRI alone to 97 % with the use of MRI in conjunction with 18F-FET PET and MRI spectroscopy [86].
18.4.1.10 3,4-Dihydroxy-6-18F-fluoro-l-phenylalanine (18F-FDOPA)
3,4-dihydroxy-6-18F-fluoro-l-phenylalanine (18F-FDOPA) is an amino acid tracer initially used for the evaluation of movement disorders [87–89] but recently being studied in the imaging of brain tumors. 18F-DOPA crosses the BBB in the normal brain via the neutral amino acid transporter [90, 91]. Although increased sensitivity and specificity of 18F-DOPA over 18F-FDG was shown, no correlation to tumor grade or contrast enhancement was observed [83]. The same study found a tumor-to-normal-brain ratio of less than 1.6 with 18F-DOPA in four cases of radiation necrosis. A recent study showed that correlation between tracer uptake and tumor proliferation was observed only in newly diagnosed gliomas and not in recurrent gliomas [92]. When compared to 11C-MET PET, no significant difference in uptake was shown in either low- or high-grade tumors [93]. Larger series of radiation necrosis cases will be needed for confirmation of these findings, however.
18.4.1.11 18F-Fluoromisonidazole (18F-FMISO)
18F-Fluoromisonidazole is a nitroimidazole derivative PET agent used to image hypoxia [94], a physiological marker for tumor progression and resistance to radiotherapy [95]. Its preferential uptake in high-grade rather than low-grade gliomas [96], a significant relationship with the upregulation of angiogenic markers such as VEGF-R1 [97], and correlation to progression and survival after radiotherapy [98] suggest its potential role in monitoring response to therapy targeting hypoxic tissue.
18.4.1.12 Cell Proliferation Imaging with 18F-FLT PET
3′-deoxy-3′-18F-fluorothymidine (18F-FLT) has been used to indicate tumor proliferation in both preclinical and clinical studies [99, 100]. Transport of 18F-FLT is mediated by both passive diffusion and Na+-dependent carriers. The tracer is subsequently phosphorylated by thymidine kinase 1 (TK1) into 18F-FLT monophosphate where TK1 is a principal enzyme in the salvage pathway of DNA synthesis. Whereas the TK1 activity is virtually absent in quiescent cells, its activity reaches the maximum in the late G1 and S phases of the cell cycle in proliferating cells [101]. The phosphorylation of the tracer by TK1 therefore makes 18F-FLT a good marker for tumor proliferation.
Imaging of brain tumor proliferative activity has been performed using semiquantitative measures of standard uptake values. 18F-FLT imaging can be correlated with stereotactic biopsies representing the Ki-67 proliferation index. Recurrent or residual viable tumor demonstrates increased quantitative 18F-FLT utilization and can provide a useful index to separate residual or recurrent viable tumor from radiation or chemotherapy necrosis. 18F-FLT is more specific for detection of viable tumor proliferation since the background activity in the normal brain is low (Fig. 18.14), unlike 18F-FDG which has a high normal brain background.
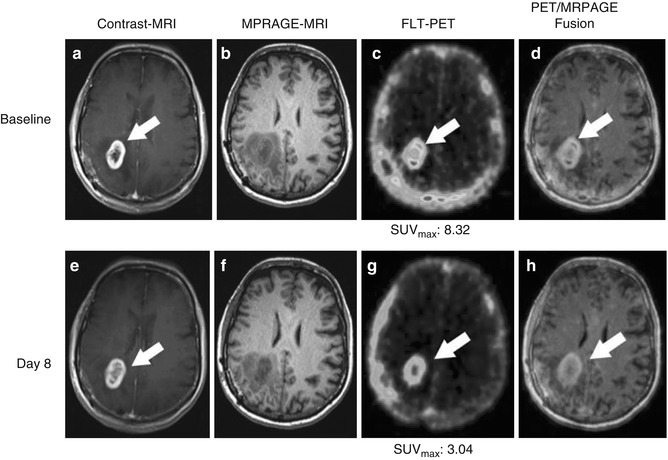
Fig. 18.14
A 64-year-old female patient diagnosed with glioblastoma multiforme of the right parietal lobe, proven by surgical biopsy. 18F-FLT-PET/CT scans was performed 40 min after injection of 185 MBq F-18 3′-deoxy-3′- 18F-fluorothymidine (FLT) with a 30-min acquisition, followed by gadolinium-enhanced MRI [1] (a), T1-weighted MR images; (b), Magnetization-prepared rapid acquisition with gradient echo (MP-RAGE) MR images, arrows). The baseline 18F-FLT-PET/CT scans (c) show high uptake with SUVmax = 8.32. (d) PET MR fusion images. The patient was treated with 6 weeks of temozolomide and a total of 60-Gy radiotherapy (STUPP protocol) [2, 3]. A post-therapy T1 weighted MR (e), post therapy MP-RAGE (f) and post therapy 18F-FLT-PET (g) was acquired 8 days after the initiation of temozolomide and radiotherapy combination to assess early response [4–7]. While MRI (h) shows no substantial change, FLT uptake was significantly decreased after first week of therapy (g) now with SUVmax = 3.04 (From Oborski et al. [162]).
Figure 18.15 demonstrates 1-year follow-up gadolinium-enhanced MRI of patient in image Fig. 18.14.
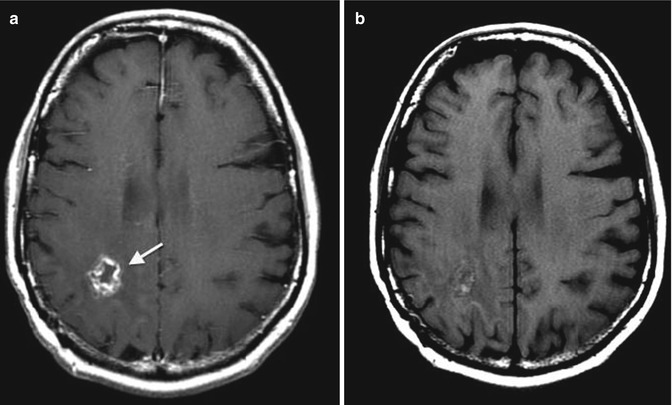
Fig. 18.15
1-year follow-up gadolinium-enhanced MRI of patient in image Fig. 18.14. MRI was repeated every 3–4 months according to European Society for Medical Oncology (ESMO) clinical guidelines. There has been no evidence of disease progression for 1 year of follow-up. The 1-year follow-up MRI shows a cavitary lesion in location of primary tumor, (a) gadolinium-enhanced T1-weighted MR image and (b) T1-weighted spin echo sequence image (arrows) (From Oborski et al. [162])
18.4.2 Scintigraphic Imaging Techniques
18.4.2.1 Image Acquisition
SPECT Image Acquisition
In single-photon emission computed tomography (SPECT) of the brain, triple-head Anger gamma cameras are now in common use and can provide very high-resolution images [approximately 7-mm full width at half maximum (FWHM) extrinsic resolution] [102]. The resolution has improved, primarily, due to the increased count detection capability of these cameras. In addition, these cameras allow faster throughput of patients since the scan time can be decreased. Scanning can be performed in temporal segments, with summation of the projection images at the end of acquisition. This enables salvaging of studies in which patient motion might occur. For example, a 30-min scan can be divided into two 15-min segments, each obtaining a 360° set of projection images. If the patient moves during the last 15-min imaging segment, the first 15-min imaging segment can be used for reconstruction of the complete set of tomographic images. If the patient does not move, both sets of projection images can be summed together to obtain a higher count rate examination. Patient motion occasionally occurs in the evaluation of severe dementia or epilepsy. Fortunately, in many of these cases, the cortical regions under investigation are relatively large, and a scan with only moderate counts or mild motion is still adequate for clinical diagnosis.
In conjunction with the advancements in radiopharmaceuticals and cameras, there have also been advances in computer software. Algorithms for SPECT reconstruction and post-processing are now simplified and more routine which reduces pre-acquisition and post-processing errors by the technologist. In addition, images are DICOM compatible [103], allowing the SPECT imaging computer to be used to store anatomic images from CT or MRI, which permits image registration methods to be routinely employed to compare anatomy and function.
PET Image Acquisition
Subject environmental conditions during the performance of 18F-FDG PET scans should be standardized whenever possible. 18F-FDG PET studies should be performed during “a resting state” (e.g., eyes open, ears un-occluded in a dark room with minimal ambient noise). Procedures to minimize head movement during scan acquisition should be implemented using well-tolerated head immobilization procedures. The use of medications and the behavioral state of patients at the time of the scan also should be carefully taken into account since they may produce changes in cerebral metabolism that could alter 18F-FDG tracer distribution.
The normal brain has high 18F-FDG uptake, and therefore administration of approximately 10 mCi 18F-FDG IV is sufficient. The PET scanner should be of the latest generation, full ring, and multislice to cover the entire brain. The 3D acquisition mode should be used to accommodate lower dosimetery and to improve the count statistics of the data. Measured attenuation correction should be employed. The image should be reconstructed with the standard clinical reconstruction including all necessary corrections (such as for randoms, scatter, and attenuation). Quality control with calibration phantoms should be performed in order to assure qualitative accuracy (e.g., using the Hoffman brain phantom) and quantitative accuracy (e.g., using a uniform cylinder phantom) should be run periodically to assess scanner stability [104].
Dual PET–MRI Acquisition
A Siemens Biograph mMR PET–MRI whole-body human scanner integrates a 3-T Verio MRI and PET scanner. The mMR can acquire simultaneous MR and PET images with the quality of separate PET and MRI scanners (Fig. 18.16). The design allows simultaneous acquisition of MRI and PET data. Using the NEMA 2007 protocol, PET resolution (FWHM) was measured to be 4.0 cm (transverse, 1 cm off center).
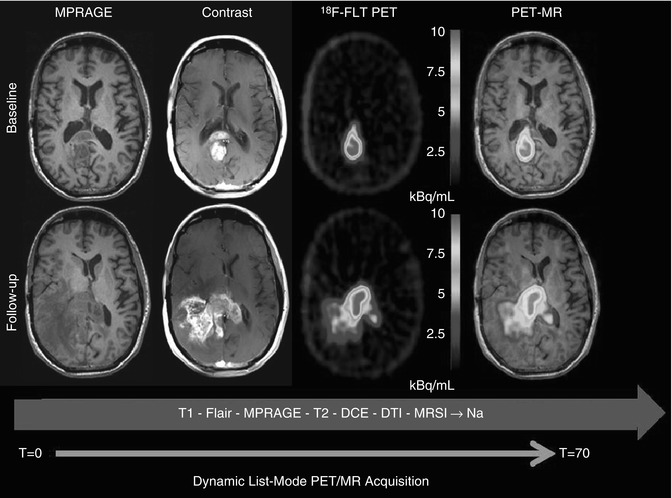
Fig. 18.16
A 42-year-old male with a GBM with baseline scan (top row). Treatment was started with Temodar + veliparib (ABT-888). Two-month follow-up scan (bottom row) shows disease progression on contrast-enhanced MRI and FLT-PET. PET and MR sequence were simultaneously acquired
18.4.2.2 Registration and Analysis Methods
Image Registration
The main techniques for registration of images are use of atlases (e.g., the Talairach atlas [105]) and use of a computer-based automated routine for aligning and reslicing tomographic image data using automated image registration algorithms (AIR) [54].
The Talairach et al. [105] atlas method relies on identification of the anterior (AC) and posterior (PC) commissures of the brain to define the AC–PC line. After the AC–PC line is identified, an origin (O) is defined along this line. A perpendicular line is then drawn from O to the top of the brain. This gives longitudinal and vertical dimensions. The width of the brain is defined from the scan itself. Thus, in this coordinate system, three Cartesian axes are defined, with the edges of the brain identified to yield measurable dimension. When comparing separate patients on SPECT or PET scans, these dimensions are stretched proportionally such that the dimensions of the brain along this axis are the same lengths in all patients.
Automated image registration (AIR) algorithms include computer routines for aligning and reslicing tomographic image data. The typical strategy for AIR is as follows: The brain SPECT or PET scans are converted to analyze format. These analyzed format image sets are resized (spatially co-registered) for conversion of image pixel size and x, y, and z to common units. The registration algorithms are used from a family of automated image registration programs to align image data set to the same position [54]. The images can then be registered into a standardized image spaces, such as the patient’s functional image space or standardized space, such as the Montreal Neurological Institute (MNI) space [106].
An example of the precision to which these techniques can provide image registration between 18F-FDG PET and MRI is illustrated by a 36-year-old normal female volunteer who underwent a resting-state fully dynamic 18F-FDG PET scan with arterial sampling at the University of Pittsburgh PET Center, as shown in Fig. 18.17. A 2-tissue-compartment model was used to analyze the data and spoiled gradient echo (SPGR) MRI volume data (1-mm-thick MR sections) were transferred to the PET facility over the electronic network from the MRI center and registered with the PET data. MR data were spatially normalized and sectioned in the patient’s PET space to preserve the maximum resolution of the original PET data. 18F-FDG PET scan image slice thickness = 2.0 mm with reconstructed in-plane image resolution = 4-mm FWHM. The 18F-FDG PET data is acquired over 90 min (34 frames) with arterial blood sampling for each scan time period.
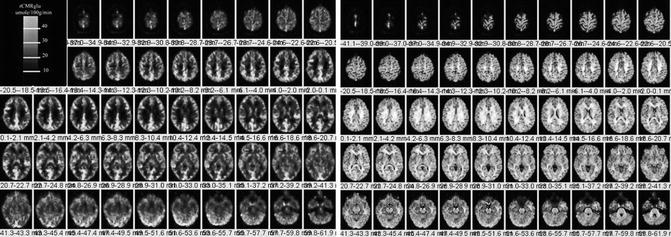
Fig. 18.17
Left. 18F-FDG PET scan sections through the brain (left) and corresponding PET–MRI co-registered fusion images (right). Images are from a 36-year-old normal female volunteer who underwent fully dynamic 18F-FDG PET with arterial sampling at rest. Regional cerebral metabolic rates of glucose utilization expressed as rCMRglu in units of micromole/100 g/min (color bar). PET images are registered to a spoiled gradient echo (SPGR) MRI volume data (1-mm-thick MR sections) that were transferred to the PET facility over the electronic network and registered with the PET data. The 18F-FDG PET scan image slice thickness = 2.0 mm with reconstructed in-plane image resolution = 4-mm FWHM. Right. MRI–PET fusion image. In general, the fusion technique is clinically helpful to assess structural versus functional changes on 18F-FDG brain PET scans or regional cerebral blood flow brain SPECT scans
SPECT and PET Image Analysis
Statistical parametric mapping (SPM) refers to the construction and assessment of spatially extended statistical processes used to test hypotheses about functional imaging data. In rCBF SPECT or 18F-FDG PET image data analysis, this translates to methods to test hypotheses about regionally specific effects (e.g., the probability of finding a region of increased regional cerebral perfusion or metabolism by chance). It was originally developed in the early 1980s by Friston et al. [107] for the routine statistical analysis of functional neuroimaging data from PET. When two image data sets are evaluated by SPM, all voxels contained within the scans are compared in the same space on a voxel-by-voxel basis using linear constraints to test hypotheses for specific focal effects using a univariate statistical test. The resulting statistical parameters are then assembled onto an image (i.e., the statistical parametric map). Statistical differences are interpreted as regionally specific effects, attributable to some alteration in brain function from one scan to the other. The significance of these differences is assessed using statistical tests (usually the t or F statistic). Criteria for accepting voxels (those intended to represent true changes in regional cerebral perfusion) can be set for voxel height (p) and extent of contiguous cluster of voxels (k). For visualization of the results, a pseudo-color scale can be applied to accepted significant voxels, which are then overlayed in a semitransparent fashion onto the MRI of either the normative atlas or the patient’s own MRI anatomy. The most recent version of SPM (SPM2) combines the general linear model to create the statistical map and the random field theory to make statistical inference about regional effects. Software for SPM analysis is available as Freeware from the Welcome Department of Imaging Neuroscience [108]. Although the SPM package includes most of the programs required for image processing and analysis, visualization of images and some processing or image editing and reformatting may require more dedicated biomedical image processing software.
Statistical parametric mapping was performed to compare the regional distribution of 99mTc-HMPAO brain SPECT scans with 99mTc-ECD brain SPECT scans in normal patients [109]. All patients were screened for drug use, head injury, medication status, and other psychiatric or mental illnesses. The two groups were matched for age, sex, and race, and analysis was performed on a group of 35 normal patients undergoing 99mTc-HMPAO brain SPECT scans and 55 patients undergoing 99mTc-ECD brain SPECT scans. Statistical parametric mapping was performed after the patients’ data were spatially normalized to a standardized stereotactic atlas (Talairach atlas). The results showed that these tracers had differences in their regional perfusion patterns, presumably due to the differences in the pharmacokinetics of tracer extraction and trapping. Specifically, large areas of the parietal, occipital, and superior temporal cortices demonstrated lower uptake in the 99mTc-HMPAO brain SPECT scan group as compared to the 99mTc-ECD brain SPECT scan group. There were increases in tracer uptake seen in the subcortical nuclei, thalami, and parts of the brainstem and hippocampus as well as small areas of the cerebellum in the 99mTc-HMPAO group as compared to the 99mTc-ECD group. The importance of this study is to point out that, when performing rCBF SPECT, one should be aware of the differences in the perfusion pattern. In cases of repeat studies, these data suggest that one tracer cannot be substituted for the other.
18.4.3 Clinical Applications
18.4.3.1 Cerebrovascular Disease
Nuclear medicine techniques have been used for the past 55–60 years to investigate cerebrovascular diseases and stroke mainly through tomographic applications, such as positron emission tomography (PET) and single-photon emission computed tomography (SPECT) [110]. It is ironic that tracers which directly measure regional cerebral perfusion have not assumed greater clinical application in the evaluation of cerebrovascular disease. This is partly due to the fact that, in many cases, the identification of a poststroke blood flow defect has not provided unequivocal useful clinical information beyond that offered by neurological exam combined with CT or MRI. Furthermore, the use of rCBF tracers in patients with TIA has had unclear clinical usefulness since a rest perfusion scan may not provide significant additional clinical information beyond the neurological examination.
Hemodynamic Vascular Constraint
In a recent study of 64 patients in which cerebral perfusion and vascular reactivity were assessed before and after carotid endarterectomy using Diamox-enhanced SPECT, the authors concluded that Diamox SPECT assessment of vascular reserve was of value in identification of patients at risk for stroke [111]. After carotid endarterectomy, these patients underwent repeat SPECT which confirmed improvement in vascular reactivity. Therefore, Diamox SPECT scans may provide objective evidence for the selection of patients with a high-grade asymptomatic carotid stenosis who will benefit from carotid endarterectomy [111].
The standard vasoreactive stress protocol is to first perform a resting-state 99mTc-HMPAO brain SPECT scan to assess the blood flow to the vascular territories of the brain. In many cases in patients with TIA, the blood flow is often symmetric or may show small regions of cortical hypoperfusion due to small embolic infarctions. The vasoreactive challenge SPECT is performed either by using the same dose of 99mTc-HMPAO after a 24–48-h wait or by using a much higher dose than the initial dose (the so-called low-dose/high-dose method). The main problem with this method is that, in order to comply with regulatory requirements pertaining to the total amount of injected 99mTc-HMPAO, the low-dose scan usually has relatively poor count statistics. Therefore, it is best to perform the rest–vasoreactive comparative test on 2 separate days using the same dose. After the intravenous administration of 1 g of Diamox and waiting 15 min, there is an increase in CO2 in the brain which causes dilatation of the vasculature. There is an increase in the blood flow to the normal brain of about 30 %, and areas of hemodynamic constraint can be identified since CVD patients may be at the limit of their vasoreactive reserve before Diamox and, therefore, will illustrate no increase in perfusion as compared to normal vascular territories of the brain which can accommodate a 30 % increase in blood flow.
Figure 18.18 illustrates the clinical utility of vasoreactive challenge rCBF SPECT in a 58-year-old man who presented with transient ischemic attack characterized by transient neurological deficits in motor function of the right upper and right lower extremities. On angiography, there was 100 % narrowing of the left internal carotid artery. The MRI scan was normal. The resting-state 99mTc-HMPAO (pre-Diamox) brain SPECT scan showed only mild decrease in perfusion. The post-Diamox vasoreactive stress scan showed a large region of decreased regional cerebral perfusion in the left frontal, temporal, and parietal lobes representing severe rCBF compromise in the distribution of the left internal carotid artery. This patient subsequently underwent left ICA balloon angioplasty. A follow-up rest and vasoreactive challenge rCBF SPECT indicated that all regions of the brain increased in blood flow as a result of Diamox flow augmentation and the left internal carotid artery vascular territory was no longer constrained. It is important to diagnose areas of hemodynamic vascular constraint since patients with this degree of vascular compromise have significant risk for sudden infarction in addition to a chronic risk for selective neuronal loss and vascular dementia. Figure 18.19 shows 99mTc-HMPAO (pre- and post-Diamox) brain SPECT images of a 52-year old male with acute and chronic infarction in the region of right MCA territory. Post diamox images demonstrate a more severe constraint in the region of right frontal lobe as compared to pre diamox study. Figure 18.20 shows rest and post diamox stress 99mTc-HMPAO SPECT images, and subtraction images fused with MR of 60-year-old female with transient left-sided weakness and facial droop. There is decreased radiotracer uptake in right ICA territory on Diamox stress images. This is further demonstrated on Subtraction images.
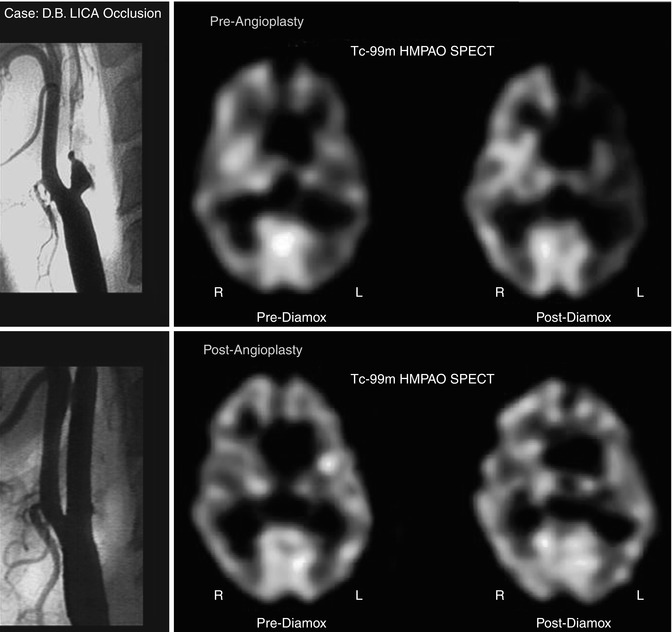
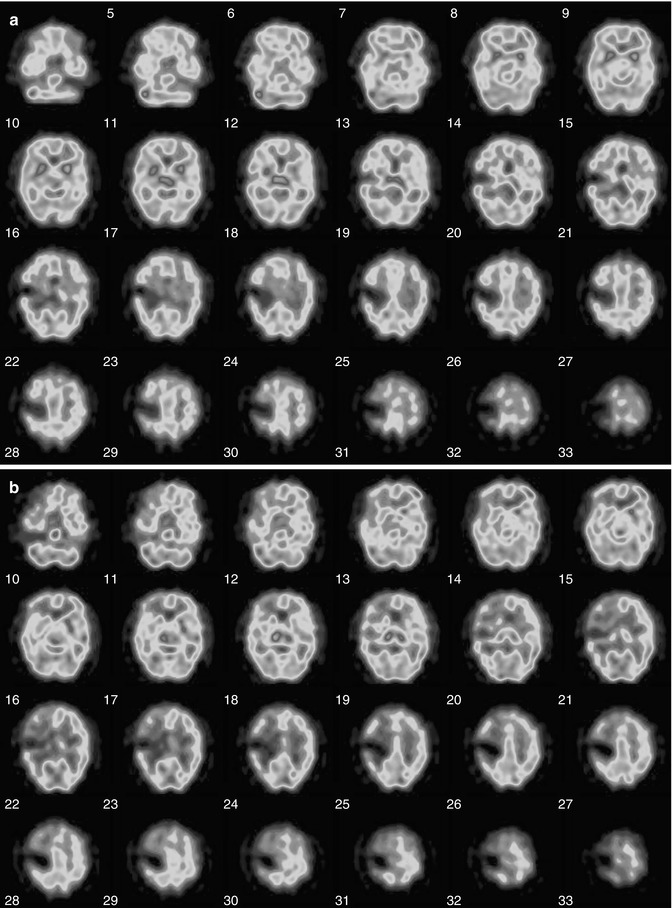
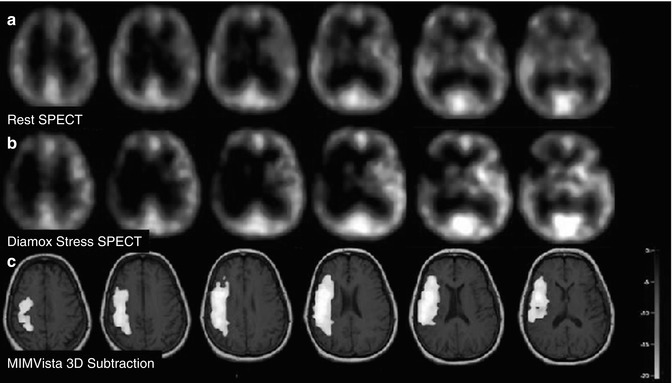
Fig. 18.18
Angiogram showing complete left ICA occlusion in a patient with transient ischemic symptoms (top, left). The resting scan (top, middle) shows slight reduction of blood flow to the left ICA distribution. The post-Diamox scan (top, right) shows significant relative reduction of rCBF to the left ICA territory as compared to the remainder of the brain. The bottom row of images shows the results after angioplasty. The angiogram (bottom, left) now shows a patent left internal carotid artery. The resting 99mTc-HMPAO brain SPECT scan (bottom, middle) shows a more symmetric perfusion of tracer distribution at rest. More importantly, after Diamox, there is no relative reduction in the left hemisphere as compared to the right hemisphere (bottom, right)
Fig. 18.19
(a) 99mTc-HMPAO (pre-Diamox) brain SPECT images of a 52-year-old male with acute and chronic infarction in the region of right MCA territory. Patient had mental status changes and worsening of his neurological exam. After injection of 34.7 mCi of 99mTc-HMPAO IV in a dimly lit and quiet room, a brain SPECT scan was performed 15 min post radiotracer injection to assess for blood flow during the resting state. There is a dense focal area of tracer reduction in the mid right MCA territory, at the junction of approximately the frontoparietal region on the right, consistent with the known prior infarction. Around this area of dense reduction, the uptake is mildly reduced, but almost symmetric with respect to the contralateral left hemisphere. The findings of dense reduction of tracer uptake in the mid right MCA territory, consistent with the prior known infarction. (b) 99mTc-HMPAO (post-Diamox) brain SPECT to assess for the degree of hemodynamic vascular constraint. The patient was injected with 1 g of Diamox dissolved in sterile water. After waiting approximately 15 min for Diamox to have its vasodilatory effect, the 33.9 mCi of technetium 99m Ceretec IV was injected. After waiting approximately another 15 min for radiotracer uptake, incorporation, and fixation in the brain, a brain SPECT scan was performed. Again seen is the area of dense reduction in the mid right MCA territory as seen on the resting-state scan. However, on this scan, there is a significant reduction in the penumbral region around the infarction extending to involve the right frontal lobe predominantly but also the right temporal lobe and the right parietal lobe regions of the brain. There is more extensive degree of reduction in radiotracer uptake after Diamox as compared to rest in the region of right frontal lobe. Findings are consistent with hemodynamic vascular constraint in the right ICA territory with the most severe constraint involving the territories involving the right frontal lobe
Fig. 18.20
A 60-year-old female with transient left-sided weakness and facial droop. (a–c) Rest, stress, and 3D subtraction SPECT demonstrate relative decreased cerebral perfusion in right ICA territory between rest and stress states
Assessment for Carotid Artery Sacrifice: Balloon Occlusion Test (BOT)
In some instances, it may be necessary to sacrifice a carotid artery in the treatment of patients with head and neck tumors or cerebral aneurysms. It is thus necessary to evaluate whether the patient can tolerate temporary or permanent carotid occlusion and to predict the potential risk before the surgical procedures. Balloon occlusion testing (BOT) is useful for evaluating whether patients will tolerate temporary or permanent carotid occlusion and has been considered to result in a decrease in postsurgical complications after carotid occlusion [112, 113].
Measurement of cerebral blood flow (CBF) has revealed that substantial cerebral hypoperfusion may occur when a patient does not show any neurological symptoms during BOT and may thus predict the potential risk after carotid occlusion [114, 115]. Among several methods of CBF studies, SPECT 99mTc-HMPAO or 99mTc-ECD has been increasingly applied in conjunction with BOT, because both tracers—99mTc-HMPAO and 99mTc-ECD—rapidly distribute in the brain and the image is constant long after injection. SPECT images acquired after the completion of BOT might still reflect the CBF distribution during BOT when the tracer was injected.
However, reports have indicated that ischemic events or infarction can occur after permanent carotid occlusion in some patients considered to be tolerant of carotid occlusion by BOT with SPECT [114, 116]. Although the cause of these ischemic events seems to be either embolic or hemodynamic, how hemodynamic change may occur after permanent carotid occlusion has not been sufficiently clarified. Figure 18.21 illustrates the value of the balloon occlusion testing (BOT), in a 55-year-old female with a skull base meningioma.
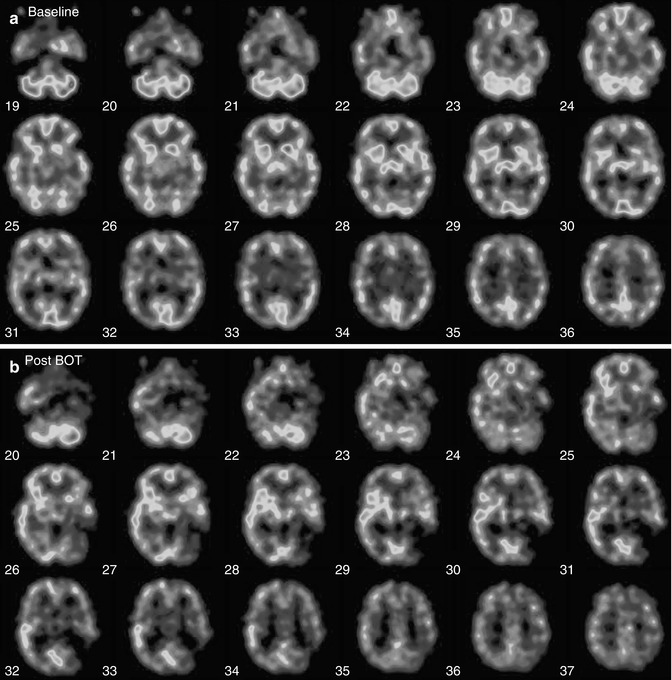
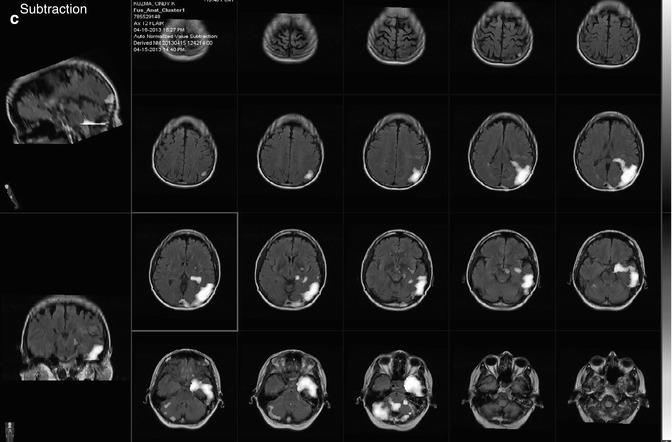
Fig. 18.21
(a) Pre-balloon occlusion baseline study: patient is a 55-year-old female with a skull base meningioma. The patient was injected with radiopharmaceutical (44.5 mCi of 99mTc-HMPAO IV) in a dimly lit and quiet room during the resting state. After waiting approximately 10 min for radiotracer incorporation into the brain, a brain SPECT scan was performed. SPECT images demonstrate symmetric tracer uptake in both the left and right internal carotid artery territories. This baseline study shows good filling of all vascular territories. Findings were consistent with normal baseline resting-state study, with no major vascular territorial significant reductions of blood flow. Post balloon occlusion images (b). In angiography suite, balloon test occlusion (BOT) of the left internal carotid artery was performed. During the 13 min of balloon inflation, the radiotracer (30.4 mCi of Tc-99m Ceretec) was injected intravenously. It was noted at 13 min the patient developed receptive aphasia and mild right hemiparesis, and the balloon was deflated. After patient stabilization, a brain SPECT scan was performed. There is a region of dense hypoperfusion in the left internal ICA territory. The scan shows essentially no significant blood flow to the posterior territory. There is also noted to be a right carotid cerebellar diaschisis. There is asymmetry also seen in the other areas of the left internal carotid artery distribution, most notably the basal ganglia region and hemithalamus. Subtraction images were also obtained (c), which also suggest areas of decreases perfusion in the region of left ICA. These findings are consistent with dense reduction of blood flow to a relatively large part of the left internal carotid artery indicating lack of collateral supply to the region
18.4.3.2 Dementia
Alzheimer’s Disease
The rationale for imaging as a diagnostic tool for Alzheimer’s disease is based on the disease-associated reduction in metabolic brain activity which can be visualized on both 18F-FDG brain PET and 99mTc-HMPAO or 99mTc-ECD brain SPECT. There is a reduction of brain glucose metabolism identified on PET due to reduced neuronal metabolism and synaptic activity. A reduction in brain perfusion on regional cerebral perfusion SPECT is identified as a decrease in blood flow and reduction in neuronal and synaptic activity (proportional to the blood flow) in areas of reduced metabolism caused by amyloid deposition, a finding characteristic of Alzheimer’s disease. The characteristic findings on 18F-FDG brain PET and regional cerebral perfusion SPECT are as follows: (1) often bilateral involvement with asymmetry of reduction in the posterior temporoparietal cortical areas, (2) reduction of metabolism and blood flow to the posterior cingulate gyrus, (3) relatively early onset (less than 65 years) with more marked abnormalities on reduction of 18F-FDG uptake and blood flow, (4) less common primary visual cortex involvement (which is more common in Lewy body dementia), and (5) coexisting micro- or macrovascular disease involvement resulting in neuronal injury and death.
Related posts:
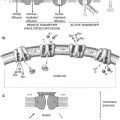
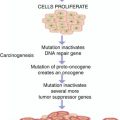
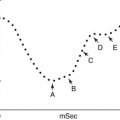
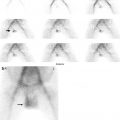
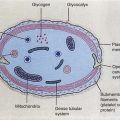
Stay updated, free articles. Join our Telegram channel

Full access? Get Clinical Tree


