1. Technical considerations

The chest radiograph remains the prime imaging investigation in respiratory medicine and the basic technique has changed little over the past 100 years. Of all the cross-sectional imaging techniques, computed tomography (CT) has had the greatest impact on diagnosis of lung and mediastinal disease, while magnetic resonance imaging (MRI), ultrasonography, and positron emission tomography have complementary roles in specific clinical situations. Refinements to CT scanning protocols, notably since the widespread introduction of multidetector CT (MDCT), have led to a substantial increase in the total number of performed CT examinations. Subsequent increases in radiation burden delivered by diagnostic imaging have become a focus of public interest, and the ongoing refinement of means to reduce patient irradiation has become a priority.


CONVENTIONAL CHEST RADIOGRAPHY


Technique


The standard views of the chest are the erect posteroanterior (PA) and lateral projections. The PA chest radiograph is taken at near total lung capacity (inspiratory film) with the patient positioned such that the medial ends of the clavicle are equidistant from the spinous process of the thoracic vertebra at that level. The scapulae are held as far to the side of the chest as possible by rotating the patient’s shoulders forward and placing the backs of the patient’s wrists on the iliac crests. A chest radiograph obtained near residual volume (expiratory film) can substantially change the appearance of the mediastinal contour, as well as giving the misleading impression of diffuse lung disease (Fig. 1.1). Even on a correctly exposed film, just under half the area of the lungs is obscured by overlying structures. 1 Furthermore, many technical factors, notably the kilovoltage and film–screen combination used, determine how well lung detail is seen.


The steep S-shaped dose–response curve of conventional radiographic film–screen combinations makes it impossible to obtain perfect exposure of the most radiolucent and radiodense parts of the chest in a single radiograph. Methods of overcoming this shortcoming have included the use of high-kilovoltage (above 120 kV) techniques, 2 asymmetric screen–film combinations, 3‘trough’ or more complex filters, 4 and sophisticated scanning equalization radiographic units. 5

High-kilovoltage radiographs have several advantages over low-kilovoltage films. Because the coefficients of X-ray absorption of bone and soft tissue approach each other at high kilovoltage, the bony structures no longer obscure the lungs to the same degree as on low-kilovoltage radiographs. Furthermore, the better penetration of the mediastinum with high-kilovoltage techniques allows greater detail of the large airways to be seen. At high kilovoltage, exposure times are shorter, so that structures within the lung tend to be sharper. Although scattered radiation is greater with high kilovoltage, the use of a grid causes a net reduction of image-degrading scattered radiation compared with a low-kilovoltage, nongrid technique. With a high-kilovoltage technique, an air gap of 15 cm in depth is often used, instead of a grid to disperse the scattered radiation; this is as effective as a grid, and the radiation dose to the patient is similar for the two techniques. 6 To counteract the unwanted magnification and penumbra effects of interposing an air gap, the focus–film (or anode-to-image) distance is increased to approximately 4 m. Although high-kilovoltage radiographs are preferable for routine examination of the lungs and mediastinum, low-kilovoltage radiographs provide excellent detail of unobscured lung because of the better contrast between lung vessels and surrounding aerated lung. Moreover, calcified lesions, such as pleural plaques, and small pulmonary nodules, 7 are particularly well demonstrated on low-kilovoltage films.


Extraradiographic views


The frontal and lateral projections suffice for most clinical indications. Other radiographic views are becoming much less frequently requested because of the ready availability of CT. Nevertheless, an additional view may occasionally solve a particular clinical problem quickly and in a cost-effective manner.

The lateral decubitus view is not, as its name implies, a lateral view. It is a frontal view taken with a horizontal beam, with the patient lying on his or her side. Its main purpose is to demonstrate the mobility of fluid in the pleural space. If a pleural effusion is not loculated, it gravitates to the dependent part of the pleural cavity (Fig. 1.2). If the patient lies on his or her side, the fluid layers between the chest wall and the lung edge. Because the ribs, unlike the diaphragm, are always identifiable, comparison of a standard frontal view with a lateral decubitus view is a reliable way of recognizing unloculated pleural fluid. A lateral shoot through radiograph may be used to advantage to show a small anterior pneumothorax in recumbent patients in intensive care. 8


The lordotic view is now rarely used, but is included here for completeness. It is performed by angling the X-ray beam 15° cranial either by positioning the patient upright and angling the beam up or by leaving the beam horizontal and leaning the patient backward. The lung apices are thereby better penetrated, and are free from the superimposed clavicle and first rib. The lordotic view may be useful for distinguishing a focal pulmonary opacity from incidental calcification of the costochondral junctions (Fig. 1.3). With the exception of identifying rib fractures and confirming the presence of a rib lesion, oblique views of the thorax are rarely required.


Portable chest radiography


Portable or mobile chest radiography has the obvious advantage that the examination can be performed without moving the patient to the radiology suite. In many centers, the proportion of portable to departmental chest radiographs has increased over time. However, portable radiography has a number of disadvantages.

The shorter focus–film distance results in undesirable magnification. High-kilovoltage techniques cannot be used because portable machines are unable to deliver the high kilovoltage and because accurately aligning the X-ray beam with a grid is difficult. Furthermore, the maximum milliamperage is severely limited, necessitating long exposure times with the risk of significant blurring of the image. Portable lateral radiographs with conventional film radiography are even less likely to be successful because of the long exposure times. Radiation exposure of nearby patients and staff is a further caveat.

Positioning of bed-bound patients is difficult, and the resulting radiographs often show half-upright or rotated subjects. Even in the so-called erect position with the patient sitting up, the chest is rarely as vertical as it is in a standing patient. More important, the patient is unable to take a deep breath when propped up in bed. Many patients cannot be moved to the radiology department and the improved quality of digital portable radiographs, notably flat panel detectors, represents a substantial improvement.


Limitations of conventional chest radiography


The chest constitutes a large part of the body and an image of the chest needs to encompass at least 40 cm. This large field-of-view imposes constraints on the image receptor, because the receptor must provide consistent and uniform response over the entire field. This field-of-view also increases the contribution of scattered radiation that can decrease image quality. 9

The wide latitude of X-ray transmission through the thorax imposes a limit on the visualization of subtle abnormalities. For a typical X-ray beam used in chest radiography, regional variations in transmission through the thorax can range over two orders of magnitude. 9 Ideally, an imaging system should have enough latitude to capture and effectively display the diagnostically meaningful part of the X-ray transmission. Coverage of such wide latitude, however, can limit depiction of subtle low-contrast lesions. Maintaining wide latitude while preserving the visibility of low-contrast features is thus a particular challenge.9. and 10.

The combination of high X-ray photon energy, a thick body part, and a large field-of-view results in a substantial amount of scattered radiation. This can account for 95% of the detected X-ray flux in the mediastinum and up to 70% in the lung in radiographs acquired without a grid. 11 Scattered radiation degrades contrast and increases image noise. The contribution of scattered radiation to image noise is not correctable. 9

Conventional chest radiography involves the projection of a three-dimensional structure onto a two-dimensional image. Anatomic structures can therefore overlie each other, sometimes referred to as anatomic noise. 9 Anatomic noise can reduce the detectability of lesions. The projection of ribs is of particular concern for detection of lung nodules, because the ribs overlie about 75% of the area of the lungs. Moreover, a substantial portion of the lungs is projected over the heart and parts of the diaphragm. 9 The influence of anatomic noise on the detectability of lung nodules has been extensively studied several decades ago.12. and 13. More recently, Samei et al. 14 demonstrated that anatomic noise is far more important than quantum noise in limiting the detectability of lung nodules.

Perceptual and cognitive processes are of particular importance in chest radiography because of the complexity of the tasks and the confounding effect of technical and anatomic parameters. 9 Perceptual errors can occur at both the visual and the cognitive level. Incompleteness of the search task may contribute to about 55% of missed lesions. These errors occur when the observer fails to look at the location of the lesion12. and 15. or when he or she does not fix their eyes on this territory for a dwell time of at least 0.3 second. 16 Cognitive errors account for 45% of missed lesions and can occur when the fixation time on a potential abnormality exceeds the above limit but the reader fails to call the nodule pathologic. 12


DIGITAL CHEST RADIOGRAPHY


Radiographic data acquisition


Computed radiography (CR) was one of the first commercial digital imaging techniques17 and is still the most common technology for acquiring digital chest radiographs. The technology is based on photostimulable properties of barium halide phosphors. After exposure of a phosphor cassette to X-rays, the cassette is transported to a computed radiography reader device that scans the cassette with a laser beam. The laser releases the energy locally deposited by X-rays on the screen and causes the screen to fluoresce. The released light is used to form the image after it is collected by a light guide, digitized, and associated with the geometric location of the laser beam at the time of stimulation. 9 While CR has the largest number of installations in digital radiography, its disadvantages in terms of image quality per unit dose and suboptimal workflow have encouraged the development of flat-panel detector technology.

Flat-panel detectors are made of thin layers of amorphous silicon thin-film transistors (TFTs) deposited on a piece of glass. The TFT layer is coupled with an X-ray absorptive layer. Indirect flat-panel detectors use a phosphor screen to convert the X-rays to light photons, which are detected by the photodiode array associated with the TFT layer and converted to a charge deposited in the capacitors associated with each TFT.18. and 19. Direct flat-panel detectors use a photoconductor layer that converts the X-ray energy directly to charge, which is subsequently directed to the collecting TFT-capacitor array through the application of a strong electric field. 20 After exposure, the charge on the capacitors is collected line by line and pixel by pixel by using the associated grid and data lines, thereby forming the raw digital image data for processing and display. 9

Charge-coupled device (CCD) and complementary metal-oxide semiconductor (CMOS) cameras use an alternative technology for the acquisition of digital chest radiographs. With these detectors, the X-ray energy is first converted to light within a phosphor layer. The light is then directed to a single or a multitude of CCD or CMOS cameras that detect the light image and form the radiograph. 21 An important component of these detectors is the coupling of the phosphor layer and the camera. Because most CCD and CMOS sensors are limited in size, it is necessary to minify the original light image generated on the phosphor screen so that it can be captured by the camera. This is accomplished by using either a fiberoptic coupler or a lens system. In either case there is a loss of efficiency, since only a small fraction of the light photons generated by the phosphor are detected by the camera(s). Consequently, the inherent efficiency of these detectors is limited. 9

A recent development takes advantage of slot-scan technology to reduce the amount of scattered radiation on digital chest radiographs. 22 The detector consists of a cesium iodide scintillation layer fiberoptically coupled to a series of linear CCDs. With no antiscatter grid in place, a narrow-fan X-ray beam synchronized with the movement of the detector assembly scans the chest. Image data are continuously read from the CCDs as the patient is scanned by using the time-integration method.23. and 24. After scanning, the image data are processed for optimal display. The advantage of this technology is superior scatter rejection with little effect on the detection of primary radiation. This can enhance the effective detection efficiency of the imaging system. 9


Image processing


Prior to display, digital images commonly undergo a series of processing steps. These processes can be divided into preprocessing and post-processing. Image preprocessing consists of correction and scaling.

The first type of processing includes image corrections for detector defects or nonuniformities often present on raw digital images. The second type of preprocessing includes reduction of the full dynamic range of the raw image to the range of perception capability of the human eye. 9 Post-processing is commonly divided into three types:


Gray-scale processing involves the conversion of detector signal values to display values. The display intensities of an image are changed by means of either a look-up table or windowing and leveling.


Edge enhancement aims to enhance fine details within the image by manipulating the high-frequency content of the radiograph, using a variant of the unsharp masking technique in which a blurred version of the image is formed, and a fraction of the resultant image is subtracted from the original image.


Multifrequency processing involves an even more flexible manipulation of multiple portions of the frequency spectrum. The image is initially decomposed into multiple frequency components, and the component images are then weighted and added back together. If the processing parameters are set optimally, the resultant image can compress the overall dynamic range of the image while at the same time enhance local contrast. 9


Image display


Soft-copy display is the optimal way of viewing digital chest radiography. The conventional method of displaying digital radiographs has been on cathode-ray tubes, which still dominate the market. 25 Active-matrix liquid-crystal displays are rapidly replacing cathode-ray tubes.26.27. and 28. The advantages of liquid-crystal displays include improved resolution, reduced weight, smaller form factor, reduced reflection, improved bit depth, and improved luminance range, although disadvantages in terms of limited viewing angle and structured noise may be practically relevant.29. and 30.

Another recent trend has been the increased acceptance of color monitors, some of which have shown acceptable technical performance for radiographic applications. 31 The use of color monitors offers the advantage of being able to accommodate applications other than image viewing on the same device, with workflow and multitasking advantages. 9 Color monitors also make it possible to take advantage of color for viewing multidimensional chest images on the same display. It is thus expected that color liquid-crystal displays will gradually replace monochrome monitors in clinical practice. 9


Novel applications


Digital chest radiography lends itself the development of new techniques to improve the detection of subtle lesions. These techniques include algorithms typically coupled with methodological innovations that use imaging physics to improve lesion conspicuity. Three notable novel applications are dual-energy imaging, temporal subtraction imaging, and digital tomosynthesis. All of these techniques are implemented by using a conventional chest radiography system coupled with a digital imaging receptor. 9 Whether they will be widely adopted remains to be seen.


Temporal subtraction techniques aim to selectively enhance areas of interval change by subtracting the patient’s previous radiograph from the current radiograph. 37 The quality of the difference image strongly depends on the success of two-dimensional registration and warping of the two radiographs, so that the variations in patient positioning can be minimized.38. and 39. The difference image is uniformly gray in areas of no change, whereas areas that stand out on the gray background indicate interval change (Fig. 1.6). Several studies40.41. and 42. have shown that temporal subtraction improves the visual perception of subtle abnormalities. A 20% reduction in the average reading time with temporal subtraction was also noted.9. and 43.


Digital tomosynthesis can produce an unlimited number of section images at arbitrary depths from a single set of acquisition images. 44 During motion of the X-ray tube, a series of projection radiographs are acquired, and the anatomy at different depths in the patient changes orientation in the projection images owing to parallax. These projection images are then shifted and added to bring into focus objects in a predefined plane. By varying the amount of shift, different plane depths can be reconstructed (Fig. 1.7). Objects outside of the focus plane are blurred. Currently, chest imaging with tomosynthesis is one of the areas receiving the most clinical and research interest.9. and 44.


Computer-aided diagnosis


Computer-aided detection (CAD) and computer-aided diagnosis (CADx) systems rely on combinations of image-processing, pattern-recognition, and artificial intelligence techniques. The application of CAD and CADx analysis in chest radiography has followed a traditional model of first detecting and then characterizing potential abnormalities.45. and 46. Image-processing algorithms are applied to identify regions of interest that appear suspicious according to predefined clinical expectations. Image feature analysis then seeks to determine the morphologic and textural characteristics of candidate regions. Finally, feature-based decision analysis provides a definitive assessment of candidate regions. 9

The majority of CAD applications involve the detection of pulmonary nodules. 47 Typically, morphology-based image processing is applied to detect nodular-appearing structures, while more detailed morphologic and texture analyses eliminate false-positive nodule-like structures (Fig. 1.8, Fig. 1.9 and Fig. 1.10). The final decision is made by applying a linear classifier, a neural network, or a rule-base algorithm that merges the image findings into a final binary decision. 9


Reports about the accuracy of this technique vary substantially, and direct comparison between studies is not possible. All proposed approaches, however, struggle to maintain a clinically acceptable sensitivity level while reducing the number of false-positive detections. Several studies nevertheless show that CAD can assist radiologists in improving their overall detection rate for lung nodules.48.49.50. and 51. Moreover, laboratory observer studies have shown promising results for applications designed to determine the malignant potential of pulmonary nodules.40. and 52. CAD techniques have also been applied to the detection and differentiation of interstitial lung disorders, with varying success.53.54.55. and 56. Finally, less fully explored CAD applications include the detection of cardiomegaly, 57 pneumothorax,58. and 59. interval changes, 60 and tuberculosis. 61


COMPUTED TOMOGRAPHY


CT relies on the same physical principles as conventional radiography: the absorption of X-rays by tissues with constituents of differing atomic number. With multiple projections and computed calculations of radiographic density, differences in X-ray absorption can be displayed in a cross-sectional format. The basic components of a CT machine are an X-ray tube and an array of X-ray detectors opposite the tube. The signal from the X-ray detectors is reconstructed by a computer. The speed with which a CT scanner acquires a single sectional image depends on the time the anode takes to rotate around the patient.

Volumetric (formerly referred to as spiral or helical) CT has altered the clinical CT imaging protocols developed in the 1990s. 62 The basic principle of volumetric CT entails moving the patient into the CT gantry at a constant rate while data are continuously acquired, often within a single breathhold.63. and 64. The resulting ‘corkscrew’ of information is then reconstructed, most frequently as a contiguous set of axial images, similar to conventional single-slice CT sections. To achieve this, interpolation is needed because direct reconstruction results in nonorthogonal images of nonuniform thickness. Continuous volume CT scanning has several advantages: (1) rapid scan acquisition in one or two breathholds; (2) reduced volume of contrast needed for optimal opacification of vessels, for example the pulmonary arteries; (3) no misregistration between sections obtained in one acquisition, thus improving detection of small structures; and (4) potential for multiplanar or three-dimensional reconstructions.65.66.67. and 68.

The advent of MDCT technology has revolutionized the diagnostic potential of CT by definitively transforming CT from an axial cross-sectional technique into a true three-dimensional technique that allows for arbitrary selection of section planes and volumetric display of the acquired data (Fig. 1.11, Fig. 1.12 and Fig. 1.13). Most importantly, MDCT permits shorter acquisition times and greater anatomic coverage. 69 The potentially huge number of images routinely generated by clinical protocols, however, represent a challenge in terms of efficient interpretation and the logistics of image storage and transmission. The technique of volumetric MDCT scanning of the thorax continues to be refined, and the full potential of acquiring and analyzing data in a truly volumetric manner is still to be realized.70. and 71.


General considerations


The CT image is composed of a matrix of picture elements (pixels). There are a fixed number of pixels within the picture matrix so that the size of each pixel varies according to the diameter of the circle to be scanned. The smaller the scan circle size, the smaller the area represented by a pixel and the higher the spatial resolution of the final image. In practical terms the field-of-view size should be adjusted to the size of area of interest, usually the thoracic diameter of the patient. Depending on the field-of-view size, the pixel size varies between 0.3 mm and 1 mm across. By selecting a specific area of interest, the operator can achieve an even increased spatial resolution for that region (targeted reconstruction of the raw data). In a clinical context, targeted reconstruction is used only when the finest morphologic detail is required.

Sometimes there is a marked difference in the appearance of CT images acquired on different scanners. This is the result of differences in the software reconstruction algorithms that ‘smooth’ the image to a greater or lesser extent by averaging the density of neighboring pixels. Smoothing is used to reduce the conspicuity of image noise and improve contrast, but it has the drawback of reducing the definition of fine structures. The lung is a high-contrast environment, and smoothing here is less necessary than in other parts of the body. Higher spatial resolution algorithms, which make image noise more conspicuous, are generally more desirable, and it has been recommended that they should be applied to both standard thick sections and high-resolution CT (HRCT).72. and 73.


Acquisition parameters


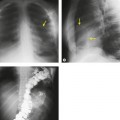
Although a single CT section appears as a two-dimensional image, it has a third dimension of depth. Thus each pixel has a volume, and the three-dimensional element is referred to as a voxel. The average radiographic density of tissue within each voxel is calculated, and the final CT image consists of a representation of the numerous voxels in the section. The single attenuation value of a voxel represents the average of the attenuation values of all the structures within the voxel. The thicker the section, the greater the chance of different structures being included within the voxel and so the greater the averaging that occurs. The most obvious way to reduce this ‘partial volume’ or ‘volume averaging’ effect is to use thinner sections (Fig. 1.14).


The entire thorax is now usually examined with contiguous sections. MDCT has brought section thickness down to a range of 0.75–2.5 mm. Additional dedicated thin sections are sometimes required to clarify partial volume effects or to study areas of anatomy that are oriented obliquely to the plane of scanning. Specific examples of the use of thin sections to display differential densities, which would otherwise be lost because of the partial volume effect, is the demonstration of small foci of fat within a hamartoma, or of calcifications within a pulmonary nodule. Thin sections of 1–1.5 mm thickness are also used to study the fine morphologic detail of the lung parenchyma (HRCT). Apart from the evaluation of diffuse lung disease, when sampling of a few parts of the lung (traditionally with sections taken at 10–30 mm intervals) is adequate, contiguous section scanning is necessary to allow accurate interpretation in most clinical situations.

For volumetric CT scanning, consideration needs to be given to the speed of table travel, volume of interest, duration of scanning (usually within one breathhold), and reconstruction interval. Pitch is defined as the distance traveled by the table per gantry revolution divided by the section thickness (collimation). A potential source of confusion arises from the two definitions of pitch used in the context of MDCT: it should be remembered that either the section thickness or the total z-axis length of the detector array may be used. The latter definition is most frequently quoted in the literature. 69 It should also be emphasized that definitions of acquisition parameters and protocols for MDCT may, because of unique detector array designs, be specific to a given manufacturer.

A typical pitch of 1 describes the situation, assuming a gantry revolution in 1 second, in which the table travels at 10 mm/s with 10 mm collimation. During a 10-second breathhold, 10 cm in longitudinal axis will be covered. If the travel speed is increased to 20 mm/s, the pitch will be increased to 2 and twice the distance will be covered. In general, the useful range of pitch for thoracic work is between 1 and 2. 74 When detection of small pulmonary nodules is the primary aim, a pitch of less than 1.5 is recommended. 75 Conversely, when radiation dose is a major consideration, scanning at a higher pitch reduces the radiation burden to the patient.76.77. and 78. Although the spatial resolution of volumetric CT in the transaxial plane is nearly comparable to conventional CT, there is some image degradation because of broadening of the slice profile, inherent in all volumetric CT; this results in additional partial volume averaging in the longitudinal (z-) axis. 79 The faster the table feed, the broader the slice profile will be. The use of a 180° interpolation algorithm produces a slice profile close to the nominal section thickness, although this causes a slight increase in image noise.69. and 80. Greatly increased z-axis resolution is a feature of MDCT with isotropic imaging (identical resolution in all planes) being the ultimate goal being pursued by manufacturers. 69 This goal has now been reached.

A higher pitch and increased section thickness together enable greater coverage at the expense of increased partial volume effects. However, this can be partly ameliorated by reducing the reconstruction increment, thus producing a larger number of overlapping images.81. and 82. The ability to retrospectively reconstruct axial images with considerable overlap by choosing a small reconstruction interval is a major advantage of MDCT. 69


Radiation dose


The introduction of MDCT has increased the clinical indications for CT, and thus increased the total number of CT examinations performed and the anatomic coverage of CT examinations. This has led to a substantial overall increase of radiation dose delivered by diagnostic CT. The issue of increased delivery of radiation is compounded by the fact that younger and thus more radiation-sensitive patients are being scanned with increasing frequency (e.g. for suspected pulmonary embolism), as well as the trend to recruit (per definition) asymptomatic individuals for CT screening studies. The resulting public concerns have stimulated the publication of guidelines for maximum dose levels administered by CT. The European Guideline for Quality in Computed Tomography EUR 16262 defines such dose levels for all organs. Guidelines specifically designed for CT of the chest have been published by the Fleischner Society. 83 This brief discussion of the topic will focus on the factors that determine dose delivery in clinical chest CT, and on the relationship between radiation dose and image quality.


Measurement of radiation dose


Table 1.1 Parameters frequently used in the calculation of dose
Parameter Abbreviation Comment
CT Dose Index CTDI Integral under the dose profile of a CT section
Weighted CT Dose Index CTDIw Average radiation dose across the diameter of a phantom
Volume CT Dose Index CTDIvol Corresponds to CTDIw corrected by the pitch factor. Indicates average local dose to a patient within the scan volume. Allows for direct comparison of the radiation dose from different scan parameter settings, even between scanners
Dose–length product DLP Corresponds to CTDIvol multiplied by the length of the scan. At identical CTDIvol, scans covering longer anatomical areas will deliver more dose than those covering shorter areas
Effective dose E Computed parameter used to estimate the radiation risk to the patient. Does not provide precise radiation risk for the individual patient, but is rather an index of risk for a particular scanner and examination


Technical factors influencing dose delivery


Dose delivery and image quality are substantially influenced by scanner technology. The following parameters are of practical importance (Box 1.1).


Scanner geometry


To decrease the centrifugal forces of the tube during rotation, manufacturers tend to move the tube closer to the isocenter of the scanner. At fixed mAs settings, this substantially increases patient dose, notably the skin entry dose.


Focal spot tracking


Slightly widening the pre-patient collimation (‘over-beaming’) was used in early MDCT units to compensate for subtle alterations of the focal spot size during the tube rotation. Over-beaming has now been replaced by focal-spot-tracking that adjusts the collimator setting and is a standard feature in latest generation scanners.


Geometric efficiency


The geometric efficiency of a detector is determined by the amount of radiation that reaches the detector relative to the amount of radiation that leaves the patient. Geometric efficiency depends on the width, spatial orientation, absorption of the septa separating detectors, and width of the dose profile in the z-direction.


Electronic noise


The amplifiers of the detector system are responsible for a constant level of noise. The smaller the detector signal, the more important the electronic noise becomes. This is particularly noticeable in obese patients, low-dose protocols, and in thin-section imaging.


Noise filtering


Noise filtering works on the raw data and averages the signal from neighboring detector elements if the signal from these detectors drops too low. Averaging influences only a small portion of the projectional data.


Tube current modulation


Tube current modulation is based on the substantial differences in diameter between the AP and the lateral diameters of the body cross-section as well as widely differing attenuations inherent in thoracic imaging. As attenuation follows an exponential function, small changes in diameter will cause major differences in attenuation. Different technical solutions are currently applied to modulate the mA according to the maximum and minimum patient size as determined by the scanogram. In chest CT, dose modulation allows for dose reductions of up to 30% without loss of image quality, depending on the habitus of the individual patient.


Dose reduction in chest CT


The concept of reduced tube current for chest CT was introduced in 1990 by Naidich et al., 84 who demonstrated acceptable image quality for assessment of the lung parenchyma with tube current settings of 20 mAs compared with a standard setting of 250 mAs. While the resulting images were adequate for assessing lung parenchyma, they showed increased noise and resulting marked degradation of image quality. The authors noted that such low-dose techniques were most suited for the assessment of children and potentially for screening patients at high risk for lung cancer. These recommendations have indeed been implemented and further studied in lung cancer screening programs,85.86. and 87. and low-dose protocols now feature in most lung cancer screening trials. 88

Similar dose reduction strategies have been applied to HRCT of the lungs. No substantial differences in the depiction of lung parenchymal structures were seen between low-dose (40 mAs) and high-dose (400 mAs) thin-section CT images. 89 Ground-glass opacities, however, were difficult to assess on low-dose images because of increased image noise. Therefore, it has been recommended that 200 mAs should be used for initial thin-section CT and lower doses (i.e. 40–100 mAs) should be used for follow-up CT examinations. 83

The relationship between radiation exposure and image quality on both mediastinal and lung windows has been evaluated on conventional 10 mm collimation chest CT images. 90 Although the findings showed a consistent increase in image quality with higher radiation exposure, they did not show a remarkable difference in the detection of mediastinal or lung parenchymal abnormalities between 20 mAs and 400 mAs. The authors concluded that adequate image quality could be consistently obtained in average-sized patients by using tube currents of 100–200 mAs. The authors noted that to further evaluate the effect of reduced radiation dose on diagnostic accuracy in chest CT, comparison of complete chest CT studies at a variety of radiation exposures in a large number of patients is needed. They also acknowledged that such a study could not be performed in patients because of the unacceptable radiation dose that would result from multiple CT examinations at differing radiation exposures. Additionally, the variable effect of motion artifacts on repeated scanning make comparisons difficult. 83

A practical method for evaluating the effect of reduced radiation dose on image quality is computer simulation. 91 The technique consists of obtaining a diagnostic CT with a standard dose and then modifying the raw scan data by adding Gaussian-distributed random noise to simulate the increased noise associated with reduced radiation exposure. The raw scan data are then reconstructed using the same field-of-view and reconstruction algorithm as the high-dose reference scan. In a validation trial, experienced chest radiologists were unable to distinguish simulated reduced dose CT images from real reduced dose CT images. 91 Computer simulation of noise allows investigators to determine the effect of dose reduction on diagnostic accuracy without exposing patients to radiation unnecessarily. In addition, the simulated images are in exact registration with the original images, eliminating artifacts due to volume averaging or motion. In chest CT, this technique has been used to evaluate the effect of dose reduction in CT angiograms performed for suspected pulmonary embolism, 77 and in expiratory CT examinations performed to detect air-trapping. 92


Image reconstruction


The recent proliferation of MDCT has led to an increase in the creation of images in planes or volumes other than the traditional transverse images (Fig. 1.15). What follows is a brief discussion of the reconstruction capabilities of modern CT scanners as applied to chest imaging. More detailed technical background information is provided in the specialized literature. 93


Multiplanar reconstructions


Quint et al. 94 evaluated CT images from lung transplant patients using 3 mm collimation, pitch of 1, and a 1.5 mm reconstruction interval and found axial images were 91% accurate in the detection of bronchial stenoses. By comparison, viewing the axial images with multiplanar reconstructions (sagittal and coronal) improved accuracy, marginally, to 94%. However, observers found it easier to identify mild stenoses on the multiplanar images, highlighting the difficulty of accurately assessing luminal caliber on sequential axial images. Multiplanar reconstructions also depict the lengths of stenotic segments more clearly due to the orientation of the section along the long axis of the airway.


Surface shaded display


Improvements in computing power and speed have led to the replacement of shaded surface display renditions with three-dimensional volume rendering. Volume rendering converts the volume of information acquired by MDCT into a simulated three-dimensional form that surpasses the technique of surface shaded display, 95 which is limited by threshold voxel selection. The volume-rendered three-dimensional image is the computed sum of voxels along a ray projected through the dataset in a specific orientation, thus using all the MDCT data to form the final image (Fig. 1.16). The volume-rendering technique assigns a continuous range of values to a voxel, allowing the percentage of different tissue types to be reflected in the final image while maintaining three-dimensional spatial relationships. Remy-Jardin et al. 67 compared overlapping axial CT images with volume-rendered bronchographic images for the detection of airway abnormalities and identification of lesion morphology. Findings on the volume-rendered images were concordant but added no complementary value to those on the transverse CT images in half of the cases. However, volume-rendered images provided supplemental information in a third and could correct potential interpretative errors from viewing only transverse CT images in 5%.


The most alluring technique to be applied to airway imaging is ‘virtual bronchoscopy’ (VB). These images are obtained using volume-rendering techniques that allow internal rendering of the tracheobronchial tree, producing an appearance similar to that seen by a bronchoscopist. Adequate images can be obtained even with low (50 mA) tube currents. 96 Studies using this technique have nevertheless revealed several limitations. Summers et al. 97 used virtual bronchoscopy to assess 14 patients with a variety of airway abnormalities. They found that, overall, 90% of segmental bronchi that were measurable at CT could be measured at VB. However, of the total bronchi expected to be visible, only 82% could be evaluated at VB and only 76% of segmental bronchi were demonstrated compared with 91% and 85%, respectively, for multiplanar CT images. Axial CT and the ‘virtual’ images were of similar accuracy in estimating the maximal luminal diameter and cross-sectional area of the central airways. These authors used 3 mm sections, pitch of 2, a field-of-view of 26 cm or less and 1 mm reconstruction intervals. Virtual bronchoscopy demonstrates stenoses of the central airways (proved with fiberoptic bronchoscopy) in most cases,98. and 99. but, in one study, 98 all the stenoses demonstrated by VB were also shown on the transverse images. In addition, evaluation of the length of the stenoses and surrounding tissues required simultaneous display of multiplanar reformations.

The use of airway stents for benign and malignant stenotic disease provides another potential, but limited, use for volume-rendering techniques. As stents require frequent follow-up, MDCT of the airway offers an easier way to monitor cases until adjustment requires direct intervention. 100 From experience so far it seems that, for many central airways diseases, MDCT does not have a greater sensitivity than conventional transaxial images, but it does confer advantage in describing spatial relationships of airway disease, particularly in communicating this information to clinicians. 101 Another potential application of volume-rendering techniques is the curved planar reformation. A curved structure, such as an airway, can be electronically ‘starched’ into a straight structure and, thereby, made amenable to objective geometric quantification. 102


Maximum intensity projections


One of the early reported limitations of HRCT for the assessment of diffuse infiltrative lung disease was the perception that micronodules were more reliably distinguished from blood vessels on standard collimation sections.103. and 104. The problem of making this distinction has probably been overstated in the past. However, with MDCT, it is possible to acquire volumetric data rapidly; the entire thorax can be imaged with a high-resolution technique in 17 seconds using a pitch of 6, 1.0 mm detectors, and a rotation time of 0.5 seconds; 105 maximum intensity projection (MaxIP) images have been advocated as an additional tool in the evaluation of diffuse infiltrative lung diseases; the diagnostic benefit of MaxIP post-processing for the detection of larger nodules, for example pulmonary metastases, is unequivocal. 106 Remy-Jardin and colleagues107 compared conventional CT (1 mm and 8 mm collimation) with MaxIP images (sliding slabs of 3 mm, 5 mm, and 8 mm thickness generated from volumetric CT performed at the level of the region of interest) in patients with a suspicion of micronodular infiltration. MaxIP images showed micronodular disease involving less than 25% of the lung when conventional CT was inconclusive and better defined the profusion and distribution of micronodules when they were identified on conventional images. However, in patients with normal 1 mm and 8 mm images, sliding-thin-slab MaxIPs did not reveal additional lung abnormalities. Bhalla et al. 108 used MaxIP reconstruction in 20 patients with known diffuse lung disease and found two main advantages over thin-section CT: more precise identification of nodules and more accurate characterization of suspected nodule distribution (perivascular versus centrilobular). The technique is not widely used routinely in the context of diffuse lung disease, largely because in most cases of suspected interstitial lung disease a standard HRCT technique will have been used (Fig. 1.17).


Minimum intensity projections


The contrast between normal and low-attenuation lung parenchyma in patients with constrictive obliterative bronchiolitis or emphysema may be subtle on inspiratory HRCT images and image-processing techniques such as minimum intensity projections (MinIPs) can improve the conspicuity of such regional density differences108. and 109. (Figs 1.17 and 1.18). In a study by Fotheringham et al., 109 MinIP images showed good correlation with pulmonary function tests and had the lowest observer variation when compared with inspiratory and expiratory images. Window settings for the interpretation of MinIP slabs have not been standardized; window widths of 350–500 Hounsfield Units (HU) and a window level of −750 to −900 HU have been used in the few studies that have investigated this technique.


Intravenous contrast enhancement


Because of the high contrast on CT between vessels and surrounding air in the lung, as well as between vessels and surrounding fat within the mediastinum, intravenous contrast enhancement is needed only for specific clinical indications. The exact timing of the injection of contrast medium depends most on the time the scanner takes to acquire data. With MDCT scanning, the circulation time of the patient becomes an important factor. However, general guidance about the time of arrival of contrast medium from the antecubital vein to various structures is possible. 110 In normal individuals arrival time in the superior vena cava is 4 seconds, pulmonary arteries 7 seconds, ascending aorta 11 seconds, descending aorta 12 seconds, and inferior vena cava 16 seconds. With the advent of increasingly rapid scanners, however, these rules of thumb have become less reliable, and the risk persists that the rapid scanner will ‘overtake’ the inflow of contrast material, i.e. the scanner acquisition will be faster than the patient’s circulation time of the injected contrast. To overcome this potential problem, techniques have been developed that allow individually tailored contrast injection protocols based on the injection of a test bolus.111. and 112. An easier and more practical solution employs ‘bolus-tracking’ software. By placing a region-of-interest in a vessel supplying an area of diagnostic interest, the radiologist can determine the level of vascular enhancement that must be achieved before the CT unit will start to scan. The use of the ‘bolus-tracking’ technology can be further improved by a saline flush injected immediately after the contrast material at an identical flow rate. Because the spontaneous flow in the injected vein is indeed often slower than the injection rate, the inflow of contrast material slows down once the injection is completed. This can lead to a premature decrease in contrast in either the pulmonary artery or the aorta. A saline flush overcomes this by ‘pushing’ the contrast material forwards, thereby stabilizing the vascular contrast plateau. Finally, the saline flush technique helps to overcome potential inter-patient variability of vascular enhancement caused by differences in cardiac output. Ideally, the time from contrast arrival to peak enhancement in either the pulmonary artery or the aorta should last as long as the injection time, but it tends to end earlier in patients with a high cardiac output and last longer in patients with a low cardiac output.

The contrast medium rapidly diffuses out of the vascular space into the extravascular space, so that opacification of the vasculature following a bolus injection quickly declines and nonvascular structures such as lymph nodes steadily increase in density over time. Because of these dynamics, there is a time at which a solid structure may have exactly the same density as an adjacent vessel. The timing and duration of the contrast medium infusion must therefore be taken into account when interpreting a contrast-enhanced CT examination. Rapid scanning protocols with automated injectors improve contrast enhancement of vascular structures at the expense of enhancement of solid lesions because of the rapidity of scanning. With MDCT scanning it is possible to achieve good opacification of all the thoracic vascular structures with a total dose of less than 100 mL contrast (iodine content of 150–350 mg/mL) at a rate of about 2 mL/s. 113

Some CT scanners generate streak artifact centered on the high-density bolus of contrast, usually as it passes through the superior vena cava. This beam-hardening artifact may be troublesome if it obscures detail in the adjacent pulmonary arteries, particularly in patients being investigated for pulmonary embolism. One solution is to reduce the iodine concentration and use a high volume of dilute contrast at an increased flow rate. 114 A reduction in both the streak artifact and amount of contrast needed can also be achieved by the above described saline flush. 115 One protocol recommended for general thoracic CT scanning is 100 mL of 150 mg iodine/mL (300 mg iodine/mL diluted 50:50) injected at a rate of 2.5 mL/s after a 25-second delay. 116 However, Loubeyre et al. 117 have shown that satisfactory enhancement of the hilar vasculature can be obtained with a more modest amount of contrast (60 mL of 250 mg iodine/mL at 3 mL/s). For the examination of inflammatory lesions, it may be necessary to delay scanning by at least 30 seconds to allow contrast to diffuse into the extravascular space. Each injection protocol must be carefully tailored to the clinical problem, and no single ideal protocol exists. Moreover, the injection protocol will depend on a variety of parameters (summarized in Table 1.2). These parameters should ideally be documented on the images, as their combination and interaction can have important implications for image interpretation.


Table 1.2 Parameters that will influence planning of the contrast injection protocol*
*V, F, and D are key parameters for planning of injection protocols, while C, O, and V are specific for a given manufacturer’s product. N and X can be determined by the radiologist.
Parameter Abbreviation Unit
Contrast volume V mL
Flow rate F mL/s
Scan delay D s
Saline flush N mL
Position of region-of-interest for bolus triggering X
Concentration of contrast material C mg iodine/ mL
Osmolarity of contrast material O osmol/L
Viscosity V kP

Consideration must be given to the consequences of accidental extravasation of contrast medium: the flow rate used, within reason, is not predictive of the likelihood of extravasation. 118 Nevertheless large volumes (more than 100 mL) introduced into the soft tissues of the forearm by an automated power injector may be associated with severe complications, including compartment syndrome and tissue necrosis; in the event of extravasation of a large volume of contrast, urgent surgical advice should be sought. 119


Window settings (Box 1.2)


The average density of each voxel is measured in Hounsfield Units; these units have been arbitrarily chosen so that zero is water density and −1000 is air density. The range of Hounsfield Units encountered in the thorax is wider than in any other part of the body, ranging from aerated lung (approximately −800 HU) to ribs (+700 HU). The operator uses two variables to select the range of densities to be viewed: window width and window center or level.

Box 1.2


• Soft tissues, mediastinum, chest wall: center 40 HU, width 300–500 HU


• Lung parenchyma: center −600 HU, width 1500 HU


• HRCT: center −500 to −800 HU, width 1300–1600 HU

*Approximate recommendations – optimized settings will depend on scanner type, display modus, viewing conditions, and personal preference.

The window width determines the number of Hounsfield Units to be displayed. Any densities greater than the upper limit of the window width are displayed as white, and any below the limit of the window are displayed as black. Between these two limits the densities are displayed in shades of gray. The median density of the window chosen is the center or level, and this center can be moved higher or lower at will, thus moving the window up or down through the range. The narrower the window width, the greater the contrast discrimination within the window. No single window setting can depict this wide range of densities on a single image. For this reason, thoracic work requires at least two sets of images, usually to demonstrate the lung parenchyma and the soft tissues of the mediastinum. Furthermore, it may be necessary for the operator to adjust the window settings to improve the demonstration of a particular abnormality. Standard window widths and centers for thoracic CT vary between institutions, but some generalizations can be made: for the soft tissues of the mediastinum and chest wall a window width of 300–500 HU and a center of +40 HU are appropriate. For the lungs a wide window of approximately 1500 HU or more at a center of approximately −600 HU is usually satisfactory. 120 For skeletal structures the widest possible window setting at a center of 30 HU is best. Allowing observers to adjust window settings, compared with images at fixed window settings, does not appear to improve performance in terms of identifying fine lung structures or detecting diffuse lung disease. 121

The window settings have a profound influence on the visibility and apparent size of normal and abnormal structures. The most accurate representation of an object is achieved if the value of the window level is halfway between the density of the structure to be measured and the density of the surrounding tissue.122. and 123. For example, the diameter of a pulmonary nodule, measured on soft tissue settings appropriate for the mediastinum, will be grossly underestimated. 124 When inappropriate window settings are used, smaller structures are proportionately more affected than larger structures. The optimal window settings for the post-processed data, for example MinIP images or three-dimensional volume-rendered images, cannot be prescribed and are largely a matter of observer preference.

In the context of HRCT, the window settings have a substantial effect on both the appearance of the lungs and the apparent dimensions of, for example, the thickness of bronchial walls.125. and 126. Alterations of the window settings may sometimes make detection of parenchymal abnormalities impossible in cases of a subtle increase or decrease in attenuation of the lung parenchyma. Although no absolute window settings can be given because of machine variation and individual preferences, uniformity of window settings from patient to patient will aid consistent interpretation of the lung images. In general, a window level of −500 to −800 HU and a width of between 1300 HU and 1600 HU is usually satisfactory. Modifying the window settings for particular tasks is often desirable; for example, when searching for pleuro-parenchymal abnormalities in asbestos-exposed individuals, a wider window of up to 2000 may be useful. Conversely, a narrower window width of approximately 600 HU may usefully emphasize the subtle density differences encountered in patients with emphysema or small airways disease.


Indications and protocols


There is no single protocol which can be recommended for every clinical eventuality without being prohibitively excessive in terms of radiation dose, time taken, or data acquired. The optimal protocol is one that makes a difference to patient outcome by providing clinically relevant information at the lowest possible radiation dose. There is a constant tension between the desire for a comprehensive examination and the unnecessary exposure of the patient to ionizing radiation. 83 Moreover, the advent of MDCT has led to a multiplication of specialized protocols that are described in the current reference literature. 127 Despite its obvious benefits, MDCT encourages indiscriminate ‘catch-all’ protocols, a problem that is exacerbated by unfocused clinical requests. Attempts to contain, and, wherever possible, reduce, the radiation dose of a CT examination should be a constant consideration when planning examination protocols.83. and 128.

Indications for CT can be broadly divided into situations in which CT elucidates an abnormality shown on a plain chest radiograph and those in which the chest radiograph appears normal but cryptic disease is suspected. These indications are summarized in Box 1.3.


Special techniques


HRCT for parenchymal disease


Three factors significantly improve the spatial resolution of CT images of the lung: narrow scan collimation, a high spatial resolution reconstruction algorithm, and a small field-of-view. 129 Other aspects that affect the final image, over which the user has no control, include the X-ray focal spot size, the geometry and array of detectors, and the frequency of data sampling and scan acquisition time. 130

Narrow collimation of the X-ray beam reduces volume averaging within the section and so increases spatial resolution compared with standard collimation.131. and 132. Collimation of between 0.5 mm and 1.5 mm can be used.132.133. and 134. Reducing the section thickness below 0.5 mm will yield no further improvement in spatial resolution. Differences between 1.5 mm and 3 mm collimation are probably insignificant for the detection of small structures, 132

Only gold members can continue reading. Log In or Register to continue

Stay updated, free articles. Join our Telegram channel

Feb 2, 2016 | Posted by in RESPIRATORY IMAGING | Comments Off on 1. Technical considerations

Full access? Get Clinical Tree

Get Clinical Tree app for offline access