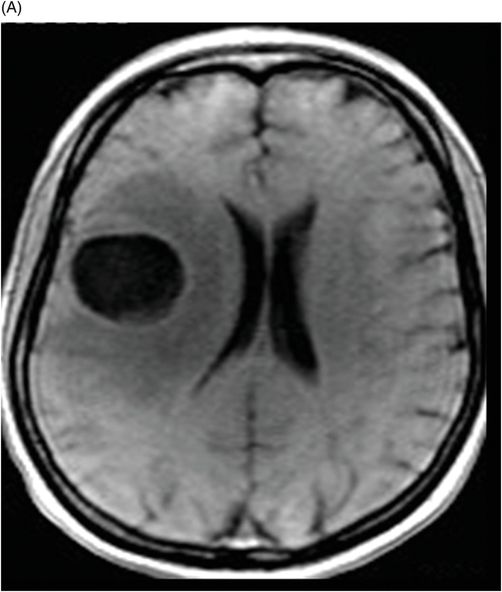
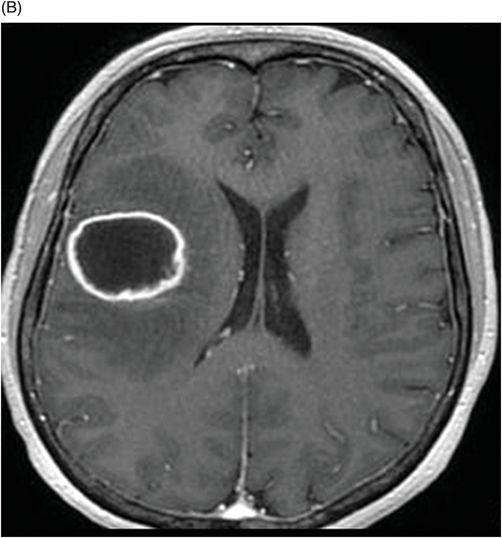
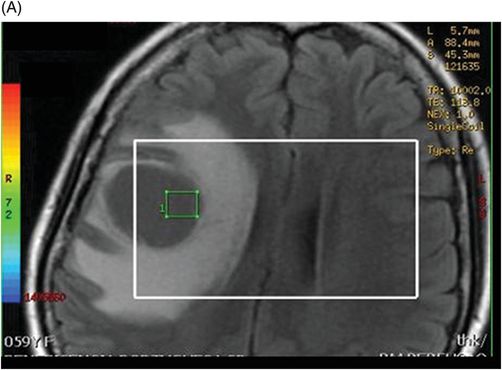
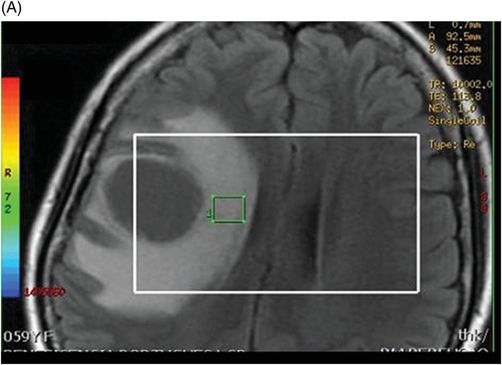
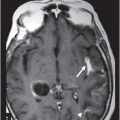
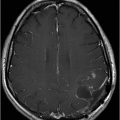
(A) Axial precontrast T1WI and (B) Axial postcontrast T1WI through the level of the lateral ventricles.
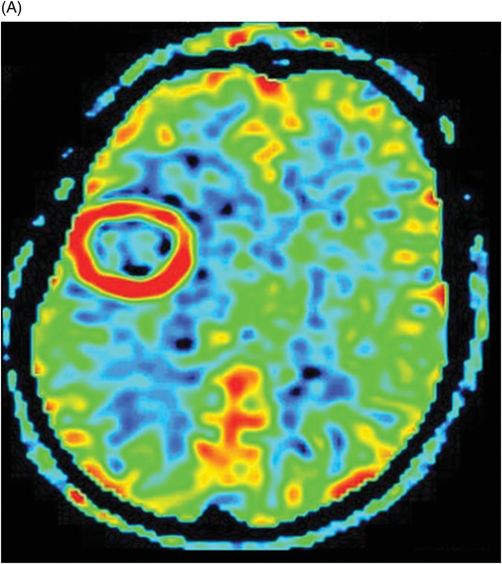
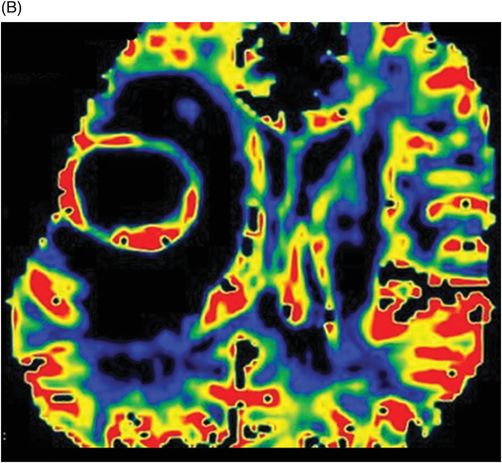
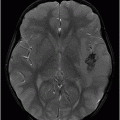
(A) Non-contrast perfusion, arterial spin labeling (ASL), and (B) Perfusion T2-DSC through the level of the lateral ventricles.
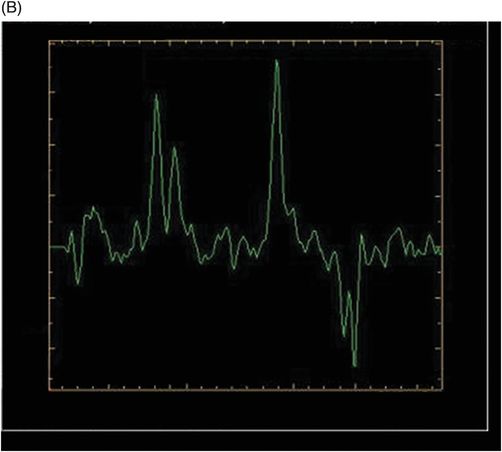
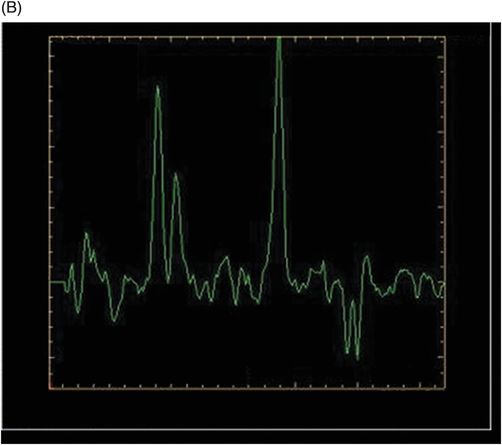
(A–B) 3D spectroscopy with TE = 144 ms in the peritumoral area of the FLAIR abnormalities.
Cystic Glioblastoma
Primary Diagnosis
Cystic glioblastoma
Differential Diagnoses
Brain abscess
Solitary metastasis
Tumefactive demyelination
Juvenile pilocytic astrocytoma
Pleomorphic xanthoastrocytoma
Neuroglial cyst
Imaging Findings
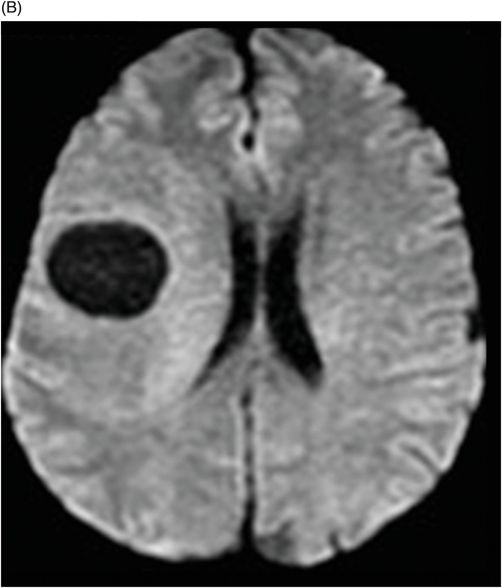
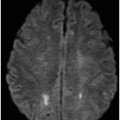
Fig. 114.1: (A) Axial FLAIR and (B) Axial DWI demonstrated a hypointense lesion with significant perilesional edema and no restricted diffusion. Fig. 114.2: (A) Axial precontrast T1WI and (B) Axial postcontrast T1WI demonstrated a large irregular and thick ring-enhancing lesion in the right frontal lobe. Fig. 114.3: (A) Perfusion without contrast, arterial spin labeling (ASL), showed increased rCBF in the periphery of the lesion. (B) Contrast-enhanced dynamic susceptibility-weighted perfusion MRI showed significantly elevated CBV at the periphery of the lesion. Fig. 114.4: (A) Axial FLAIR localizer and (B) 3D multivoxel spectroscopy images with TE of 144 ms (not shown) demonstrated increased choline-to-creatine ratio, decreased NAA peak over the enhancement component of the tumor, and a large inverted lactate peak at the non-enhancing central part. Fig. 114.5: (A) Axial FLAIR localizer and (B) 3D multivoxel spectroscopy images with TE of 144 ms (not shown) demonstrated increased choline-to-creatine ratio and decreased NAA peak, and an inverted lactate peak is also noted in the peritumoral area of the FLAIR abnormality beyond the enhancing component.
Stay updated, free articles. Join our Telegram channel

Full access? Get Clinical Tree


