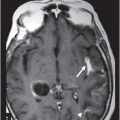
Axial T1WI of the brain at the level of lateral ventricles.
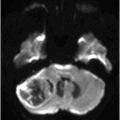
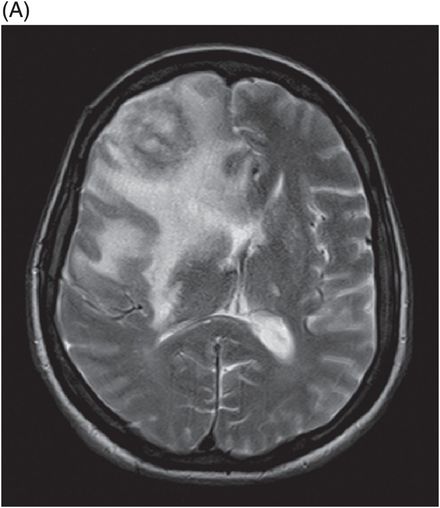
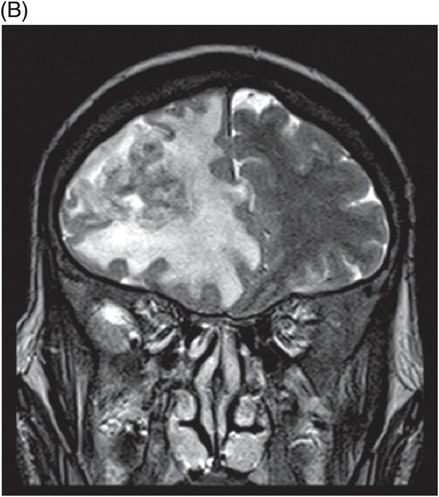
(A) Axial T2WI of the brain at the level of lateral ventricles and (B) Coronal T2WI at the level of frontal lobes.
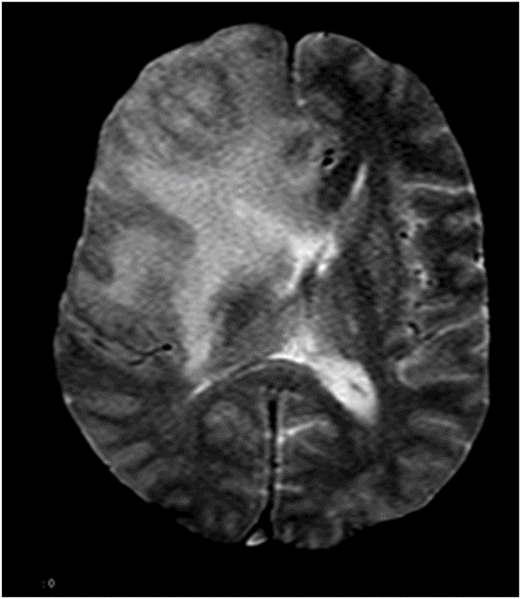
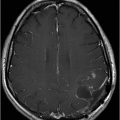
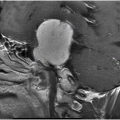
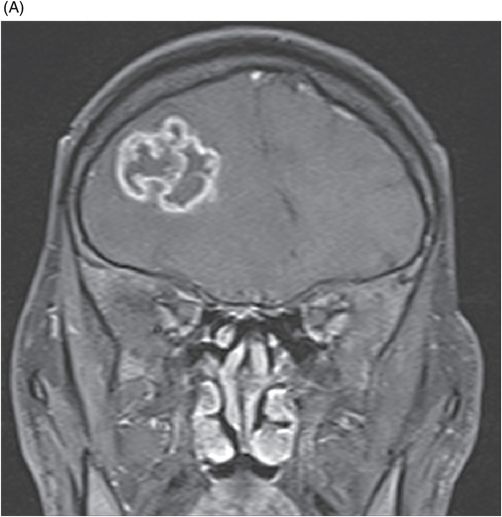
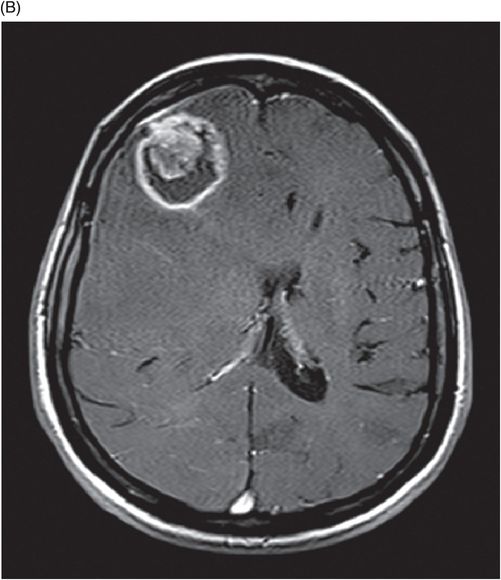
(A) Coronal T1-weighted, postgadolinium-enhanced image of the brain at the level of frontal lobes. (B) Axial T1-weighted, postgadolinium-enhanced image of the brain at the level of lateral ventricles.
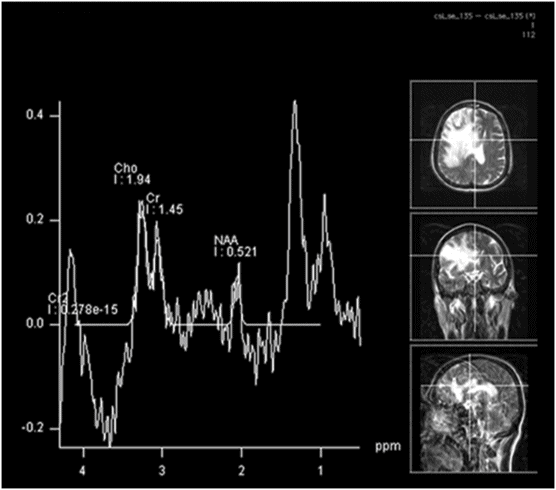
Single voxel spectroscopy of the brain at 135 TE through the mass lesion.
Central Nervous System Tuberculoma
Primary Diagnosis
Central nervous system tuberculoma
Differential Diagnoses
Glioblastoma
Metastasis
Lymphoma
Pyogenic abscess
Fungal abscess
Imaging Findings
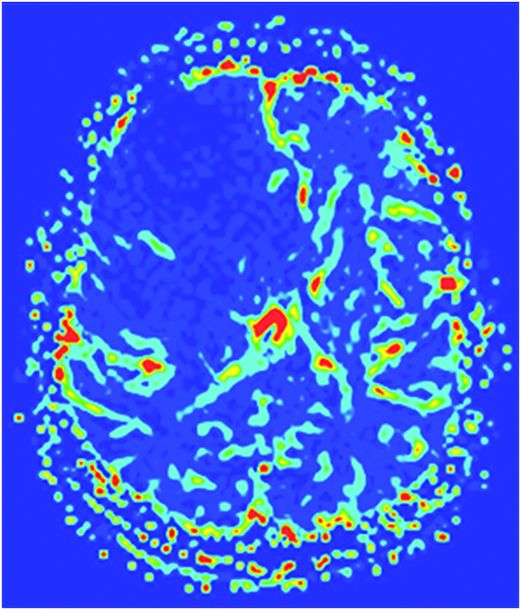
Fig. 116.1: Axial T1WI of the brain demonstrated a heterogeneous mass lesion in the right frontal lobe, with a predominantly hypointense signal. Fig. 116.2: (A) Axial and (B) Coronal T2-weighted images also demonstrated a predominantly hypointense signal. Fig. 116.3: Axial GRE image of the brain showed no presence of hemorrhage. Fig. 116.4: (A) Coronal and (B) Axial postgadolinium images showed irregular, thick-walled, and nodular peripheral enhancement. Fig. 116.5: Perfusion MR image noted absence of intralesional or perilesional elevated rCBV. Fig. 116.6: Single voxel spectroscopy at 135 TE showed elevated lipid/lactate peak at 1.3 ppm.
Discussion
A constellation of imaging findings demonstrating a T1- and T2-weighted hypointense lesion with thick and irregular rim enhancement, extensive perilesional oedema with low rCBV on perfusion imaging, and lipid peak at 1.3 ppm with a decrease in NAA/choline ratio on MR spectroscopy strongly favors the diagnosis of a giant tuberculoma.
Unlike tuberculomas, glioblastoma (GBM) lesions are usually hypointense on T1-weighted and hyperintense on T2-weighted sequences. Depending on the presence of intratumoral hemorrhage and necrosis, the imaging features of GBM can vary. Magnetic resonance spectroscopy in a GBM reveals elevated choline/creatine and choline/NAA ratios; MR perfusion images typically show significantly elevated rCBV, from the solid component. Metastatic lesions can have similar imaging features to GBM on conventional imaging sequences, with elevated rCBV. The lack of NAA peak on spectroscopy helps in differentiating non-neuronal tumors from GBM.
Depending on immune status, primary CNS lymphomas have varied imaging patterns and range from T2 hypointense with diffusion restriction and homogeneous enhancement to heterogeneous signal changes and enhancement. They have elevated choline/creatine ratios, lipid peaks, and elevated rCBV, which is low in comparison to GBM and metastases. Fungal abscesses are commonly seen in immunocompromised patients and often show a T2 hypointense center with peripheral enhancement and demonstrate enhancing intracavitary projections, which can have diffusion restriction. Multiple peaks of trehalose sugars at 3.6 and 3.8 ppm can aid in differentiating fungal abscesses from a tuberculoma. Pyogenic abscesses are T2 hyperintense, with peripheral enhancement and homogeneous diffusion restriction. Succinate and acetate peaks are additional peaks noted on MR spectroscopy. Advanced techniques such as magnetization transfer (MT) imaging can further aid the diagnosis.
Neurotuberculosis results from hematogenous dissemination and constitutes 1% of all tuberculosis and 10–15% of extrapulmonary tuberculosis cases. The common spectrum of CNS involvement includes tuberculous meningitis and its complications, tuberculoma(s), focal cerebritis, and tubercular abscess. Tuberculoma begins as a non-caseating granuloma consisting of a necrotic center surrounded by lymphocytes and epithelioid and Langerhans giant cells encircled by a richly vascular zone. These lesions can further evolve into caseating abscesses and may continue to grow – forming a giant tuberculoma. The central caseation is initially solid and comprises a cheesy material with a high lipid content, macrophage infiltration, fibrosis/gliosis, free radicals, and may contain few bacilli. The center is surrounded by a thick collagenous capsule, epithelioid cells, multinucleated giant cells, and macrophages. Tuberculomas are commonly accompanied by extensive perilesional edema.
Magnetic resonance imaging features vary, according to the stage of the lesion. Non-caseating granulomas are usually isointense to hypointense on T1-weighted images, hyperintense on T2-weighted images, and hyperintense on FLAIR. Nodular or ring enhancement may be seen with diffusion restriction. Caseating tuberculomas with a solid center appear relatively isointense to hypointense on both T2- and T1-weighted images. These lesions are surrounded by a rim of variable thickness that may appear hyperintense on T1- and T2-weighted images with ring enhancement; evidence of diffusion restriction is noticeably absent. Tuberculomas are characterized by the presence of a target sign consisting of a ring-enhancing lesion with an additional central area of enhancement or calcification. The target sign should not be confused with the eccentric target sign seen in toxoplasmosis cases. When liquefaction of the central caseation occurs within a tuberculoma, it appears hypointense on T1-weighted images. T2-weighted images demonstrate a central T2 hyperintense signal with a peripheral T2 hypointense rim. Diffusion restriction of the central liquefying caseous material can be seen with rim enhancement. The varied appearances of tuberculoma are stage dependent, mimicking cancerous lesions and/or abscesses.
Advanced neuroimaging techniques such as magnetization transfer (MT) imaging, SWI, MR spectroscopy, and dynamic contrast-enhanced (DCE) perfusion studies are helpful in differentiating tuberculoma from other intracranial space-occupying lesions. A decrease in NAA/Cr and in NAA/Cho ratios and a prominent lipid resonance at 1.3 ppm, 2.02 ppm, and 3.7 ppm are seen during in vivo MR spectroscopy. The tuberculoma wall is rich in lipid content, secondary to inflammatory cellular infiltrate and tuberculous breakdown products from degrading bacilli. The tuberculoma wall typically demonstrates hyperintensity on MT T1-weighted images and lower MT ratios ranging from 18% to 22%. Susceptibly-weighted images may help differentiate tuberculomas from other lesions by demonstrating a lack of blooming artifact from calcification or blood products. According to recent neuroradiology literature, giant tuberculomas may show varying degrees of vascularity on MR perfusion studies. In this patient, the brain imaging shows a large lesion that appears hypointense on both T1- and T2-weighted images, with thick and irregular rim enhancement. There is associated, extensive perilesional vasogenic oedema. There is low rCBV in the lesion on perfusion imaging and a large lipid peak at 1.3 ppm with a decrease in NAA/Cho ratio on MR spectroscopy. All these features are suggestive of a giant caseating tuberculoma. Polymerase chain reaction analysis aids in diagnosing CNS tuberculosis. A combination of MR images and PCR results can confirm suspected diagnosis of CNS tuberculosis. Surgical excision of the lesion is helpful in establishing the histopathologic diagnosis; however, bacilli may not always be evident.
Stay updated, free articles. Join our Telegram channel

Full access? Get Clinical Tree


