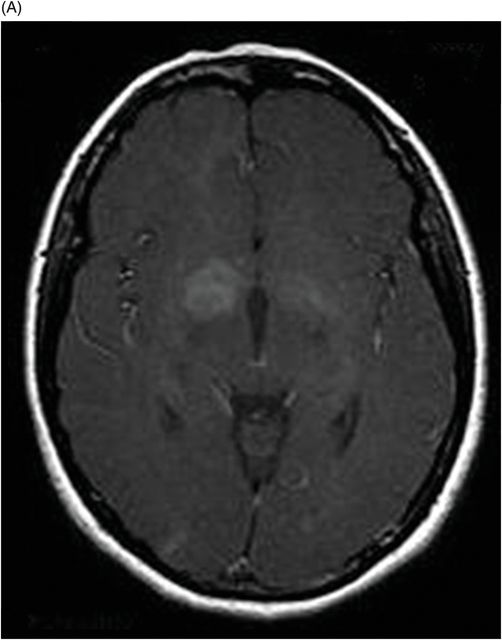
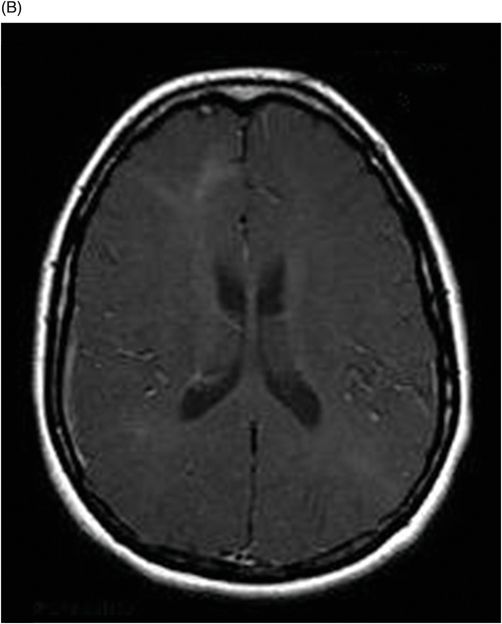
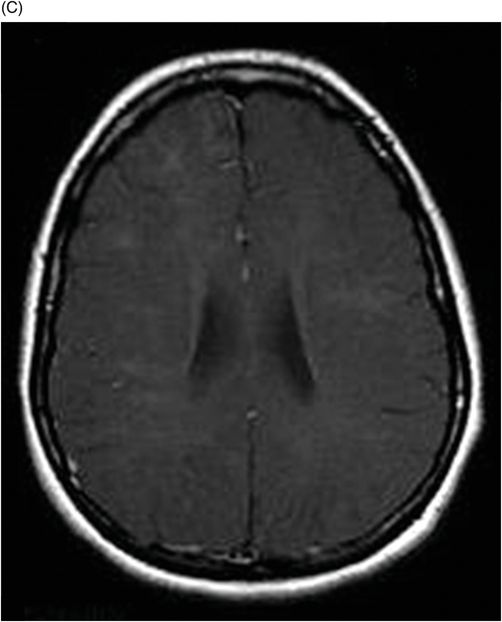
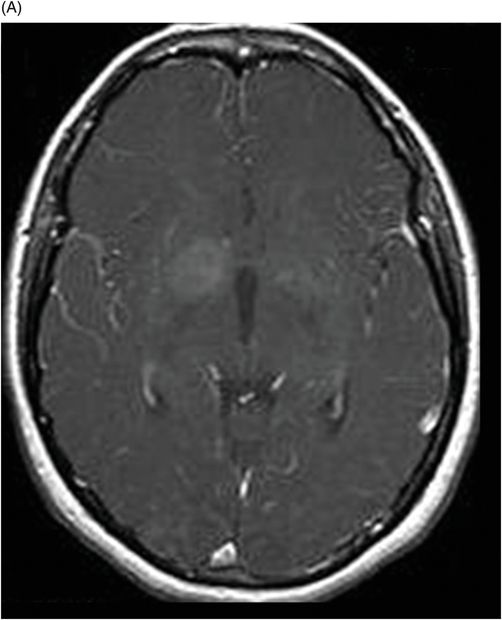
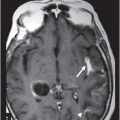
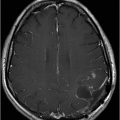
(A–B) Axial T1 postcontrast MR images through the level of the basal ganglia and lateral ventricles.
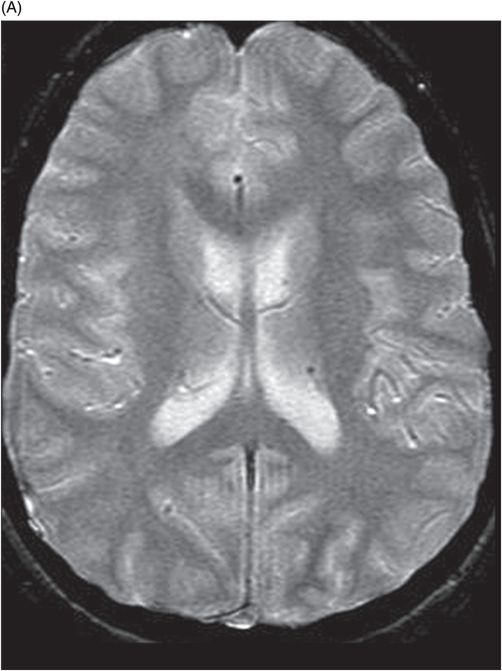
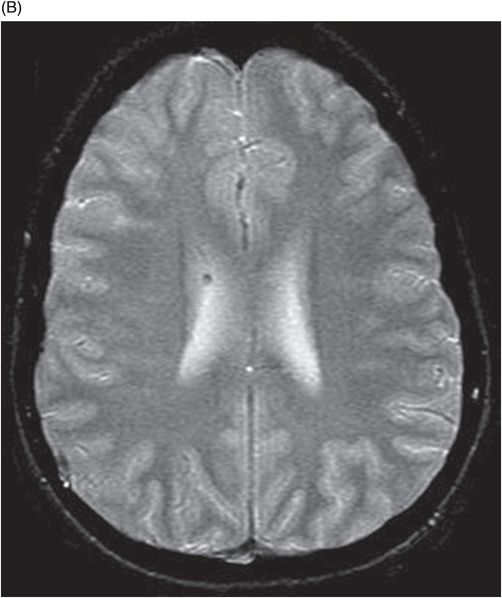
(A–B) Axial MPGR-T2* images through the level of the lateral ventricles.
Hybrid Phakomatosis
Primary Diagnosis
Hybrid phakomatosis
Differential Diagnoses
Acute disseminated encephalomyelitis (ADEM)
Gliomatosis cerebri
Imaging Findings
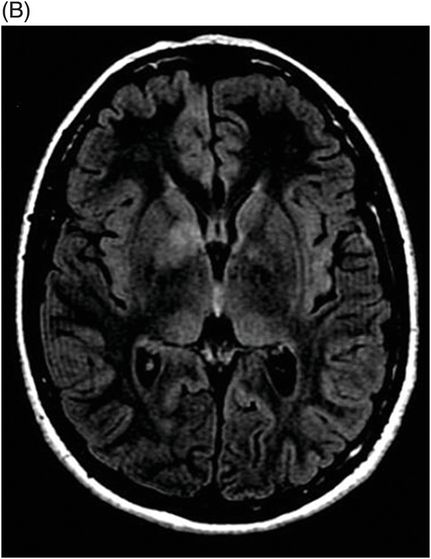
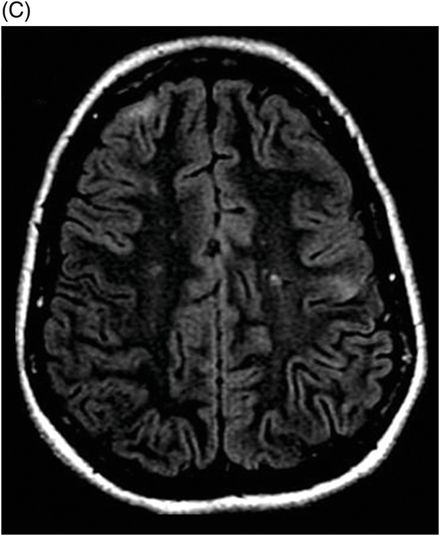
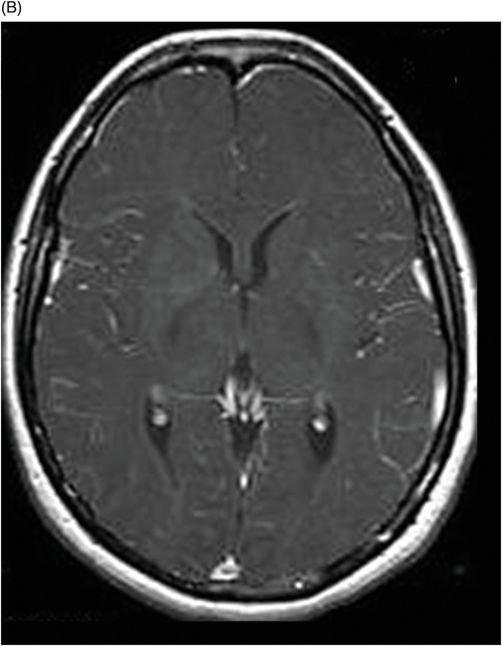
Fig. 121.1: (A–C) Axial FLAIR showed some enlarged gyri with T2 high signal in subcortical white matter, extending to lateral ventricles. Some rounded spots with T2 high signal can also be seen in cerebellar white matter, pons, basal ganglia, and both thalami. Fig.121.2: (A–C) Axial T1-MTC showed hyperintense signal in the basal ganglia and radial bands from the subcortical white matter, extending to the lateral ventricles. Fig. 121.3: (A–B) Axial T1WI postgadolinium did not show enhancement. Fig. 121.4: (A–B) Axial MPGR-T2* showed some small calcifications in the subependymal region.
Stay updated, free articles. Join our Telegram channel

Full access? Get Clinical Tree


