- State the magnitude and source of natural background radiation
- State the fraction of environmental radiation in the United States that is due to medical exposure
- List the health effects of background radiation
- Compare risk versus benefit in various occupations and activities
Introduction
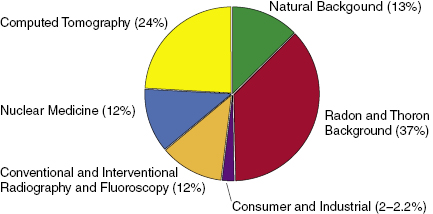
Everyone is constantly exposed to radiation from the environment. Environmental radiation comes from the sky, the earth, and the air we breathe and can be categorized as natural or artificial. In 2009, the National Council on Radiation Protection (NCRP) published NCRP Report 160, which is a summary of the radiation exposure to the United States population in 2006. Background radiation can be divided into two sources: man-made and natural background. The average total effective dose to a person living in the United States in 2006 was 6.2 mSv, of which medical exposure was 3.0 mSv. Table 14.1 shows the estimated effective doses to an individual in the United States as published in NCRP Report 160. Figure 14.1 shows the relative magnitude of various environmental radiation sources.
Table 14.1 Estimated Effective Doses per Individual in the U.S. Population (from NCRP 160)
| mSv | % | |
|---|---|---|
| Internal, inhalation (radon and thoron) | 2.3 | 36.5 |
| External, space | 0.3 | 5.3 |
| Internal, ingestion | 0.3 | 4.6 |
| External, terrestrial | 0.2 | 3.4 |
| Natural background dose | 3.1 | |
| CT | 1.5 | 23.5 |
| Nuclear medicine | 0.8 | 12.3 |
| Interventional fluoroscopy | 0.4 | 6.9 |
| Conventional radiography and fluoroscopy | 0.3 | 5.3 |
| Medical dose | 3.0 | |
| Other | ||
| Consumer products | 0.1 | 2.2 |
| Industrial, security, medical, educational, and research | <0.1 | <0.1 |
| Occupational—average | <0.1 | 0.1 |
| Total effective dose | 6.2 | 100 |
Natural Background Radiation Sources
Figure 14.2 illustrates the major sources of natural background radiation. They are internal, cosmic, and from rocks and dirt from the earth. The amount of these sources can vary considerably. Locations at higher altitude or in regions with high radioactive minerals have higher background radiation levels.
Figure 14.2 The figure shows many of the man-made sources or radiation that the public is exposed to daily.
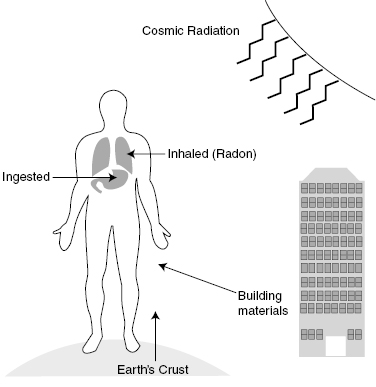
Table 14.2 lists the magnitude of the prominent sources of natural background radiation. The effective dose (E) from all of these sources is about 3.11 mSv/year. Seventy-three percent comes from internal inhalation mostly from radon. Eleven percent comes from external sources including outer space, followed by 9% from internal ingestion, and 7% by external terrestrial.
Table 14.2 Effective Doses from Background Radiation
| Source | Effective Dose (mSv) |
|---|---|
| Space (cosmic) | 0.33 |
| Terrestrial | 0.21 |
| Potassium K-40 | 0.15 |
| Ingested thorium and uranium series | 0.13 |
| C-14, Rb-87 | 0.01 |
| Inhalation radon 222-Rn | 2.12 |
| Inhalation thoron 220-Rn | 0.16 |
| Total | 3.11 |
Inhalation Sources
Radon is produced through the decay of uranium and thorium that are found naturally in the earth’s crust. One of the products of this decay is 222Rn, which is an inert noble gas that is capable of moving from the ground into the air we breathe. Another product is 220Rn, which is called thoron. On average, 222Rn contributes 2.12 mSv/year and 220Rn contributes 0.16 mSv/year.
222Rn also known as radon is produced by the decay of 226 radium. Radium has a half-life of 1622 years. Radon decays to 218 polonium by alpha decay with a half-life of 3.8 days. Radon is a gas that decays to a solid, so when it is inhaled, the decay products stay in the body. Most of the dose to the body comes from alpha particles in the trachea, bronchus, and lungs.
Radon is a gas, as such diffuses from its point of origin. The amount of radon activity depends on the local concentrations and the soil porosity. Radon concentrations in open air are low because there is rapid mixing. However, in buildings, it moves by diffusion. Radon itself poses little biological danger. However, its daughter products are alpha emitters, are solids, and contribute to the internal dose in the tracheobronchus and lungs. Radon gas exposure can be higher in buildings because it is heavier than air and is often trapped in basements.
Radon gas is the largest component of natural background radiation. The Environmental Protection Agency (EPA) estimates that radon is the primary cause of lung cancer deaths in nonsmokers. BEIR IV (1998) report estimates that radon inhalation is thought to contribute 10% of the fatal lung cancer in the United States.
Radon gas is easily measured by an etched track detector or by using a small jar filled with activated charcoal. Outdoor levels are low with an average level of 7 Bq/m3 and typical indoor levels with an average of 45 Bq/m3. Indoor concentrations vary by location and building material. Areas near uranium mining usually have higher concentrations of radon gas. The EPA action limit for the radon gas in a home is 4 pCi/L, which is equal to 148 Bq/m3. Ninety-five percent of the homes in the United States are under this action level.
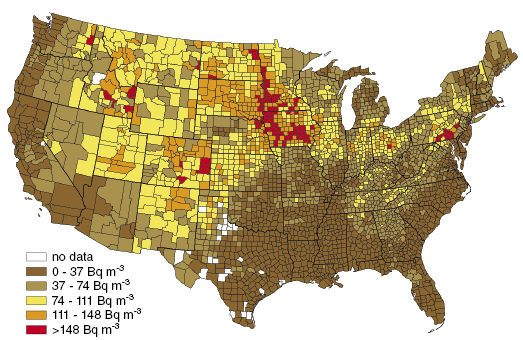
Figure 14.3 shows the distribution of radon concentration in living areas in the United States. The coastal areas have the lowest concentrations with less than 37 Bq/m3 while the central part of the United States has the highest with greater than 148 Bq/m3.
Figure 14.3 The radon concentration in areas in the United States as shown in NCRP 160. The darker areas indicate higher radon concentrations.
Internal Sources
Foods rich in potassium contain a small fraction of 40K, which is made in the upper atmosphere and has a half-life of 1.3 billion years. 40K has a natural abundance of 0.0117%, about 4400 nuclei of 40K decay per second in the human body. Table 14.2 shows that 40K contributes 0.15 mSv to the annual effective dose. The dose contributions from radon-220, lead-210, and polonium-210 are less than that of 40K. Radium in the body is found mostly in the bone, as it is close to calcium in its atomic structure. It enters the body by ingestion of food.
As a side issue, food irradiated for preservation does not become radioactive from the irradiation process. Therefore, there is no residual radiation that would contribute dose to the population.
Cosmic Radiation
Cosmic radiation comes from the sun and outer space. Cosmic radiation contributes approximately 0.33 mSv/year. Most of it comes from directly ionizing radiation—90% protons and 9% alpha particles. While most cosmic radiation is either deflected by the earth’s magnetic field or absorbed by the atmosphere, a small amount reaches the earth’s surface to which we are exposed. The atmospheric attenuation of cosmic radiation is equivalent to about 10 m of water. Cosmic radiation is not uniform on earth. It is highest at the north and south poles and minimum at the equator.
The exposure to this type of radiation is higher for people living above sea level. For example, people living in Albuquerque or Denver will have an increased cosmic ray dose of 0.29 mSv/year above those people living at sea level. People living above 2500-m (∼8000 ft) elevation will have an additional 0.70 mSv/year higher than people living at sea level.
Cosmogenic radioisotopes contribute some to the daily background exposure. These isotopes are produced by cosmic radiation interacting with the upper atmosphere. Of all the isotopes bombarding us, only tritium (3H), beryllium (7Be), carbon (14C), and sodium (22Na) contribute significantly. 14C is the major contributor at 0.01 mSv/year. Recall that 14C has a half-life of 5730 years and is used for “carbon” dating of living organisms. While an organism is alive, it exchanges 14C with regular carbon in the organism and reaches equilibrium. When it dies, this exchange stops, and the carbon to 14C ratio is no longer in equilibrium. The ratio of nonradioactive carbon to carbon can be used to date the material.
Primordial and Terrestrial
Stay updated, free articles. Join our Telegram channel

Full access? Get Clinical Tree


