(7.1)
where r is the average displacement and D is the diffusion coefficient. A typical value for the brain is D = 0.001 mm2/s.
One of the primary clinical applications of diffusion MRI is in stroke disease, where changes in diffusion-weighted MRI (DWI) are visible at earlier stages of injury development when compared to conventional T2-weighted MRI [3, 4]. Moreover, advanced applications of DWI such as diffusion tensor imaging (DTI) provide a powerful tool to map white matter fibre bundles, allowing the investigation of structural connectivity of the brain that complements fMRI studies of functional connectivity [5–7].
7.2 Diffusion MRI Measurements
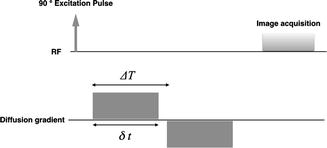
The basic principle to make the MRI signal sensitive to the diffusion process is based on the addition of a pair of strong bipolar gradient pulses to the acquisition sequence [8]. The second gradient is oriented in the same spatial direction but has inverse polarity with respect to the first gradient (Fig. 7.1). The net effect of this gradient pair is to restore the phase coherence of stationary spins, while the randomly diffusing spins experience a phase coherence loss proportional to their displacement in the gradient direction. In practice, the most commonly implemented acquisition modality is the Stejskal-Tanner spin-echo scheme. With a spin-echo acquisition, the principle is the same, but the two gradients have the same polarity and are applied symmetrically on both sides of the 180° refocusing pulse. In the case of free diffusion, with a Gaussian distribution of spin phases, the signal is attenuated by a factor A that depends on the value of D and sequence parameters [9]:

(7.2)
Fig. 7.1
Schematic of the bipolar gradient pulse making the MRI signal sensitive to diffusion. The timing parameters have the same meaning of those appearing in formula 7.3
In particular, the factor b is an experimental parameter that depends on the strength and duration of the applied gradient pulses:
where γ is the gyromagnetic ratio, G is the strength of the diffusion gradients, δt is the duration of the diffusion gradients and ΔT is the interval between the start of the diffusion gradients [8, 10, 11].
(7.3)
The net signal in a diffusion-sensitized MR image is

where S 0 is the signal obtained without the application of the diffusion gradients, i.e. with b = 0. The diffusion coefficient D can then be calculated by acquiring an image with no diffusion gradients applied (b = 0) and the same image with a large value of b. The ratio of the two signals is the attenuation factor A from which D can be derived using the relation (7.2). This calculation is performed voxel by voxel producing an image of D that is usually called a map of the apparent diffusion coefficient (ADC). Note that the signal (4) in the DWI image itself contains also other weighting (e.g. a certain T2 weighting in the S 0 term). However, if the same echo time is used for both the low and high b value, the T2 effects cancel out, and the obtained ADC map is a quantitative measure of the diffusion characteristics of local tissues. In practice the low b value is often selected slightly greater than 0 to eliminate the effects of large vessels and flow [12], while for the high b value image, a typical value is b = 1000 s/mm2, producing a measurable attenuation of the signal and then a good signal-to-noise ratio for the derived ADC map.
(7.4)
Equation (7.2) is strictly valid for free diffusion in a simple medium (e.g. pure water), leading to a Gaussian distribution of the molecular random displacements. In most biological tissue, the picture is more complex, and the diffusion of water molecules takes place in a multicompartment environment, each characterized by its own diffusion coefficient.
For example, intracellular water has a significantly smaller diffusion coefficient than extracellular water. If the exchange of water molecules between the two compartments is fast compared to the timing of the MRI experiment (fast exchange regime), the tissue behaves like a uniform medium with a diffusion coefficient equal to the weighted mean of the two diffusion coefficients:
where the weights ve and vi are the volume fractions of the two compartments (about 20 % for the extracellular space and 80 % for the intracellular space).
(7.5)
Instead, if a diffusing water molecule remains in the same compartment during the MRI measurement (slow exchange regime), the dependence of the attenuation factor on the b value deviates from eq. (7.2) and is better represented by a biexponential form [13]:
where ve and vi are again the volume fractions of the two compartments. In this case, measurements with many b values are required to fully characterize multicompartment diffusion in a tissue. The presence of tissue structures, such as cell membranes, has also other effects on diffusion. These structures act like barriers, restricting the diffusion phenomenon. Considering for simplicity a single compartment (e.g. the intracellular space enclosed by a membrane), the diffusion of water molecules will be restricted by the membrane in the sense that after a certain diffusion time, a fraction of the molecules reaching the barrier will bounce back rather than diffusing past. The result is that the apparent D is smaller than expected when measured with longer diffusion times. Furthermore, the shape of the distribution of random displacements of diffusing water molecules is no longer Gaussian as in free diffusion, compromising the validity of eq. (7.2). Advanced approaches have been developed exploiting the effects of restriction on diffusion to probe the structural composition of tissues. One approach, called diffusion spectrum imaging (DSI), showed promise to infer structural information from complex tissue architecture as micrometric interdigitating muscle fibres and crossing axonal fibres [14]. However, with DSI, many b values and consequently long acquisition times are needed to collect sufficient data for a full evaluation of the local diffusion characteristics. Another approach, called diffusion kurtosis imaging (DKI), provides a quantitative estimate of how the distribution of random displacements in restricted diffusion differs from a Gaussian [15]. This technique is less time-consuming since it requires a limited number of b values and may provide a powerful tool to investigate neural tissue in both health and disease [16, 17].
(7.6)
7.3 Non-EPI Diffusion-Weighted Imaging
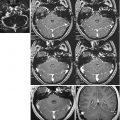
Echo-planar diffusion-weighted imaging (EP-DWI) sequences are more sensitive to image artefacts than conventional imaging sequences because of two main reasons. Firstly, in EP-DWI, every second echo is acquired under a negative gradient. Consequently, any imperfection in the acquired signal (e.g. eddy current, heterogeneity of the radiofrequency receive path, etc.) leads to an alternate line variation in the raw data, resulting in a ghost image shifted by half of the field of view after Fourier transformation (N/2 ghosting). Secondly, in EP-DWI, acquisition time is longer. Hence, the longer readout period can cause several artefacts: large fat-water shift, geometric distortions due to Bo inhomogeneity, signal loss due to dephasing and resolution loss due to filter effect by T2* [18].
EPI artefacts are common in areas of great field inhomogeneity and multiple bone-air-soft tissues interfaces, causing frequent diagnostic issues in case of pathology affecting the skull base.
Very high specificity of DWI technique for keratin-containing lesions affecting the skull base (cholesteatoma and epidermoid cyst) has prompted MR imaging vendors to develop fast spin-echo-based non-EPI DWI techniques in order to reduce false negatives due to susceptibility artefacts.
Related posts:
Stay updated, free articles. Join our Telegram channel

Full access? Get Clinical Tree


