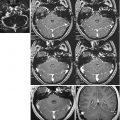
Fig. 15.1
Small hyperacute stroke. The standard MR study (T2 FSE) is negative (a). The DWI image shows a hyperintense left subcortical parietal ischaemic focus (b)
Also in MR studies, one of the first signs of ischaemia secondary to arterial occlusion is a signal change in the lumen of the blocked vessel. Whereas in SE sequences vessels normally present a signal void due to arterial and/or turbulent flow (Fig. 15.2), occluded vessels exhibit a characteristic hyperintensity, especially in FLAIR sequences, with an accuracy that is comparable to that of MRA [7, 8].


Fig. 15.2
Combined study with morphological MR sequences in the hyperacute phase. The brain parenchyma does not exhibit ischaemic foci on the standard study (T2 FSE) (a); note the flow void in the intracavernous tract of the left internal carotid artery. This finding is confirmed by the 3D TOF MRA study with coronal reconstruction (b)
Even though the cytotoxic oedema does not give rise to signal changes, it can be indirectly detected in cortical areas through gyral swelling, sulcal effacement and a loss of grey-white matter interface definition. Contrast-enhanced sequences, which are not employed routinely, show vascular enhancement due to the slower flow in the occluded or tributary vessel, sometimes associated with tissue enhancement due to local hyperaemia or extravasation of contrast agent through the disrupted endothelium. MR signal changes become evident in the acute phase, when the vasogenic oedema induces hyperintensity in long TR (FSE T2 and FLAIR) sequences (Fig. 15.3) and contrast-enhanced scans may depict a pathological meningeal enhancement [9]. In the subacute phase (3–14 days), the signal changes are more marked due to the increasing mass effect and manifest as a signal increase in T2 FSE and FLAIR sequences and hypointensity in T1 SE. On contrast-enhanced scans, enhancement of the infarcted area, which can persist for more than 2 months, is due to the recanalization of the occluded vessel, the opening of collateral circles (luxury perfusion) and BBB changes. In 20 % of cases, rupture of the vascular endothelium following thrombolysis may result in haemorrhage. This phenomenon appears as hypointense foci in T2 and is best seen in GE sequences [10]. In the chronic phase, a very hypointense “haemosiderin tattoo” due to even slight earlier bleeding is consistently detected in all sequences [2].


Fig. 15.3
Combined study with morphological MR sequences in the acute phase. Vast right cerebellar stroke. Right cerebellar hypodense area in T1 FSPGR (a); ill-defined right hemicerebellar hyperintense area in T2 FSE (b). Occlusion of the right vertebral artery in 3D TOF MRA (c)
Chronic-phase MR findings reflect the morphostructural changes induced by the progressive shrinking of the lacunae, which have a cerebrospinal fluidlike content, while the hyperintensity of the adjacent brain parenchyma (particularly evident in FLAIR sequences) is due to reparative gliosis (Fig. 15.4). In this phase, signs of Wallerian degeneration of axons (and their myelin sheaths) originating from the infarcted area must be sought. Anterograde axon degeneration, which initially induces degradation of the protein component of myelin while comparatively sparing its lipid component (low signal in FSE T2 sequences), and afterwards reparative gliosis, is depicted on standard MR only in very late phases, i.e. when the axon degeneration has become irreversible. Again, earlier detection of these phenomena can be obtained with DWI [10].


Fig. 15.4
Lacunar sequelae of a left capsular ischaemic stroke in FLAIR (a) and T2 FSE(b)
15.3.2 MR Diffusion
DWI is the most sensitive technique to diagnose hyperacute-phase brain ischaemia (Fig. 15.1). Based on the diffusion of water molecules in the cell compartment, their random movement induced by thermal energy can be measured using conventional SE echo-planar sequences acquired with specific weighting. These sequences are sensitive to the movement of H2O molecules and demonstrate the changes in diffusion induced by pathological events in the form of images and numerical values. In hyperacute ischaemia, the histopathological injury is the cytotoxic oedema; the H2O molecules trapped in the cell thus exhibit an impaired diffusion, which is detected in a few minutes as a signal increase in the pathological tissue [11–13].
DWI techniques are sensitive as well as specific (90 % and 99 %, respectively); these two parameters are directly proportional to the time since disease onset. These techniques show a high predictive value as well. A negative DWI study does not however exclude a diagnosis of ischaemia. Not all patients with a typical picture of stroke also display an altered DWI signal; this may be due to complete recovery from a TIA, to a nonischaemic event or to symptomatic hypoperfusion [14, 15]. Obviously, the DWI study may also have preceded the establishment of an infarcted area, or the lesion may be very small and lie in areas especially difficult to investigate with this method (temporal regions, posterior cranial fossa, medulla); these kinds of lesion may be better detected using elevated b values [16].
Unlike standard MR, where the hyperintensity of the ischaemic area in long TR sequences corresponds with the expansion of the vasogenic oedema, DWI enables precise evaluation of the injured tissue because the signal hyperintensity peaks within 24 h of clinical onset and never later. In addition, DWI sequences afford separate visualization of the acute ischaemic area, characterized by strongly reduced diffusion, from the peripheral area, where the apparent diffusion coefficient (ADC) is less affected (although PWI techniques are even more informative; see below) and the tissue damage may be reversed [17]. This is the ischaemic penumbra, which has not sustained a stroke proper but exhibits the predisposing physiopathological conditions for a new stroke (energy deficit), making it a high-risk area in the subacute phase. Adequate reperfusion often results in functional recovery of the ischaemic penumbra [13].
Another advantage of DWI over standard MRI is that, in patients with multifocal leukoencephalopathy, it allows the identification of the ischaemic lesions responsible for the active symptoms.
15.3.3 MR Perfusion
PWI techniques study changes in blood flow at the level of the microcirculation using ultrafast sequences with a bolus of paramagnetic contrast medium (gadolinium, Gd) [18]. In normal perfusion and intact BBB conditions, Gd, though remaining confined to the intravascular space, induces a reduction in T2 signal both in vessels and in the brain parenchyma. In a hypoperfused area (for instance, one due to a vascular occlusion), the signal reduction is delayed or attenuated (due to magnetic susceptibility) because of the diminished flow. Since the signal reduction correlates directly with Gd concentration, and thus with cerebral blood volume (CBV), parametric CBV maps of the areas with reduced signal intensity can also be generated.
In stroke patients, the main role of PWI studies is to identify the ischaemic penumbra in the acute phase. Studies of the relationship between cerebral blood flow (CBF) and neuronal disruption have evidenced that there is a short interval related to CBF changes, where neurons, though no longer efficient, are still viable and can be rescued with a suitable therapy. The extension of this area depends both on the duration of the ischaemia and on its entity, because even mild ischaemia, which does not necessarily cause neuronal damage, may induce irreversible injury if protracted.
15.3.4 Combined Diffusion and Perfusion Studies
DWI and PWI studies are more informative in combination than singly, especially in predicting clinical evolution and outcome and thus in guiding therapy [10, 15, 19–22].
Six different patterns can be identified using combined studies:


- 1.
The area exhibiting reduced perfusion, which also includes the penumbra, is larger than the one exhibiting reduced diffusion (Fig. 15.5). A PWI > DWI mismatch is the most common pattern (55–77 % of cases), especially in the hyperacute phase. From the point of view of clinical evolution, early PWI scans depict the maximum size attainable by the infarcted area and, in absence of further vessel occlusion or closure of collateral circles, the worst clinical outcome.
- 2.
Similar pathological areas with both methods (Fig. 15.6).
- 3.
A smaller pathological area on PWI (PWI < DWI mismatch).
- 4.
Presence of diffusion, not perfusion, deficits.
- 5.
Presence of perfusion, not diffusion, deficits (usually associated with a transient neurological deficit).
- 6.
Negative diffusion and perfusion studies despite an evident clinical alteration.

Fig. 15.5
Combined functional study with DWI < PWI mismatch. DWI (a), ADC map (b) and regional CBV map (c). Note that the hypoperfused area (c) is broader on PWI (a, b)

Fig. 15.6
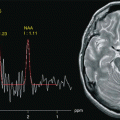
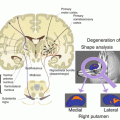
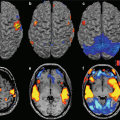
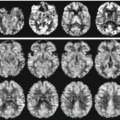
Combined functional study without mismatch (DWI = PWI). Vast right parietal-occipital ischaemic stroke in the hyperacute phase. Ischaemic multifocal leukoencephalopathy without recent ischaemic lesions in T2 EPI (a). Marked hyperintensity of the infarcted area in DWI (b). Right parietal-occipital signal hyperintensity in PWI (c) indicating reduced perfusion of the ischaemic area of similar extension as the one shown in DWI. The spectroscopic single-volume short-TE image shows a marked reduction in the NAA, Cho and Cr peaks and a Lac peak at 1.3 ppm (d)
15.3.5 MR Spectroscopy
MR spectroscopy enables non-invasive in vivo study of some phases of brain metabolism. It is based on the same principles as conventional MR, except that it envisages signal processing during and after sequence acquisition. Whereas in standard MR, the signal intensity is the sum of the signals from all the hydrogen-containing molecules in a given volume, in spectroscopy the signal from a given nucleus is separated into its chemical components. The physical principle underpinning the change in the resonance frequency of nuclei is the chemical shift. This is influenced by the magnetic field generated by the cloud of electrons that surrounds the nuclei as well as by the clouds of electrons of nearby atoms, which interact with the main magnetic field. An atom is thus subject to different chemical shifts as a function of the molecule in which it is found, thus enabling identification of the molecule containing it. Hydrogen spectroscopy is currently the most widely used of these techniques, because it can be performed with the same machine as standard MRI using appropriate software. It records signals from N-acetylaspartate (NAA), choline (Cho), creatine (Cr) and phosphocreatine (PCr), myo-inositol (mI), lactate (Lac), lipids (Lip) and glutamine and glutamate (Glx). These metabolites are found in nerve cells at greater than millimolar (mM) concentrations and have spectra at known positions, which are expressed as parts per million (ppm).
Stay updated, free articles. Join our Telegram channel

Full access? Get Clinical Tree


