One of the crucial decisions when viewing chest radiographs is determining the location of a potential lesion, in particular whether the lesion is primarily in the lung, the hilum, the mediastinum, the pleura, the chest wall, or the diaphragm. Indeed the distinction is so important that most textbooks, including this one, are organized according to anatomic divisions. In this chapter and the following one on high-resolution computed tomography (HRCT), the discussion is centered on the signs of diseases of the lungs on chest radiography and on CT.
Two interrelated chest radiographic signs – the silhouette sign and the air bronchogram – are considered first because they have widespread diagnostic applicability.
SILHOUETTE SIGN
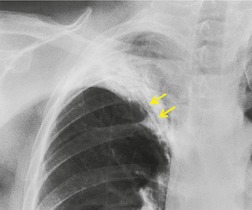
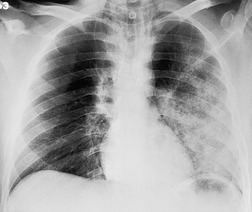
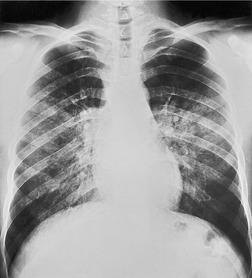
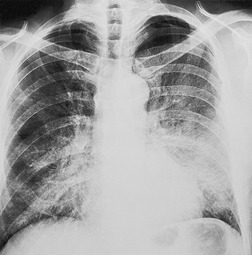
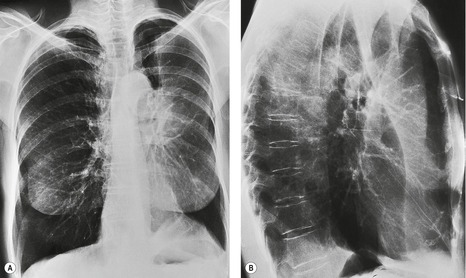
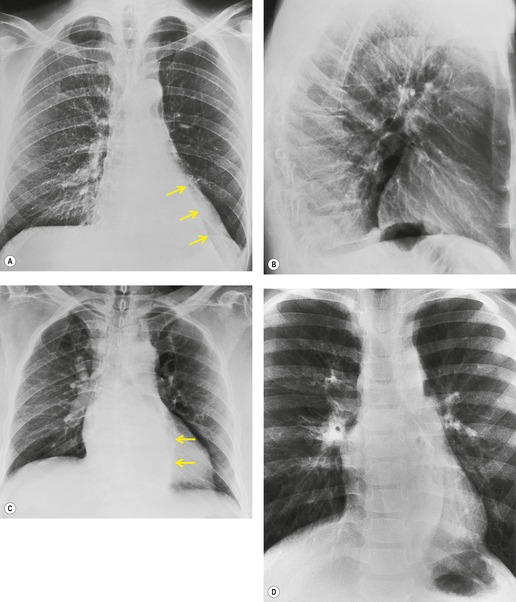
Felson and Felson1 popularized the term ‘silhouette sign’. They wrote, ‘An intrathoracic lesion touching a border of the heart, aorta, or diaphragm will obliterate that border on the roentgenogram. An intrathoracic lesion not anatomically contiguous with a border of one of the structures will not obliterate that border’. The lesion responsible for obliterating a silhouette (Figs 3.1 and 3.2) does not have to be large, nor does the opacity have to originate within the lung; pleural fluid, extrapleural fat, chest wall deformity, and mediastinal masses may all cause a loss of silhouette.2. and 3.
 |
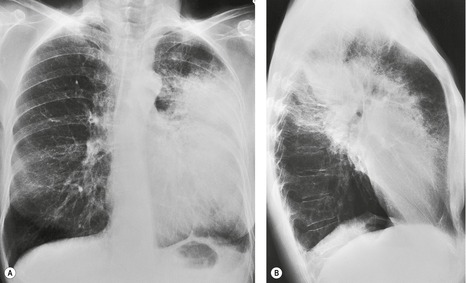
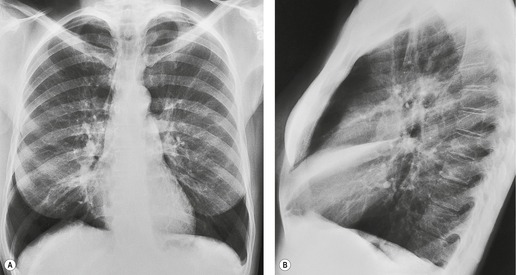
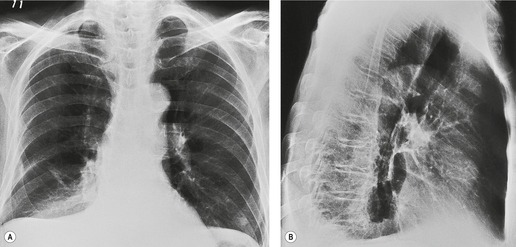
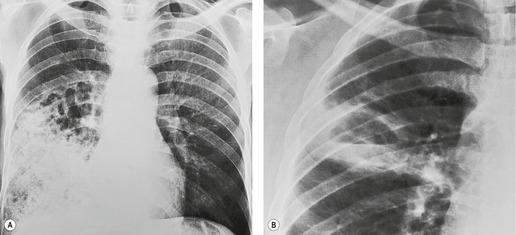
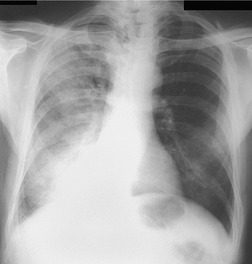
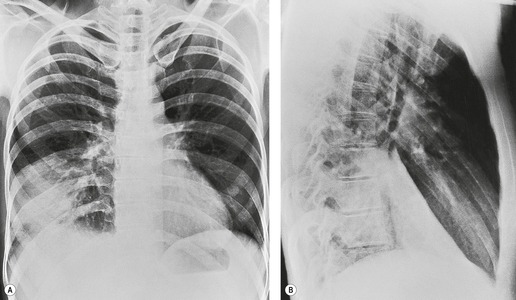
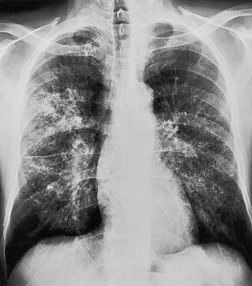
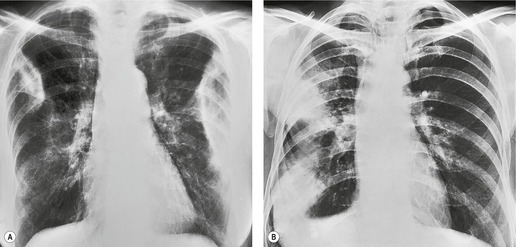
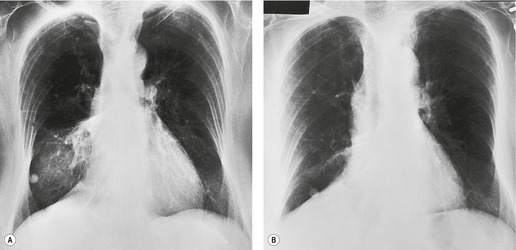
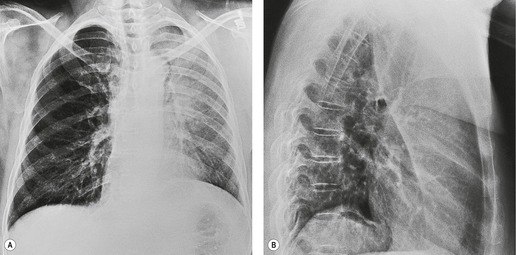
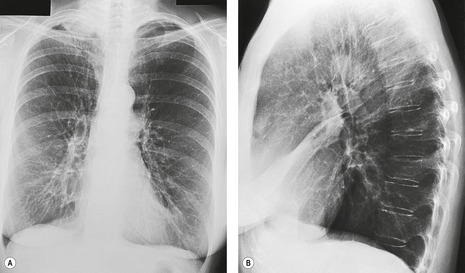
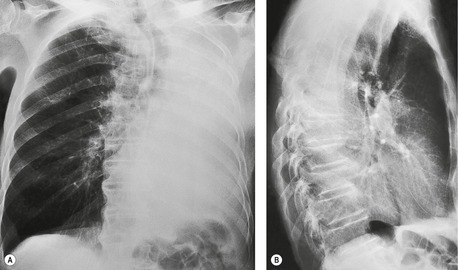
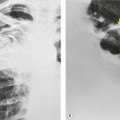
| Fig. 3.2 The silhouette sign. A, A small patch of pneumonia in the anterior segment of the left lower lobe has resulted in lack of visibility of the outer half of the left hemidiaphragm. (The lateral view in this patient is shown in Fig. 3.14.) B, Normal diaphragm outline after the pneumonia has resolved. |
Felson and Felson believed the sign depended solely on direct contact. It may, however, be due to absorption of X-rays by whatever lies in the path of the beam; the reason the border is lost only in cases of direct contact is that precise anatomic conformity of shape occurs only when intimate contact is present.
The silhouette sign can be used in two ways:
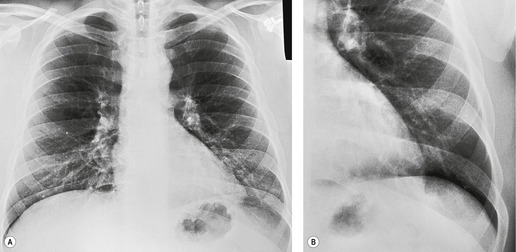
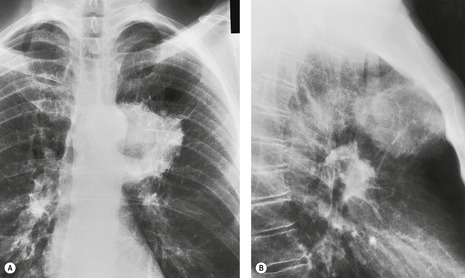
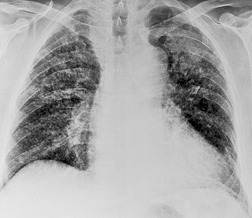
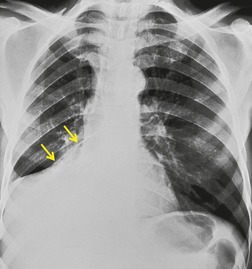
• To localize a radiographic density (Figs 3.3 and 3.4) because, in practice, the lesion lies immediately adjacent to the structure in question. Thus opacities in the right middle lobe or lingula may obliterate the right and left borders of the heart, respectively (Figs 3.1 and 3.5), whereas opacities in the lower lobes may partially obliterate the outline of the descending aorta and diaphragm but leave the cardiac outline clearly visible (Fig. 3.6). Similarly, the aortic knob will be rendered invisible if there is no air in the adjacent left upper lobe. A good example of detecting lesions of low radiopacity is collapse of the right middle lobe (Fig. 3.5).
• to detect lesions of low radiopacity when the loss of silhouette is more obvious than the opacity itself (Fig. 3.2).
Felson and Felson1 warned that mistakes will be made unless the following points are borne in mind:
• The technical quality of the radiograph must be such that the diseased area is adequately penetrated. Underpenetration may result in loss of visibility of a normal border.
• The outline of a portion of the cardiovascular structure in question must be clearly visible beyond the opacity formed by the spine. In many healthy individuals the right border of the heart and ascending aorta do not project into the right hemithorax. In these patients the silhouette sign cannot be applied on the right.
Felson and Felson1 also pointed out that there are patients in whom no disease and no satisfactory explanation for the loss of the right heart border is found. These cases are, however, few and do not reduce the overall value of the sign.
AIR BRONCHOGRAM
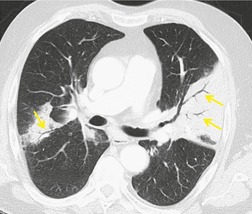
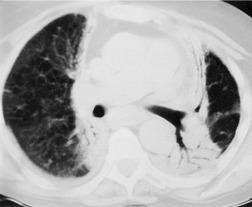
Normal intrapulmonary airways are invisible on chest radiographs unless end on to the X-ray beam, but air within bronchi, or bronchioles, passing through airless parenchyma may be visible as branching linear lucencies. The resulting image is called an air bronchogram (Fig. 3.8). An air bronchogram within an opacity reliably indicates that the opacity is intrapulmonary and not pleural or mediastinal in location. 3 The sign is particularly well seen on CT (Fig. 3.9).
The most common causes of an air bronchogram (see Box 3.1) are consolidations of various origins and pulmonary edema. Similarly, widespread air bronchograms are seen in hyaline membrane disease. Air bronchograms are also seen in atelectatic lobes on chest radiographs when the airway is patent, notably when atelectasis is caused by pleural effusion, pneumothorax, or bronchiectasis.
Box 3.1
• Normal expiratory radiograph
• Infective consolidation
• Pulmonary edema
• Acute respiratory distress syndrome (in adults) or hyaline membrane disease (in neonates)
• Compression atelectasis (e.g. pleural effusion)
• Scarring, e.g. radiation fibrosis, bronchiectatic lobe
• Severe interstitial disease, e.g. sarcoidosis
• Certain neoplasms (notably bronchioloalveolar cell carcinoma, lymphoma)
There are four less predictable causes of air bronchograms:
• Bronchioloalveolar cell carcinoma (Fig. 3.10) and lymphoma grow around airways without compressing them. Therefore, in these diseases, air bronchograms may be visible even on chest radiographs. Air bronchograms in other lung malignancies, such as small adenocarcinomas, may only be defectable on CT.4.5.6.7. and 8.
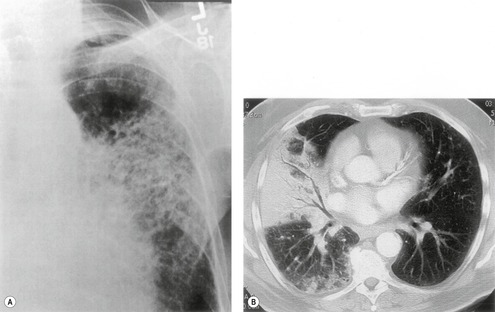
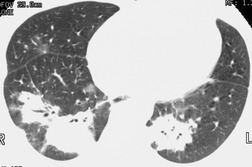
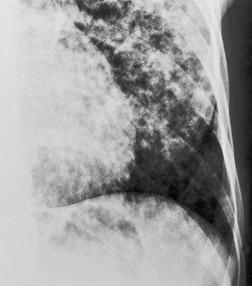
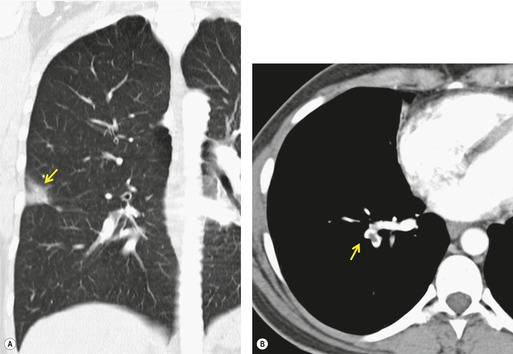
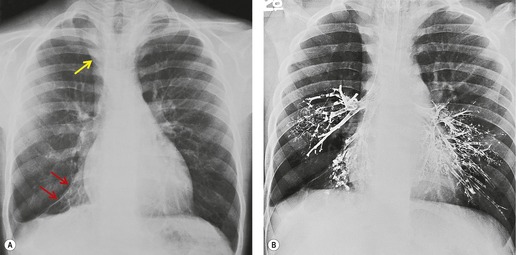
• Interstitial fibrosis, notably advanced usual interstitial pneumonia and radiation fibrosis, may be so intense that in addition to causing dilatation of the bronchi, which remain patent, the lung parenchyma is almost airless, producing an air bronchogram (Fig. 3.11).9. and 10. Air bronchograms may also be seen in areas of dense involvement of the lung by sarcoidosis (Fig. 3.12).
• Air bronchograms can occasionally be seen in postobstructive pneumonia, particularly on CT, even though replacement of air by secretions beyond the obstruction might have been expected.
• Air bronchograms can be normal on chest radiography at low lung volumes and in the segmental bronchi behind the heart in children.
PULMONARY OPACITY
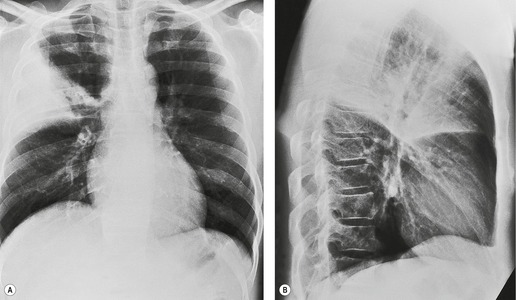
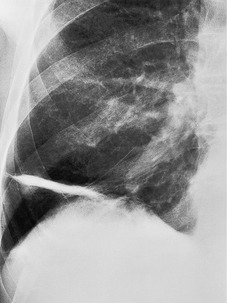
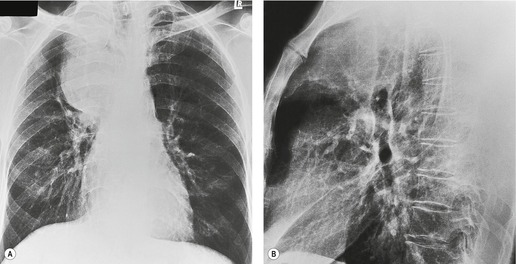
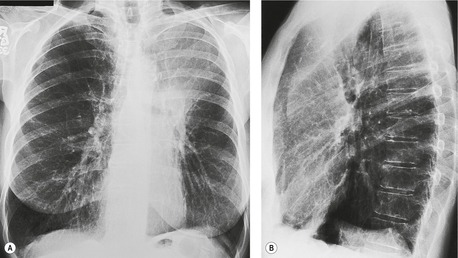
Pulmonary opacity is defined as an ‘area that preferentially attenuates the x-ray beam and therefore appears more opaque than the surrounding area’. 3 A pulmonary opacity is readily detected in the frontal radiograph by comparing one lung with the other. In the lateral view such right-to-left comparisons are not possible and therefore alternative signs are needed. In the normal lateral view, each thoracic vertebral body appears more translucent than the one above it, as the eye travels down the spine, until the diaphragm is reached. Pulmonary opacities projected over the spine alter this graduation (Fig. 3.13). Moreover, in a healthy individual, there is no abrupt change in density across the heart in the lateral view (Fig. 3.14). Less reliably, the high retrosternal area is usually more translucent than all other areas on the lateral chest radiograph, except the region immediately behind the heart.
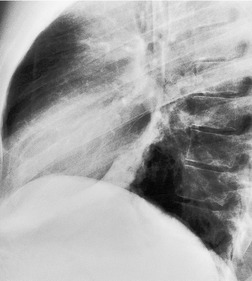 |
| Fig. 3.14 (The posteroanterior view of this patient is shown in Fig. 3.2.) |
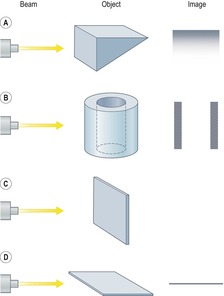
As parenchymal opacities can be subtle, a systematic approach should be adopted when analyzing a chest radiograph. The apices, the hila, the retrocardiac regions, the lung below the domes of the diaphragm, and the area just inside the chest wall should be examined with particular care, because experience shows that opacities in these areas are easily overlooked. The characteristics of a parenchymal opacity depend on the absorptive capacity and geometry of the object. In order of increasing absorptive capacity, the major components of the chest are air, fat, fluid and soft tissues, and bone. For practical purposes, fluid and soft tissues, apart from fat, are isodense on chest radiographs. The following geometric features are worth noting (Fig. 3.15): 11
• Interfaces tangential to the X-ray beam are sharp and distinct, whereas oblique interfaces are not seen because they fade off and cannot be identified (Fig. 3.15A).
• Hollow cylinders and hollow spheres are most absorptive at their edges because at the edge the beam has a longer path within the object and is therefore more attenuated. Also, the outside and inside marginal interfaces are sharp and distinct (Fig. 3.15B).
• A thin sheet perpendicular to an X-ray beam usually causes no detectable opacity (Fig. 3.15C), whereas a thin sheet oriented in the direction of the beam can cause an opacity (Fig. 3.15D).
 |
| Fig. 3.15 (With permission from Wilson AG. The interpretation of shadows on the adult chest radiograph. Br J Hosp Med 1987;37:526–534.) |
There are innumerable patterns of pulmonary opacities, with no clear-cut divisions between them. Nevertheless, categorizing these patterns is worthwhile; the more certain the observer is of the description of an individual opacity, the shorter the differential diagnostic list will be. The diagnostic considerations for a particular pattern may be further reduced by reviewing serial images. The following classification of pulmonary opacities is used in this chapter:
• Airspace opacities
• Atelectasis (collapse)
• Nodules and masses
• Linear and bandlike opacities
• Cysts and bullae
• Nodular and reticulonodular opacities, and honeycombing.
More than one pattern may be present on the same imaging study. Calcifications and cavitations should be looked for; their presence will limit the number of diagnostic possibilities.
AIRSPACE OPACITIES
This term designates the ‘filling of airspaces with the products of disease’. 3 Airspace opacities can be heterogeneous in appearance, and do not necessarily obscure vascular or bronchial margins. On the other hand, the term ‘consolidation’, widely used by pathologists, refers to the products of disease ‘that replace alveolar air, rendering the lung solid’. 3 Consolidation causes a relatively homogeneous increase in lung attenuation that obscures the margins of vessels and airways.
Many sublobar processes are vaguely conical, and sometimes resemble the shape of a segment. Precise conformity to a segment almost never occurs because, with the rare exception of accessory fissures, there are no anatomic barriers to prevent the spread of pathologic processes across segmental boundaries. Airspace opacities are often peripheral in location, crossing segmental boundaries with impunity. Spherical consolidations are comparatively less common.
Ill-defined nodular opacities between 0.5 cm and 1 cm are sometimes seen within or adjacent to the larger opacities of airspace opacities, particularly with pulmonary edema and lung infections, notably varicella or tuberculosis (Fig. 3.16; see also Fig. 3.19). These opacities have been called ‘acinar shadows’, since they are believed to be opaque acini contrasted against aerated lung. 12 They may coalesce as disease progresses. The converse of the acinar opacity is the air alveologram (Fig. 3.17), a pattern of small rounded lucencies seen when aerated acini are surrounded by opaque lung. Cavitation may occur within airspace opacities and consolidations. A cavity is defined as a ‘gas-filled space, seen as a lucency or low-attenuation area’. 3 The cavity is usually the result of the expulsion or drainage of a necrotic part of the lesion via the bronchial tree. Although air–fluid levels may be seen in cavitations, the term is not synonymous with abscess3 (Fig. 3.18).
The term ‘ground glass’ has a slightly different meaning depending on whether it is being applied to chest radiographs or to CT images, notably HRCT. When applied to chest radiographs it refers to an ‘area of hazy increased lung opacity, usually extensive, within which margins of pulmonary vessels may be indistinct’. 3 Ground-glass opacity on HRCT refers to an increase in attenuation of the lung parenchyma without obscuration of the underlying bronchovascular structures. The pathogenesis of ground-glass opacities is complex and partial filling of the airspaces is only one of several mechanisms; this pattern is discussed more fully in Chapter 4.
Given its excellent contrast discrimination, CT, and particularly HRCT, may provide additional information about airspace opacities (Fig. 3.19). CT allows airspace opacities to be seen when chest radiographs still have a normal appearance. 13 It can also demonstrate the size, shape, and precise position of any cavities (Fig. 3.20). 14 Other morphological features of airspace opacities that are particularly well demonstrated by CT are air bronchograms (see Figs 3.9 and 3.10), the satellite lesions of infectious inflammation, including a tree-in-bud pattern, and the conformity of radiation fibrosis to the radiation port (Fig. 3.21).
 |
| Fig. 3.19 |
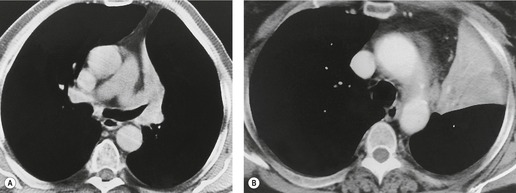
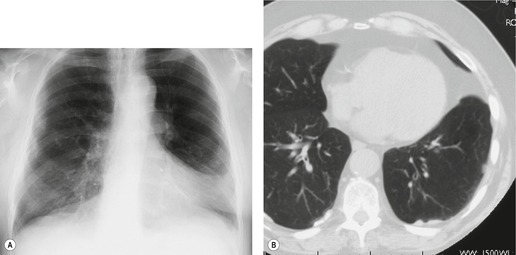
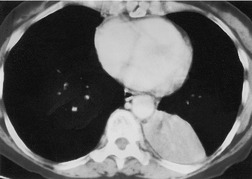
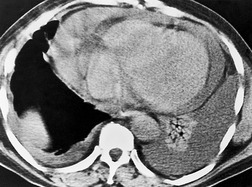
The term ‘CT angiogram sign’15 refers to the presence of visible contrast-enhanced blood vessels coursing through areas of consolidation (Fig. 3.22). 16 The sign was originally described as reasonably specific for bronchioloalveolar cell carcinoma, 16 but with the more rapid rate of contrast medium injection that has become common in the past decade it is apparent that the CT angiogram sign is seen in a variety of other causes of consolidation, notably pneumonia, obstructive pneumonitis, pulmonary edema, and lymphoma.16.17.18.19. and 20. The CT angiogram sign, however, is useful in the differential diagnosis of atelectatic lung resembling pleural effusion: its presence definitively indicates pulmonary pathology, since the sign cannot occur within a pleural abnormality. 21
 |
| Fig. 3.22 (With permission from Vincent JM, Ng YY, Norton AJ, et al. CT ‘angiogram sign’ in primary pulmonary lymphoma. J Comput Assist Tomogr 1992;16:829–831.) |
Differential diagnosis of airspace opacities
Solitary airspace opacities (Fig. 3.23) are usually the result of pneumonia, atelectasis, infarction (Fig. 3.24), or hemorrhage (Fig. 3.25). Neoplasms, particularly bronchioloalveolar cell carcinoma (see Figs 3.10, 3.26 and 3.89) and lymphoma (Fig. 3.27), may also appear ill-defined enough to be called focal consolidations. The full list of causes for solitary airspace opacities is given in Table 3.1.
| Diagnosis | Comments |
|---|---|
| Pneumonia | Pneumonia is the most common cause of solitary airspace filling. The opacity may be almost any shape from segmental/lobar to round or irregular. Cavitation and accompanying pleural effusion are both distinct features. In adults an associated hilar mass suggests a centrally located neoplasm causing postobstructive pneumonia, whereas in children an associated hilar mass suggests primary tuberculosis |
| Organizing pneumonia | Can be responsible for a variety of radiographic patterns, including a focal or segmental-shaped area of consolidation |
| Atelectasis | The diagnosis of atelectasis is based on its characteristic shape. The appearances and causes are discussed in the section ‘Atelectasis/Collapse’ later in this chapter. Discoid atelectasis results in a characteristic bandlike shape coursing through the lung, often in a horizontal orientation. Large areas of atelectasis that do not conform to either of these patterns may be indistinguishable from the other causes of airspace shadowing listed in this table |
| Infarction or hemorrhage associated with pulmonary embolism | Infarcts are usually segmental in size, rarely larger. Their shape is similar to a truncated cone with the base on the pleura. The apex of the cone, which may be rounded, points towards the hilum. The rounded medial margin, known as Hampton hump (see Chapter 7), is a well known but infrequent sign suggestive, but not diagnostic, of the condition. Septic infarcts cavitate frequently, whereas bland infarcts rarely cavitate |
| Pulmonary contusion | Contusions appear within hours of injury and clear within a few days. They are usually maximal in the general area of injury, although contrecoup damage may be seen at a distance. Pneumatocele formation is a distinct feature. Pulmonary contusion may surround a pulmonary hematoma. Hematomas resemble masses, may liquefy and cavitate, and take much longer to clear than contusions |
| Connective tissue disease, vasculitis | These conditions are infrequent causes of solitary airspace shadowing. They need to be considered in patients with appropriate clinical features. The opacity is usually sublobar in size and nonspecific in shape. Cavitation may be seen. Most solitary shadows in patients with connective tissue disease or vasculitis represent pneumonia, organizing pneumonia or infarction |
| Drug reactions and allergic reactions | Airspace opacities in these conditions are rarely solitary. They may be almost any shape except lobar |
| Hemorrhage | Solitary airspace opacities caused by hemorrhage are usually due to pulmonary emboli or to pulmonary trauma. When caused by systemic disease, pulmonary hemorrhage is usually multifocal. When single, the opacity can be any shape, even including lobar |
| Neoplasm | Postobstructive pneumonia is a common cause of solitary airspace opacities. Some neoplasms, particularly bronchioloalveolar cell carcinoma and lymphoma, can closely resemble focal pneumonia and may even contain air bronchograms. The absence of clinical features of pneumonia and the lack of change of the shadow over many weeks point to one of these neoplasms. The longer the opacity persists, particularly if it grows slowly, the more likely it is to be a neoplasm |
| Radiation pneumonitis/fibrosis | Airspace opacities caused by radiation therapy conforms, usually but not invariably, to the approximate shape of the radiation port, a feature that is particularly evident on CT. The shape and the fact that radiation therapy was given usually permit a specific diagnosis to be made |
| Eosinophilic pneumonia | Airspace opacities in this condition are almost invariably multifocal; they are very rarely solitary. The opacities are likely to be noticeably peripheral in location |
Airspace filling is often multifocal and tends to coalesce as it progresses (Fig. 3.28). The list of causes is given in Box 3.2 and Box 3.3.
Box 3.2
Exudates and transudates
• Pneumonia
• Organizing pneumonia
• Pulmonary emboli causing infarction (bland or septic)
• Eosinophilic pneumonia
• Connective tissue disease and vasculitis
• Pulmonary edema, both circulatory and noncirculatory (acute respiratory distress syndrome)
• Inhalation of noxious gases or liquids
• Hydrocarbon ingestion
• Drug reactions
• Allergic reactions
• Alveolar proteinosis
Hemorrhage
• Pulmonary contusion and hematoma
• Hemorrhage due to pulmonary embolus
• Aspiration of blood
• Idiopathic hemorrhage, Goodpasture syndrome, bleeding tendency
Neoplasm
• Bronchioloalveolar cell carcinoma
• Lymphangitis carcinomatosa
• Metastases
• Lymphoma
Miscellaneous
• Sarcoidosis
• Silicosis, coal worker’s pneumoconiosis
• Alveolar microlithiasis
• Diffuse pulmonary calcification
Box 3.3
Common pattern for disease
• Pulmonary edema, both circulatory and noncirculatory (acute respiratory distress syndrome)
• Pneumonia, notably pneumonia caused by aspiration or Pneumocystis jirovecii
• Inhalation of noxious gases or liquids
• Alveolar proteinosis
• Pulmonary hemorrhage
– Spontaneous
– Goodpasture syndrome
– Bleeding tendency
Occasional or rare pattern for disease
• Aspiration of blood
• Bronchioloalveolar cell carcinoma
• Lymphangitis carcinomatosa
• Alveolar microlithiasis
• Diffuse pulmonary calcification
• Lymphoma
• Pulmonary emboli causing hemorrhage or infarction (bland or septic)
• Connective tissue disease/vasculitis
• Drug reactions
• Allergic reactions
• Amyloidosis
Extremely rare pattern for disease
• Eosinophilic pneumonia
• Metastases
• Sarcoidosis
• Silicosis, coal worker’s pneumoconiosis
The following considerations may be helpful when analyzing airspace opacities:
• Clinical correlation is essential and is often decisive. A few examples confirm this point: (a) in patients with noncardiogenic pulmonary edema, the chest radiograph may not become abnormal until several hours after the onset of symptoms, whereas with cardiogenic pulmonary edema the pulmonary opacities are almost always evident early on; (b) widespread pneumonia is almost invariably accompanied by cough and fever; (c) aspiration should be suspected as the cause of airspace opacities in patients who have known predisposing factors such as alcoholism, a recent seizure, or a period of unconsciousness; (d) widespread pulmonary opacities in immunocompromised patients usually indicate infection, often from opportunistic organisms; and (e) substantial hemoptysis associated with widespread pulmonary consolidations often indicate pulmonary hemorrhage.
• Opacities of over half a lobe with no loss of volume are virtually diagnostic of pneumonia (Fig. 3.29). The common causes in patients living in the community are pneumococcal or Mycoplasma pneumonia and pneumonia distal to a bronchial neoplasm. Neoplastic obstruction of a lobar bronchus usually causes some degree of atelectasis, but consolidation without loss of volume due to an obstructing neoplasm is not uncommon. Bronchioloalveolar cell carcinoma and lymphoma may on occasion appear identical to lobar pneumonia. The lobar consolidation in these cases is due to neoplastic tissue spreading through the alveolar spaces without necessarily occluding the central bronchi.
• Spherical consolidation is likely to be due to pneumonia (Fig. 3.30). The organisms most likely to cause round, spherical, or nodular pneumonia are S. pneumoniae, S. aureus, K. pneumoniae, P. aeruginosa, Legionella pneumophila or Legionella micdadei, Mycobacterium tuberculosis, and a variety of fungi. Clearly the major differential diagnosis is that of pulmonary neoplasm. Ground-glass opacities surrounding rounded consolidation on CT are highly suggestive of hemorrhage; the causes of this so-called ‘CT halo sign’ (see Fig. 3.91) are discussed on p. 131.
• Lucencies within consolidated lung may be due to: (a) intervening normal lung, either because those particular portions of lung, often secondary pulmonary lobules, were never involved or because they have cleared prior to the remainder of the pneumonia; (b) preexisting centrilobular emphysema; (c) necrosis of tissue with cavitation; or (d) pneumatoceles. 22 The development of air–fluid levels within an area of consolidation that is known or presumed to be pneumonia strongly suggests necrotizing pneumonia. Bacteria are the likely pathogens, notably S. aureus, Gram-negative bacteria (notably K. pneumoniae, Proteus and P. aeruginosa), anaerobic bacteria, and tuberculosis. Those few cases of segmental or lobar consolidation with cavitation not caused by infection may be the consequence of a vasculitis or, rarely, lymphoma. A meniscus of air within an area of segmental or lobar consolidation almost always represents resolving invasive fungal infection.
• The presence of rib or vertebral body destruction in the vicinity of a pulmonary opacity or consolidation, whatever the shape of the alteration, is virtually diagnostic of invasion by primary carcinoma of the lung. With the rare exception of actinomycosis23 and the occasional case of pulmonary tuberculosis24 or fungal disease, neither pulmonary infections nor other non-neoplastic pulmonary processes invade the adjacent bones.
• Multiple airspace opacities that are clearly lobar or segmental in shape constitute another potentially useful diagnostic subgroup (Fig. 3.31; Box 3.4).
 |
| Fig. 3.31 |
Box 3.4
• Pneumonia
• Infarction or hemorrhage caused by pulmonary emboli
• Neoplasm (bronchioloalveolar cell carcinoma, lymphangitis carcinomatosa, * malignant lymphoma)
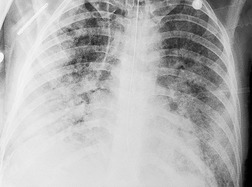
• It is useful to separate those cases of multifocal airspace opacities that show the so-called bat wing or butterfly pattern, because the presence of this pattern makes certain diagnoses more or less likely. The fanciful descriptors for this pattern are an attempt to describe bilateral perihilar opacities. The opacities consist of coalescent densities with ill-defined borders, sometimes with acinar components at their periphery. The outer portion of each lobe is less involved than the perihilar area and is often normal (Fig. 3.32). Bat wing opacities may be symmetric, but are often more severe on one side than the other. Air bronchograms may be visible. By far the most common cause is pulmonary edema (Fig. 3.32), particularly if air bronchograms or acinar opacities are present. Cases of bat wing opacities not caused by pulmonary edema are likely to be due to pneumonia, inhalation of noxious gases or liquids (including aspiration of gastric contents), multifocal pulmonary hemorrhage (Fig. 3.33), vasculitis, or neoplasm, particularly lymphangitis carcinomatosa. Multifocal pneumonia can be due to a vast array of organisms, but the bat wing pattern in the immunocompetent patient should suggest particularly aspiration pneumonia, Gram-negative bacterial pneumonia, and nonbacterial pneumonias such as mycoplasmal, viral, and rickettsial pneumonia. Pneumonia in the immunocompromised host often results in the bat wing pattern, most notably in infections with opportunistic organisms such as P. jirovecii and various fungi. The coexistence of thickened interlobular septa (Kerley A and B lines) visible on chest radiographs, for practical purposes, limits the diagnostic possibilities to pulmonary edema and lymphangitis carcinomatosa. Bat wing opacities that remain unchanged over several weeks and are associated with nonspecific chronic symptoms suggest alveolar proteinosis (Fig. 3.34) or a neoplasm, notably lymphangitis carcinomatosa (Fig. 3.35), bronchioloalveolar cell carcinoma, or malignant lymphoma. Sarcoidosis and Wegener granulomatosis are rare possibilities for such opacities.
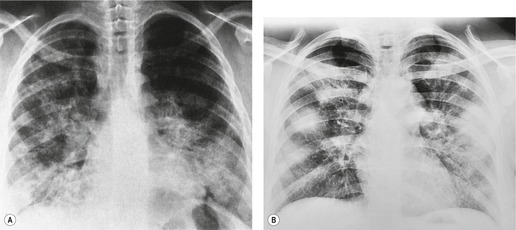
• Nonsegmental airspace opacities that are widespread, yet clearly peripheral in location (sometimes called ‘the photographic negative of pulmonary edema’), strongly suggest chronic eosinophilic pneumonia when the upper zone is predominant (Fig. 3.36). 25 The peripheral distribution may be more readily apparent on CT than on the chest radiograph. 26 When there is no upper zone predominance the differential diagnosis widens to include drug reactions and organizing pneumonia (Fig. 3.37).
• Many of the causes of multiple airspace opacities appear rapidly, but pulmonary edema and hemorrhage are the only ones that clear within hours.
• Airspace opacities that resolve only to reappear either in the same area or in some other part of either lung suggest: pulmonary edema; eosinophilic pneumonia, either acute or chronic; or asthma, particularly when associated with bronchopulmonary aspergillosis.
• Subtle punctate calcification may cause focal or multifocal areas of pulmonary opacity, closely resembling consolidation on chest radiographs (Fig. 3.38). This phenomenon occurs in patients with hypercalcemia caused by conditions such as hyperparathyroidism, particularly secondary hyperparathyroidism resulting from renal failure, and in children who have had cardiac surgery or liver transplants.27.28.29.30. and 31. The calcifications may be so minute that it is not possible to appreciate on chest radiographs that the cloudlike opacities are in fact due to a myriad of calcifications. The appearance may then be confused with the other causes of multiple airspace opacities. CT allows the observation of widespread parenchymal calcification to be made with greater confidence.
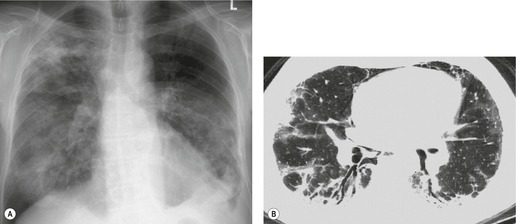
• Acute respiratory distress syndrome (ARDS) is the most likely diagnosis for uniform opacity of the whole of both lungs without pleural effusion in the immunocompetent patient (Fig. 3.39). Air bronchograms are a noteworthy feature in these patients.
• Sarcoidosis occasionally causes patchy opacities in the lungs that tend to be spherical, contain air bronchograms, and are associated with obvious hilar and mediastinal lymph node enlargement. Sometimes these opacities dominate the picture and, when irregular in shape, are indistinguishable on imaging from multifocal pneumonia (Fig. 3.40).
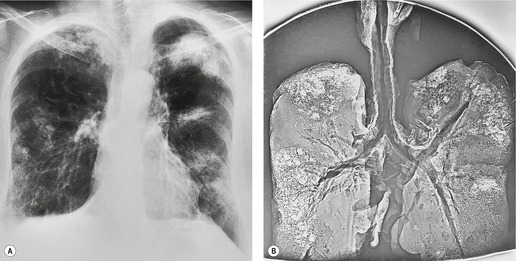
• Progressive massive fibrosis may, rarely, resemble airspace opacities (Fig. 3.41). The changes are, however, characteristic in shape and position, do not contain air bronchograms, and often cause volume loss of the lungs.
ATELECTASIS/COLLAPSE
The terms ‘atelectasis’ and ‘collapse’ are often used synonymously, although the term ‘collapse’ is sometimes restricted to mean total atelectasis. 3
Mechanisms of atelectasis
There are several mechanisms for atelectasis, the most frequent being bronchial obstruction.32. and 33. Bronchial obstruction in adults is usually the result of a bronchial neoplasm or mucus plug. On occasion, it is due to an inhaled foreign body, inflammatory or posttraumatic bronchostenosis, a broncholith, or extrinsic compression by, for example, enlarged lymph nodes, aortic aneurysm, or left atrial enlargement. Because bronchial tumors are uncommon in children, the probable causes of childhood obstructive atelectasis differ substantially from those in adults. In young children the airways are smaller and more vulnerable to obstruction by inflammatory exudate and mucus in pneumonia or mucus plug obstruction in conditions such as asthma or cystic fibrosis. The other likely cause of lobar atelectasis in children is an inhaled foreign body. Rare causes include inflammatory or posttraumatic bronchostenosis, compression of the bronchial tree by anomalous vessels and, very rarely, neoplastic obstruction.
Any process which occupies space within the thorax either compresses the lung (compressive atelectasis) or allows it to retract (passive atelectasis). With large pleural effusions the lobes surrounded by fluid may show substantial atelectasis. Large intrathoracic masses frequently press on the lung and may therefore acquire an ill-defined margin because of adjacent atelectatic lung. Similarly, emphysematous bullae are often surrounded by atelectatic lung. The best example of passive atelectasis, due to normal elastic recoil, is pneumothorax, which allows retraction of the lung.
Following infection a lobe may lose volume because of destruction, often accompanied by bronchiectasis, and fibrosis. The most common cause in the upper lobes and superior segment of the lower lobes is previous granulomatous infection. If the disease affects the dependent portions of the lung, the patient may have the clinical features of bronchiectasis. The middle lobe syndrome is a particular example of this phenomenon. The following features, all of which are best seen at CT, may be inferred from chest radiographs: no endobronchial mass; dilated, thick-walled bronchi within the atelectatic lobe; and associated extensive pleural thickening.34.35.36. and 37. The loss of volume can be very severe and may be greater than is generally observed in lobar collapse caused by endobronchial obstruction. Widespread pulmonary fibrosis causes generalized loss of lung volume. Reticulonodular opacities are then the dominant radiographic feature.
Discoid atelectasis (also known as ‘platelike’ or ‘linear’ atelectasis) is a form of adhesive atelectasis. 3 First described by Fleischner, 38 and formerly known as Fleischner lines, the atelectasis is disk or plate shaped (Fig. 3.42). Sometimes the disk is so large that it crosses the whole lobe. Discoid atelectasis may be single or multiple. It usually abuts the pleura and is perpendicular to the pleural surface39 with no predisposition to point toward the hilum. The orientation may be in any plane from horizontal to vertical. The thickness ranges from a few millimeters to a centimeter or more, and the lesions are therefore usually seen as line or bandlike opacities.
Westcott and Cole39 reviewed the mechanisms that lead to discoid atelectasis. In summary, discoid atelectasis is due to hypoventilation, which leads to alveolar collapse. Alveoli lying at the lung bases and those lying posteriorly are most likely to collapse, not only because they have the lowest volume but also because the physiologic mechanisms responsible for keeping the small airways and alveoli open are at their most vulnerable in these sites. In addition, discoid atelectasis may be seen in the lingula in patients with substantial collapse of the left lower lobe, possibly because of kinking of bronchi in the hyperexpanded lingula.40. and 41.
Discoid atelectasis is common, particularly in hospitalized patients. Since it reflects hypoventilation, it is seen in a large variety of conditions. 42 Of itself, it is usually of little clinical importance, although the causative condition may be important. Occasionally, discoid atelectasis is of such magnitude and so widespread that it causes hypoxemia. Radiographs may substantially underestimate the extent of the condition. Following general anesthesia, for example, widespread atelectasis can be clinically significant, even in cases that show few signs on chest radiographs.
Imaging lobar atelectasis
Chest radiography is usually sufficient to diagnose the presence of lobar atelectasis. CT can be useful when conventional film findings are ambiguous; 42 for example, when pleural fluid and pulmonary disease processes are both present.
The fundamental signs of lobar atelectasis on both radiographs32.43.44. and 45. and CT44.45. and 46. are the opacity of a given lobe and evidence of loss of volume. They can be divided into: direct signs, such as displacement of fissures, pulmonary blood vessels, and major bronchi; and shift of other structures to compensate for the loss of volume (Fig. 3.43). The compensatory shifts are in principle similar for each lobe, and they are therefore discussed before describing the appearance of atelectasis of individual lobes.
Compensatory overexpansion of the adjacent lobe may result in recognizable spreading of the vessels so there are fewer vessels per unit volume. This sign should not be relied upon if it is an isolated finding, since previous lung damage, from infection for example, can lead to a similar appearance.
The amount of mediastinal shift accompanying lobar atelectasis is variable. In general, it is greatest with lower lobe atelectasis or chronic fibrotic loss of volume of an upper lobe, relatively mild with acute upper lobe atelectasis, and virtually nonexistent with atelectasis of the middle lobe. Its recognition depends on noting displacement of the trachea and mediastinum. Normally, on a correctly centered frontal view, the trachea lies midway, or slightly to the right of the midpoint, between the medial ends of the clavicles. Minor obliquity of the chest radiograph does not make much difference because the trachea is only just behind the plane of the medial ends of the clavicles. The normal position of the mediastinum varies so greatly that displacement of the mediastinal contour is an insensitive sign of loss of volume. Normally one-fifth to one-half of the cardiac shadow lies to the right of the midline. More than one-half or less than one-fifth suggests mediastinal shift.
Hemidiaphragm elevation is another manifestation of compensatory shift. Loss of volume of either lower lobe or of the left upper lobe may lead to obvious elevation of the ipsilateral hemidiaphragm. It is usually unrecognizable in right middle lobe collapse and may be subtle in right upper lobe atelectasis. The sign is, however, of limited value because the position of the normal diaphragm is highly variable, particularly in a hospital population. Diaphragm position depends on many factors, including the amount of gas in the stomach, and can vary from day to day. Therefore great care must be taken before relying on elevation of a hemidiaphragm to support the diagnosis of lobar atelectasis.
Inward movement of the chest wall causes narrowing of the spaces between the affected ribs. This sign, which is seen only with a severely collapsed lobe, can be difficult to evaluate on chest radiographs. It is easier to recognize on transverse CT sections where the cross-sectional area of each hemithorax can be readily compared. Clearly, confusion with preexisting chest wall deformity, particularly when caused by scoliosis, may cloud the issue.
Obliteration or narrowing of the bronchial air column at the site of any obstruction is often visible, even on radiographs. Opaque foreign bodies or calcified broncholiths may be directly visible. Even though CT demonstrates the size and site of the responsible obstructing lesion in virtually all patients with a lobar collapse47.48.49. and 50. (Figs 3.44 and 3.45), bronchoscopy is indicated to diagnose the nature of the obstruction and where possible, as with foreign body inhalation, mucus plug obstruction and broncholith, to treat the cause.
When the peripheral lung collapses and the central portion is prevented from collapsing by the presence of a mass, the relevant fissures are concave peripherally but convex centrally; the shape of the fissure then resembles an S or a reverse S – hence the name Golden S sign, after Golden’s description of cases of lobar collapse caused by carcinoma of the lung. 51 This sign is recognizable both on chest radiography and at CT (Fig. 3.46).42.52. and 53. On occasion, the fact that there is lobar atelectasis may be overlooked and the patient misdiagnosed as having a mediastinal or hilar mass (see Fig. 3.49). Similarly, massively dilated bronchi due to tuberculosis may deform the central portion of the atelectatic lobe leading to a misdiagnosis of a pulmonary, hilar, or mediastinal mass.53. and 54.
Bronchial dilatation and air bronchograms within atelectatic lobes
Mucus-filled, dilated bronchi are frequently present beyond an obstructing lesion responsible for lobar atelectasis. They cannot be recognized on radiographs, although they are readily identified on CT as low-density branching structures (Figs 3.45B and 3.47).42.55. and 56. The low density is due to trapped secretions. Finding a so-called mucoid or fluid bronchogram should prompt a search for a central obstructing lesion. Air bronchograms within atelectatic lobes are very rarely identified on chest radiographs, but may be seen on CT even when the loss of volume is due to central bronchial obstruction, possibly because of collateral air drift or necrosis of the obstructing tumor.33. and 50.
In one series, 57 the magnetic resonance (MR) signal intensity on proton density and T2-weighted images was high in atelectasis due to central obstruction but was low in nonobstructive atelectasis. The authors postulated that the high T2 signal was related to trapped secretions, which were present only when the atelectasis was due to obstruction.
Right upper lobe atelectasis
In right upper lobe atelectasis (Figs 3.46 and 3.48), the major and minor fissures move upward toward each other rather like a half-closed book, the spine of which is represented by the hilum. At the same time these fissures rotate towards the mediastinum, with the result that the right upper lobe packs against the mediastinum and lung apex. The more the loss of volume, the greater is the concavity of the minor fissure. Eventually, with extreme collapse, the minor fissure parallels the mediastinum and thoracic apex and resembles pleural thickening or mediastinal widening. The lobe is attached to the hilum by a conical wedge of collapsed lung, and therefore the curving inferior margin of the lobe always connects to the hilum. The intrinsic bulk of the central vessels and bronchi means there is a limit to the loss of volume possible at the hilum; hence a slight outward bulge is discernible at the hilum in examples of extreme collapse even when no hilar mass is present. Because the atelectatic right upper lobe has extensive contact with the mediastinum, the normal superior vena caval border is ‘silhouetted’ out on the frontal chest radiograph, as is the ascending aorta on the lateral view.
The middle and lower lobes expand to occupy the vacated space, leading to outward and upward displacement of the right lower lobe artery. This displacement is most readily seen on frontal radiographs. The corresponding upward angulation of the right main stem and lower lobe bronchi is more difficult to recognize. Overexpansion of the opposite upper lobe is usually minor; for practical purposes it is visible only at CT.
On the lateral view, the upward displacement of the major and minor fissures is usually well seen. With severe loss of volume the wedge of collapsed lung radiating out from the hilum may be no more than an indistinct density on lateral views, since neither of the fissures are tangential to the X-ray beam. The elevation of the right pulmonary artery and the anterior displacement of the right bronchial tree can be identified on the lateral projection, 58 but only with great difficulty. Occasionally, collapse of the right upper lobe around a large obstructing bronchial tumor mimics a mediastinal mass (Fig. 3.49). An error in interpretation can be avoided by carefully analyzing the film for compensatory shift of other intrathoracic structures.
On rare occasions, the normal chest wall contact is maintained even in severe collapse. 59 This appearance (Fig. 3.50) is most frequently reported in neonates and young children, 60 but is also seen in adults. It has been termed peripheral atelectasis33.60. and 61. because the atelectatic lobe lies against the lateral chest wall and the overexpanded lower lobe lies centrally. 62 The appearance may mimic loculated pleural effusion. 61 A juxtaphrenic peak may be visible. 63 This term refers to a small triangular shadow based on the apex of the dome of the hemidiaphragm with loss of silhouette of the adjacent hemidiaphragm (Fig. 3.48), usually caused by traction on an inferior accessory fissure,64.65. and 66. or, on occasions, due to traction on the intrapulmonary septum associated with the inferior pulmonary ligament. 65 The sign may also be seen after lobar resection. 67
At CT,34.45.46.48. and 68. an atelectatic right upper lobe appears as a triangular soft tissue density lying against the mediastinum and the anterior chest wall. The border formed by the major and minor fissure is sharp (Fig. 3.51). In the absence of large intrapulmonary masses, each fissural boundary should be uniformly concave or convex, not a combination of the two. A severely collapsed right upper lobe assumes a bandlike configuration plastered against the mediastinum, an appearance that can be confused with mediastinal disease. Sometimes the hyperexpanded superior segment of the lower lobe insinuates itself between the mediastinum and the medial border of the atelectatic lobe. Elevation of the right upper lobe bronchus may cause the bronchus intermedius to move laterally, and the right middle lobe bronchus may be displaced anteriorly and reoriented in a more horizontal position.
Left upper lobe atelectasis
Because there is no minor fissure on the left, the appearance of atelectasis of the left upper lobe is significantly different from atelectasis of the right upper lobe (Fig. 3.52). The lobe moves predominantly forward, pulling the expanded left lower lobe behind it. Except at the edges, the lobe retains much of its original contact with the anterior chest wall and mediastinum.
 |
| Fig. 3.52 |
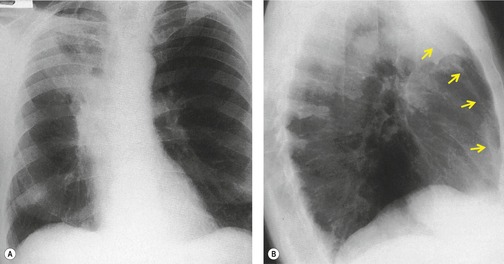
Since the lobe thins as the fissure is pulled forward, the usual appearance on a frontal radiograph is a hazy density extending out from the left hilum, often reaching the lung apex, and fading laterally and inferiorly. The loss of the left cardiac and mediastinal silhouette is a striking feature on the frontal view. With mild loss of volume – provided the lobe is opaque – the entire cardiac and upper mediastinal border, together with the diaphragm outline adjacent to the cardiac apex, becomes invisible. With increasing loss of volume the upper margin of the aortic knob once again becomes visible because the superior segment of the lower lobe takes the place of the posterior segment of the upper lobe – a sign that has been called the ‘luftsichel’ sign.69.70. and 71. With further loss of volume the upper border of the pulmonary opacity becomes hazy and its medial border becomes sharp because the apex is now occupied by the greatly overexpanded superior segment of lower lobe (Fig. 3.53). The superior mediastinal and left hemidiaphragm contours then reappear, but with very few exceptions the left border of the heart remains indistinct even in the most severe cases of left upper lobe atelectasis. The overexpansion of the left lower lobe results in elevation of the left hilum and outward angulation of the left lower lobe artery. The left bronchial tree assumes an S-shaped configuration, the left main bronchus running a near horizontal course and the lower lobe bronchus being more vertical than usual (Fig. 3.54).
On the lateral view the lateral portion of the major fissure is usually seen as a clearly defined concave margin running approximately parallel to the anterior chest wall. The wedge of tissue radiating from the hilum is indistinct on the lateral view unless there is a hilar mass to alter the tangents. The lingula segment, being thinner to start with, often is no more than a sliver. The entire fissure may be so far forward that a collapsed upper lobe can be overlooked or misinterpreted as an anterior mediastinal density. Sometimes the fissure rotates, so that no part of it is tangential to the X-ray beam and, in these cases, the edge of the shadow is ill-defined in the lateral view also.
A striking feature of left upper lobe atelectasis is herniation of the opposite lung into the left hemithorax in front of the aorta (see Figs 3.44 and 3.45), which leads to increased visibility of the ascending aorta on the lateral chest radiograph (see Fig. 3.53), an appearance that should not be misinterpreted as the anterior edge of the collapsed lobe. In rare instances the edge of the herniated lung can project over the aortic knob on a frontal view. The more usual cause of aerated lung lying medial to the opacity of an atelectatic left upper lobe is overexpansion of the left lower lobe invaginating between the atelectatic lung and the mediastinum (see Fig. 3.53). A juxtaphrenic peak on the hemidiaphragm (Fig. 3.55) and the phenomenon of ‘peripheral’ atelectasis may be seen on the left just as they may with atelectasis of the right upper lobe.
On CT (Figs 3.44, 3.45 and 3.56)34.45.46.48. and 68. atelectatic left and right upper lobes appear similar, but with left upper lobe atelectasis the airless lingular segments are identified on sections below the carina as a narrow triangular density based on the heart and anterior chest wall extending almost to the diaphragm. The herniation of the right lung anterior to the aorta is particularly well seen on CT.
Right middle lobe atelectasis
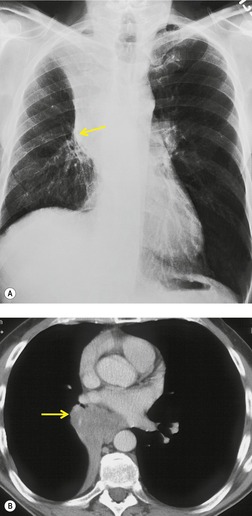
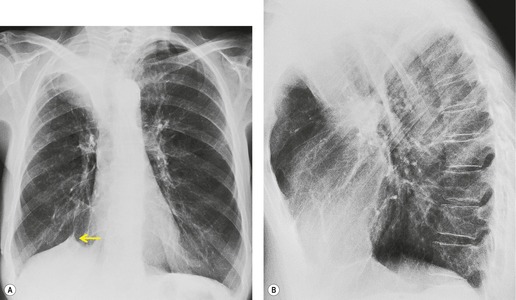
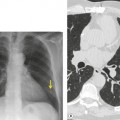
The opacity of an atelectatic middle lobe on the frontal chest radiograph may, in severe cases, be so minimal that middle lobe atelectasis is easy to overlook, because its depth in the plane of the beam may be no more than a few millimeters (Fig. 3.57), but loss of silhouette of the right border of the heart is almost always a key feature. The bronchial and vascular realignments in right middle lobe atelectasis are so slight that there is no recognizable alteration in the appearance of the right hilum. The atelectatic lobe is, however, easily and reliably recognized on the lateral chest radiograph. The major and minor fissures approximate one another and, if the atelectasis is pronounced, the lobe resembles a curved, elongated wedge. The wedge tapers in two directions: medial to lateral, and anterior to posterior. The collapsed lobe may be so thin that it may be misinterpreted as a thickened fissure. Alternatively, there may occasionally be difficulty in distinguishing between atelectasis of the middle lobe and loculated fluid in the major fissure. With atelectasis the inferior margin of the opacity is concave, whereas with loculated fluid the fissure bulges downward. Also the fissures should not be separately visible in their normal positions, an important point in the differential diagnosis from pleural fluid, pleural thickening, or tumors lying within the fissures.
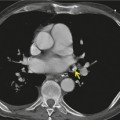
On CT (Figs 3.58 and 3.59),34.45.46.48. and 68. right middle lobe atelectasis appears as a triangular opacity bounded posteriorly by the major fissure, medially by the mediastinum at the level of the right atrium, and anteriorly by the minor fissure. The posterior boundary should be well defined. Unless the minor fissure is pulled well down, the anterior margin may be poorly defined on the CT images. The right middle lobe bronchus enters the posteromedial corner of the opacity, an important point in the differential diagnosis from loculated pleural fluid. Because the atelectatic middle lobe is effectively a sheet of tissue running obliquely through the chest, transverse CT sections are not aligned with the lobe and only small portions of the atelectatic lobe are seen on any one section.
 |
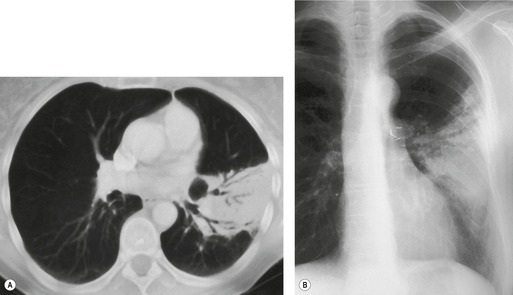
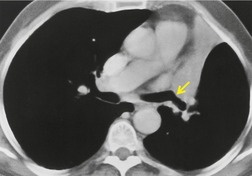
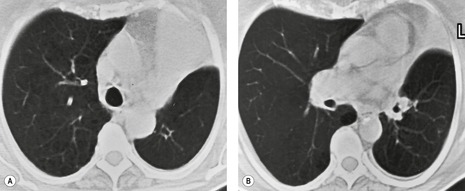
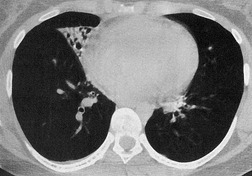
| Fig. 3.58 CT of right middle lobe atelectasis in the same patient as in Figure 3.57. Note the patent middle lobe bronchus and air bronchogram. Two adjacent sections are shown: A, a section at the level of the right middle lobe bronchus; B, a lower section. |
The term ‘middle lobe syndrome’ refers to chronic nonobstructive middle lobe collapse (see Fig. 3.57, Fig. 3.58 and Fig. 3.59). 33 The condition was originally thought to be due to tuberculous lymphadenopathy pressing on the middle lobe or lingular bronchus, but it is now believed that the entity is due to chronic inflammatory disease, which clears very slowly because of poor collateral drift. 72 Pathologically, the atelectatic lung may show bronchiectasis, chronic bronchitis with lymphoid hyperplasia, organizing pneumonia, and abscess formation. 73 In one series of 129 patients with chronic disease in the right middle lobe or lingula, most of whom were middle-aged women, 58 had no evidence of central obstruction, either by endobronchial or by extrabronchial masses. 74
Lower lobe atelectasis
The appearance of atelectasis of the lower lobes is sufficiently similar on the two sides that it is convenient to consider right and left lower atelectasis together. The loss of volume may affect the whole lobe, but the superior segment is frequently spared.
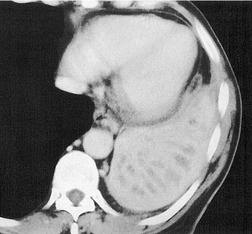
With atelectasis of either lower lobe (Figs 3.60 and 3.61), the major fissure rotates backward and medially, and the upper half of the fissure swings downward. Thus atelectatic lower lobes lie posteromedially in the lower thoracic cavity. The resulting triangular opacity is based on the diaphragm and mediastinum, with the fissure running obliquely through the thorax. On frontal projection the opacity of an atelectatic lower lobe is easier to recognize on the right than on the left because on the left it is often hidden by the heart, notably if the film is underpenetrated. With severe loss of volume the lobe becomes notably thin and appears as a sliver lying against the mediastinum (see Fig. 3.61). Sometimes, presumably when the inferior pulmonary ligament does not attach to the diaphragm, the lobe is plastered against the mediastinum but has little if any contact with the diaphragm. In these cases the atelectatic lobe assumes a rounded configuration and may resemble a mediastinal mass (Fig. 3.61). Care should be taken not to confuse a large but normal left cardiophrenic fat pad with left lower lobe collapse (Fig. 3.62). If the superior segment remains aerated, the upper half of the major fissure will often be identified on the frontal radiograph (Fig. 3.63). In these cases the major fissure may be confused with the minor fissure, a misinterpretation that can be avoided by remembering that the minor fissure does not cross medial to the hilum.
Lower lobe atelectasis is sometimes more obvious on the lateral than on the frontal radiograph. Unless the atelectasis is very severe, the density of the posterior thorax, notably the spine, is increased and the outline of the posterior half of the right or left hemidiaphragm shadow is lost. Normally, on the lateral view, each vertebra appears blacker than the one above as the eye travels down through the thorax to the diaphragm. In lower lobe atelectasis the lower vertebrae appear whiter than those higher up (see Figs 3.60 and 3.61). With very severe collapse, the outline of the ipsilateral hemidiaphragm may once again become visible, because compensatory expansion of the upper and middle lobe brings them into contact with the previously effaced diaphragm (Fig. 3.61). The opacity of the collapsed lobe may be difficult to recognize unless the observer is careful to observe the density of the vertebrae.
The major vessels supplying the lobes are displaced but, more importantly from a diagnostic point of view, they are invisible because they are coursing through an opaque lobe. Therefore, with complete lower lobe collapse, the lower lobe artery and its segmental divisions are displaced but invisible. Careful analysis of the hilum may, however, be needed to recognize this difference because displaced middle or upper lobe vessels may resemble the lower lobe arteries. A similar analysis of the bronchi may be more revealing: in most cases air within the bronchus can be identified coursing into the triangular density of the collapsed lobe.
Bronchial displacement can also be recognized on lateral chest films, but the signs are subtle and demand confident knowledge of the normal. 58 Normally the central bronchi run in the same direction as the trachea and travel obliquely backward as they descend, so that the right and left major airways are virtually superimposed on one another in a true lateral projection. The only difference is the higher origin of the right upper lobe bronchus and the differences inherent in the right lung having a middle lobe. Lower lobe atelectasis leads to backward displacement of the relevant airways. This displacement is useful in differentiating opacities caused primarily by pleural fluid from that caused by lower lobe collapse. With collapse the bronchi are pulled back, whereas with pleural fluid the bronchi may be pushed forward. 75
The appearance of the upper mediastinal contours may occasionally be helpful in drawing attention to, or confirming, the possibility of lower lobe atelectasis. Kattan76 emphasized three signs:
• The upper triangle sign77– this refers to a low-density, clearly marginated triangular opacity on frontal chest radiographs that resembles right-sided mediastinal widening. It is seen in right lower lobe atelectasis and is caused by rightward displacement of the anterior junctional tissues of the mediastinum (Fig. 3.64). The appearance superficially resembles right upper lobe atelectasis but should not be confused with it, because the fissural, vascular, and bronchial realignments all point to overexpansion of the right upper lobe rather than to atelectasis.
• The flat waist sign78 refers to flattening of the contours of the aortic knob and adjacent main pulmonary artery (see Fig. 3.61). It is seen in severe collapse of the left lower lobe and is due to leftward displacement and rotation of the heart. The appearance therefore resembles a shallow right anterior oblique view of the normal mediastinum.
• The outline of the top of the aortic knob may be obliterated in severe left lower lobe collapse. 76
On CT34.45.46.48. and 68. an atelectatic lower lobe produces a triangular opacity of soft tissue density in the posterior chest against the spine (Figs 3.60 and 3.65). The major fissure rotates to lie obliquely across the thoracic cavity. The lobe is fixed at the hilum, and the medial basal segment cannot move further back than the attachment of the inferior pulmonary ligament to the mediastinum. In cases where the inferior pulmonary ligament is incomplete, collapse of the basal segments may simulate a mass on CT just as it may on chest radiography. 79
Whole lung atelectasis
Whole lung atelectasis on either side leads to complete opacification of the hemithorax. The signs of compensatory shift are usually obvious. Mediastinal shift is invariably present, and herniation of the opposite lung is usually a striking feature (Fig. 3.66).
Combined right upper and middle lobe atelectasis
As there is no single bronchus to the right upper and middle lobes that does not also supply the right lower lobe, collapse of these two lobes with normal aeration of the lower lobe is unusual. This phenomenon is seen particularly with neoplastic disease, when, for instance, tumor obstructs one bronchus and extends through lung parenchyma or peribronchially to obstruct the other bronchus. The appearances80. and 81. are virtually identical to those seen with left upper lobe atelectasis on both chest radiography (Fig. 3.67) and CT. Occasionally atelectasis of the right upper lobe alone precisely mimics combined collapse of the right upper and middle lobes. 82
 |
| Fig. 3.67 (Courtesy of Dr. Michael Pearson, London, UK.) |
Combined right lower and middle lobe atelectasis
The combination of right lower and middle lobe atelectasis is seen with obstruction of the bronchus intermedius. The appearances are similar to atelectasis of the right lower lobe alone in both posteroanterior and lateral chest radiographs except that the abnormal density extends all the way to the lateral costophrenic angle (Fig. 3.68).43. and 80. The upper border of the opacity, formed by a combination of the major and minor fissures, can be convex or concave. In either case, the appearances can be confused with a subpulmonary pleural effusion. Similarly, on the lateral view the opacity extends from the front to the back of the thorax. 43
Distinguishing lower lobe collapse from pleural fluid
Lower lobe atelectasis can be difficult, and sometimes impossible, to distinguish from pleural effusion on posteroanterior and lateral radiographs. This diagnostic dilemma is most frequent in postoperative or acutely ill patients and is compounded by the fact that these patients are frequently examined with portable equipment in frontal projection only.
The diagnosis of lobar atelectasis depends on recognizing shift of structures, particularly the fissures, the hilar blood vessels, and the major bronchi. If the position of the fissures can be confidently established, the diagnosis is easy. If not, attention should be turned to the hila, particularly the position of the lower lobe arteries and bronchi. Two questions should be addressed: do these structures enter the opacity in question; and are they displaced in a direction that suggests collapse? For example, in a patient with basal opacity, if the lower lobe artery is obscured and the lower lobe bronchus runs vertically through the opacity, lower lobe atelectasis should be diagnosed. If, on the other hand, the lower lobe artery is clearly seen lateral to the opacity and the bronchus is not surrounded by the density, the opacity is not the result of lower lobe atelectasis.
Distinguishing between pleural effusion and lobar atelectasis is easy on CT (Fig. 3.69). On CT, the density of the atelectatic lobe is usually appreciably greater than that of the pleural effusion, particularly if intravenous contrast enhancement is used.34. and 48. Also, blood vessels and bronchi can be traced in the compressed lung.
Lobar atelectasis due to bronchiectasis
Lobar atelectasis may be the result of bronchiectasis (Fig. 3.70


Related posts:
Stay updated, free articles. Join our Telegram channel
Full access? Get Clinical Tree
