PULMONARY THROMBOEMBOLISM
The frequency of venous thromboembolism is influenced by many factors so that any estimate of incidence is not universally applicable. Approximately one individual per 1000 in the USA develops venous thromboembolism for the first time and a third of these will manifest pulmonary embolism. 1 Pulmonary embolism is the sole or major cause of death in 10–15% of adults dying in the acute care wards of general hospitals. However, there is some evidence to suggest that the incidence of pulmonary embolism is declining. 2
There appears to be a clear correlation between increasing age and the incidence of pulmonary embolism, with an exponential rise over the age of 45 years. 3 There is no obvious gender difference. Most predisposing factors for pulmonary embolism are well known and include a hypercoaguable state, orthopedic surgery, malignancy, immobilization, and pregnancy,4. and 5. although even in these recognized higher risk states, the exact incidence is difficult to gauge; for example, in pregnancy the risk of thromboembolism may have been overstated in the past. 6 In most individuals emboli arise from the deep veins of the legs but other sites, such as the upper limbs, 7 may be a source of emboli, particularly in patients with indwelling venous catheters. 8
Most pulmonary emboli lodge within the branches of the pulmonary arteries, but a few straddle the bifurcation of the main pulmonary artery (saddle emboli), and the occasional embolus lodges in the right side of the heart. The effects of emboli are primarily due to vascular obstruction.9. and 10. The bronchial circulation alone can sustain the lung parenchyma, and in so doing prevent embolic infarction.11. and 12. Animal studies suggest that compensatory bronchial artery dilatation occurs within days after pulmonary arterial occlusion,13. and 14. with collateral vessels developing over the succeeding months.15. and 16. Exactly why some emboli cause pulmonary infarction whereas others do not is uncertain, but it would appear that infarction occurs only when the combined bronchial and pulmonary arterial circulation is inadequate, a situation that applies particularly when emboli lodge peripherally in the pulmonary arterial tree.11. and 17.
Less than 15% of emboli cause true pulmonary infarction. 9 On pathologic study pulmonary infarction is characterized by ischemic necrosis of alveolar walls, bronchioles, and blood vessels within an area of hemorrhage. Most infarcts occur in the lower lobes, and the majority are multiple. Usually they are roughly cone-shaped areas of hemorrhage and edema that point toward the hilum and are based on the pleura, which is often covered by a fibrinous exudate, and accompanied by a small pleural effusion. Following infarction, fibrous replacement converts the infarct into a contracted scar, with indrawing of the pleura. Local hemorrhage may be the dominant finding with no evidence of tissue necrosis; these lesions resolve without residual scar formation.
Pulmonary edema is a rare consequence of pulmonary embolism, usually in patients with cardiovascular disease in whom pulmonary embolism precipitates left ventricular failure. 18 Emboli resolve over time and the vessel lumen is restored.9.19. and 20. The main mechanism is presumed to be intravascular lysis and fragmentation. In a few patients emboli do not lyse and the presence of repeated, unresolved emboli may lead to chronic pulmonary hypertension.21. and 22. A review of several follow-up studies that included patients anticoagulated for documented pulmonary embolism suggests that just over half of such patients have residual emboli at 11 months. 23 The effects of pulmonary embolism are summarized in Box 7.1.
Box 7.1
• Pulmonary infarction (<15%)
– Subsequent parenchymal scarring
• Local pulmonary hemorrhage without infarction
• Exudative pleural effusion
– Subsequent pleural thickening
• Pulmonary edema
– Either precipitated left ventricular failure or overperfusion of nonembolized lung
– Pulmonary hypertension following repeated unresolved emboli
The clinical manifestations of pulmonary embolism are protean and largely nonspecific,24. and 25. and it is therefore unsurprising that the diagnosis is often missed. Pulmonary embolism may be symptomatically silent, 26 but conversely it may be the unheralded cause of sudden death. Symptoms and signs include dyspnea, chest pain that is often pleuritic but is sometimes anginal, cough, hemoptysis, tachypnea, hypotension, tachycardia, fever, and a pleural friction rub.10. and 27.
Serologic tests such as D-dimer levels may be useful for excluding venous thrombosis.28. and 29. In some centers, the relatively high sensitivity of the enzyme-linked immunosorbent assay (ELISA) D-dimer test30 has led to its adoption, in conjunction with a careful assessment of clinical probability, as a means of ruling out the need for further investigations in patients with a negative D-dimer result.31.32.33. and 34. Nevertheless, false-negative results do occur in patients with pulmonary embolism, particularly those with subsegmental emboli. 35 A metaanalysis of the second generation of rapid D-dimer tests indicates sensitivity within the range of 87–98%. 36 The low specificity of D-dimer, resulting in raised levels in many disparate situations (including pregnancy, cancer, inflammatory disorders, and increasing age), is now well recognized and means that its usefulness lies in ruling out, not in, venous thromboembolism.37. and 38.
The possibility of pulmonary thromboembolism must be carefully considered because anticoagulant39 and thrombolytic40 therapy carry significant risks that would not be justified in the absence of pulmonary embolism; conversely, the consequences of undiagnosed pulmonary embolism may be dire.
Imaging of pulmonary emboli
Imaging tests used for the diagnosis of pulmonary embolism include chest radiography, scintigraphy, pulmonary angiography, computed tomography (CT) and magnetic resonance imaging (MRI). Over the past 15 years, there have been considerable shifts in the emphasis placed on the efficacy and use of individual tests;41. and 42. no single technique is infallible and clinical judgment coupled with an understanding of evidence of the efficacy of current tests is needed for the accurate diagnosis of pulmonary embolism. Factors that determine the optimal choice of diagnostic test include the pretest clinical probability of pulmonary embolism (arguably the most important factor), test availability, risks associated with the test (most often radiation), condition of the patient, cost, and risk of an inaccurate positive or negative diagnosis.
Chest radiography
Radiographic signs of pulmonary embolism and infarction have been extensively described.43.44.45. and 46. Before discussion of these signs it is important to state clearly that none is specific and that the sensitivity of the signs is poor.46.47. and 48. Even in patients with life-threatening pulmonary embolism, the chest radiograph can appear normal. 49 In one large series of 152 patients suspected of having pulmonary emboli, the overall sensitivity of the chest radiograph was 33% and the overall specificity was 59%. 48 Nevertheless, in one series the majority of chest radiographs of patients with acute pulmonary embolism showed an abnormality of some sort. 50 A major role of the chest radiograph is to exclude other diagnoses that might mimic pulmonary embolism, such as pneumothorax, pneumonia, or rib fractures, and to provide information that helps in interpreting the scintigram.51.52. and 53. There will, however, be some cases in which the chest radiograph will suggest the diagnosis, and it is therefore important to appreciate the radiographic signs, despite their low sensitivity and specificity. A useful framework for discussing the radiographic abnormalities in acute pulmonary emboli is to divide them into (1) pulmonary embolism without infarction and (2) pulmonary embolism with infarction.
Acute pulmonary embolism without infarction
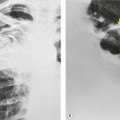
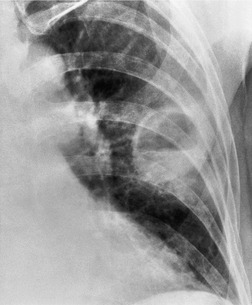
Since most emboli do not cause infarction, as discussed earlier, the radiographic signs of acute pulmonary embolism without infarction or hemorrhage are confined to oligemia of the lung beyond the occluded vessel (Westermark sign) 54 (Fig. 7.1), an increase in the size of the main pulmonary artery or of one of the descending pulmonary trunks and elevation of a hemidiaphragm.44.45.55.56. and 57. The nonspecificity of these signs is self-evident; chronic obstructive pulmonary disease may cause similar pulmonary vascular changes, and the position of the diaphragm is influenced by numerous factors, pulmonary embolism being just one.
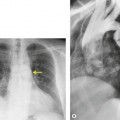
In some patients, linear densities58 may be a manifestation of pulmonary embolism. These shadows represent atelectatic lung (Fig. 7.2), not pulmonary infarcts,59. and 60. and are secondary to elevation of the diaphragm, inhibition of ventilation, and possibly depletion of surfactant.
Acute pulmonary embolism with infarction
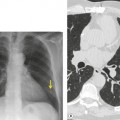
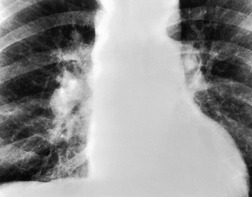
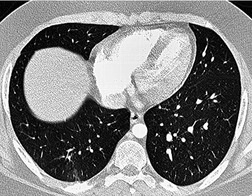
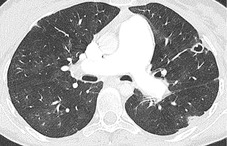
Typically, pulmonary infarction gives rise to radiographically detectable consolidation, which is usually multifocal and predominant in the lower lung zones. 11 Such shadows usually occur 12–24 hours after the embolic episode, although their appearance may be delayed for several days. 61 The resulting opacity (Fig. 7.3) may assume a variety of shapes depending on the location and underlying lobular architecture of the lung. 62 Consolidation of an entire lobe is, however, exceptional. 63
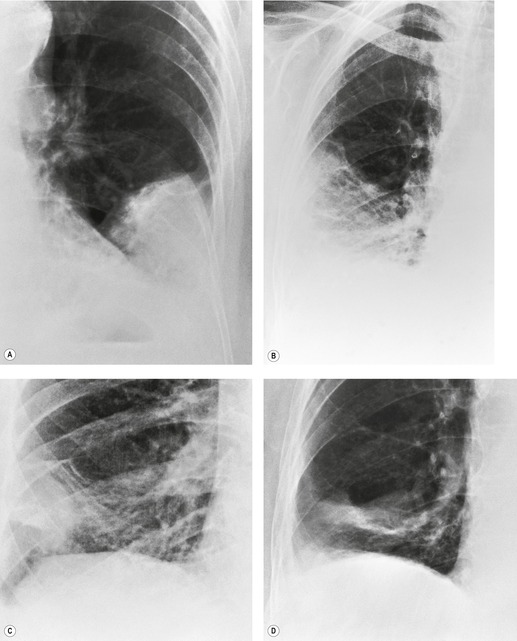
Hampton and Castleman64 described their famous ‘hump’ in an early paper that correlated the pathologic findings with the postmortem chest radiograph. They emphasized that ‘infarcts are always in contact with pleural surfaces and that the shadows are rarely, if ever, triangular in shape’ (a point worth knowing in the context of CT interpretation). They noticed that the central margin of the infarct shadow may be rounded, hence the term ‘hump’ (see Fig. 7.3). In fact, a Hampton hump is relatively unusual65 and is, in any event, a nonspecific finding. An air bronchogram within the hump is rarely seen on chest radiography. 66 Frequently, the clinical features point to one or another diagnosis; if they do not, the radiographic appearance of the opacity cannot be relied on to offer a distinction between the various causes of consolidation.
A theoretical, rather than practical, distinction between noninfarctive and infarctive consolidation can be made from the observation that, when the consolidation is the result of pulmonary hemorrhage without true infarction, radiographic clearing occurs quickly, often within a week, whereas infarction takes several months to resolve67 and frequently leaves permanent linear scars. 68 By 3 months, infarct shadows either are totally resolved or show no more than linear scarring or pleural thickening. 69 As infarcts resolve, they tend to ‘melt away like an ice cube’ (see Fig. 7.3), whereas acute pneumonia disappears in a patchy fashion. It may therefore be possible to suggest the diagnosis retrospectively, but this sign has no value at the time when it is most needed.
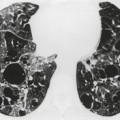
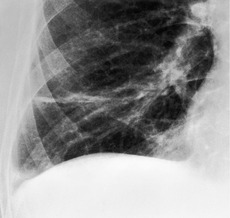
Cavitation within an infarct is relatively rare (Fig. 7.4). It may be seen in the absence of infection70. and 71. but cavitary infarcts may either be secondarily infected or result from septic emboli in the first place. Aseptic cavitation is more likely to occur in an area of infarction greater than 4 cm in diameter and usually occurs 2 weeks after the appearance of the focal consolidation. 72 The plain radiographic signs of pulmonary embolism are summarized in Box 7.2.
 |
| Fig. 7.4 |
Box 7.2
• Normal radiographic appearances (!)
• Regional oligemia
• Increase in size of a proximal pulmonary artery
• Elevated hemidiaphragm
• Linear atelectasis
• Focal peripheral consolidation (hemorrhage or infarction)
– Usually basal, infarcts may cavitate
• Pleural effusion
The frequency with which pleural effusions accompany pulmonary embolism is uncertain but in a carefully conducted prospective study approximately half of patients with acute pulmonary embolism also had a pleural effusion, and these were often bloody. 73 In a third of the cases the effusion was an isolated finding, and in the remaining two-thirds it was accompanied by radiographic evidence of pulmonary infarction or hemorrhage. A more recent study identified pleural effusions on chest radiography in a third of cases with acute pulmonary embolism (and in 47% of cases on CT). 74 Unsurprisingly both CT75 and ultrasonography76 identify pleural effusions more frequently (57% and 49% respectively).
Typically, pleural effusions are small and unilateral and appear soon after the onset of symptoms, but occasionally the effusions are bilateral and large. 46 Rarely pleural effusions are loculated and resemble an empyema; 77 in such cases the effusion may contain lymphocytes and resolve rapidly on anticoagulation treatment. It is interesting to note that most patients who have a pleural effusion have chest pain on the same side. 73 It appears probable that pleural effusions following pulmonary embolism are caused by infarction of the lung and that, in those cases in which no infarct shadow is visible on plain chest radiograph, the infarct is there but is hidden from view by the effusion73 (Box 7.3).
Box 7.3
• Small pleural effusions commonly accompany acute pulmonary embolism
• Pleural effusion reflects underlying infarction and is usually hemorrhagic
• Pleural effusion may be the only manifestation of pulmonary embolism on plain chest radiography (~30% of cases)
• CT shows subpleural pulmonary infarct(s) in most cases in which an effusion is present
Computed tomography pulmonary angiography (CTPA)
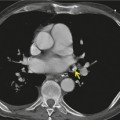
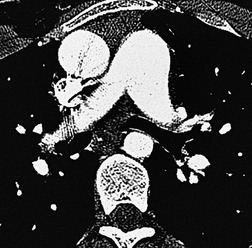
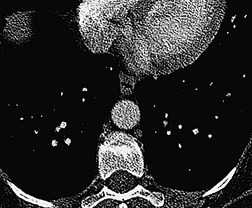
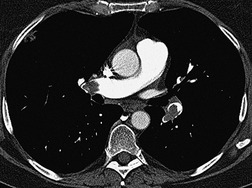
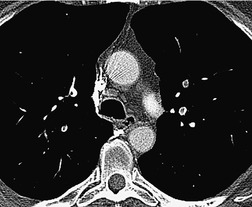
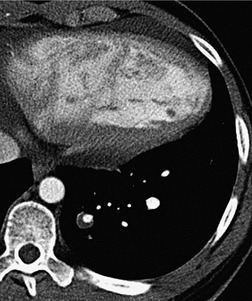
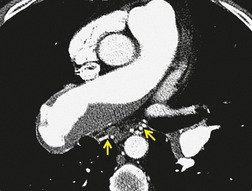
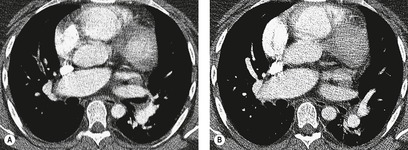
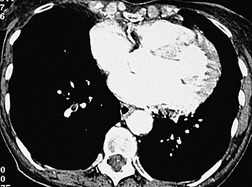
In the early days of CT, large emboli in the main pulmonary arteries were occasionally seen, usually by chance, on contrast-enhanced CT (Fig. 7.5),78.79. and 80. but their serendipitous detection depended on catching the intravascular bolus of contrast at the right time. 81 However, sometimes large acute emboli can be seen as an area of relatively high attenuation within a pulmonary artery on an unenhanced CT82 (Fig. 7.6). More recently a higher yield (21/51 cases of positive CTPAs) of emboli identifiable on unenhanced CT was reported by Cobelli et al.; 83 in this series the thrombus was hyperattenuating (n = 10), hypoattenuating (n = 5), or mixed density (n = 6).
 |
| Fig. 7.6 (From Kanne JP, Gotway MB, Thoongsuwan N, et al. Six cases of acute central pulmonary embolism revealed on unenhanced multidetector CT of the chest. AJR Am J Roentgenol 2003;180:1661–1664. Reprinted with permission from the American Journal of Roentgenology.) |
The advent of volumetric (spiral or helical) scanning84 paved the way for the improved demonstration of pulmonary embolism on contrast-enhanced CT imaging; examination of the entire thorax in a single breathhold is now routine with contrast administered more precisely, thus giving consistent opacification of the pulmonary arterial tree. Since the groundbreaking prospective study of Remy-Jardin et al. in 1992, 85 numerous studies have confirmed the ability of CTPA to demonstrate pulmonary embolism as far out as the early subsegmental level.85.86.87.88.89.90.91.92.93.94.95.96.97.98.99.100.101.102.103.104.105.106.107. and 108. The debate about the place of CTPA in the diagnostic hierarchy continues.109.110.111.112.113.114. and 115. Nevertheless, the rapid emergence and enthusiasm with which CTPA has been adopted – before complete evidence of its superiority over existing tests was gathered – is another example of ‘technology creep’; even when the shortcomings of CTPA are, in due course, fully appreciated it seems likely that CTPA will dominate algorithms for the imaging of pulmonary embolism in the foreseeable future. 116
Technical considerations
Many factors contribute to a technically satisfactory CTPA examination for the diagnosis of pulmonary embolism.117.118.119.120. and 121. The steady refinement of multidetector CT (MDCT) scanning protocols, with narrower collimation and faster data acquisition, possible with MDCT, has improved the detection of emboli at all levels and particularly in subsegmental arteries.122. and 123. Early studies using 5 mm collimation85.89.124. and 125. showed that CTPA was unable to demonstrate reliably emboli in pulmonary arteries below the fourth (segmental) generation. The improved ability of MDCT to detect peripheral emboli is largely dependent on increased acquisition speed (approximately 4 seconds in the case of 64-slice MDCT) which allows thin (~1 mm) sections to be obtained in a single breathhold.126.127.128.129. and 130. In one study 1 mm collimation image sets increased the detection of subsegmental emboli by 40% compared with 3 mm collimation images. 127 As important as the rapid acquisition of thin sections (the exact protocol depending on the number of rows of detectors of the CT scanner131. and 132.) is the necessity of achieving a high level and homogeneous degree of opacification of the pulmonary arterial tree.
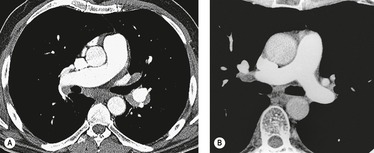
The iodine concentration, injection rate, and timing of the bolus of contrast have an important bearing on whether satisfactory opacification of the pulmonary arteries is obtained. Interestingly, it appears that reducing the kilovoltage (100 kVp rather than the standard 140 kVp) has a beneficial effect on the proportion of both peripheral and central pulmonary arteries that are analyzable on CTPA, 133 but whether this increases the diagnostic yield for pulmonary embolism is unknown. The problem associated with a high-concentration contrast medium (350 mg/mL iodine, or greater) is streak artifact from the superior vena cava, which may obscure the immediately adjacent right pulmonary artery (Fig. 7.7). The most obvious solution to this problem (the severity of which is to some extent determined by the characteristics of the CT scanner) is to reduce the flow rate and/or the concentration. However, low flow rates may not produce sufficient contrast enhancement of the segmental arteries (Fig. 7.8). Various iodine concentration protocols have been evaluated ranging from 120 mL to 140 mL of 15–30% iodine concentration contrast medium injected at a flow rate of 3–5 mL/s.98.120.128. and 134. Of the many values extractable from the literature, the most frequent are a volume and flow rate of 135 mL and 4 mL/s, respectively. With MDCT the shorter scan durations mean that much lower volumes of contrast (theoretically as little as 50 mL) can be used. As a generalization the volume and flow rate should be predicated on the duration of the injection of contrast matching the duration of the scan. 131 The use of gadolinium for CTPA, for the few patients for whom iodinated contrast medium is contraindicated, has been reported.135. and 136.
The optimal delay between the injection of contrast and the start of scanning is largely governed by the patient’s circulation time. For most patients, a 15–20-second delay is usually adequate. 137 Contrary to what might be expected, patients with pulmonary hypertension do not have a markedly reduced transit time through their lungs, unless there are clinical signs of right-side heart failure. 138 Overt cardiac dysfunction will, however, cause a delay in opacification of the pulmonary arteries (perhaps by 40 seconds, or more), the time at which the central and segmental and pulmonary arteries are optimally opacified is not always predictable and there are no readily available clinical parameters which predict transit time. 137 A ‘scout’ time–density curve can be performed after the injection of a small bolus of contrast to determine the time at which maximal opacification of the pulmonary arteries occurs120 but the extra time involved means that in practice this technique is not often used. Most CTs now have a bolus-tracking facility that triggers scanning once a predetermined level of enhancement (e.g. a rise in attenuation of 100 Hounsfield Units [HU]) has been reached within a region of interest (i.e. the central pulmonary arteries); this improves the chances of optimal vascular opacification considerably (Fig. 7.9). If 200 HU is taken as the optimal degree of contrast enhancement then (using a 30-second injection of 370 mg iodine/mL contrast followed by a 10-second saline flush ‘chaser’) the temporal window has been shown to lie between 16 and 41 seconds after the commencement of the injection; 139 importantly, in the context of ever faster CT scanners, a delay of at least 16 seconds after the start of injection is necessary.
Window settings have a marked effect on the ease with which pulmonary emboli can be detected and conventional mediastinal window settings may result in some filling defects being overlooked. 117 By modifying the window settings to encompass the whole gray scale of thrombus through to the opacified vessel in question (e.g. width 700 HU, level 100 HU), the conspicuity of filling defects may be increased. A disadvantage of this maneuver is that it may occasionally make the detection of an embolus that completely occludes a pulmonary artery more difficult. 117 The ability to flick between ‘pulmonary embolism’ and lung window settings is important to enable the distinction between pulmonary arteries (accompanied by a bronchus) and veins; the latter are often unenhanced in the early phase of scan acquisition (and thus may mimic pulmonary embolism). Image reconstruction with a very high spatial frequency algorithm should be avoided because of the possibility of producing an artifactual high-attenuation rim, simulating contrast, around the margin of vertically running vessels. 140 Reformatted images that depict such vessels in longitudinal axis have been reported to be useful.141. and 142. Remy-Jardin et al. 141 found that such reconstructions were most helpful in confirming the absence of pulmonary emboli in oblique vessels, that is, they reduced the number of inconclusive CT scans (Fig. 7.10). Such reconstructions did not add anything to the routine transverse CT scans that were classified confidently as either negative or positive for pulmonary emboli, 141 and the consensus now seems to be that post-processing is unnecessary for the diagnosis of acute pulmonary embolism. 116 Nevertheless, sliding thin-slab maximum intensity projections (MIPs) may be a useful way of rapidly evaluating the more peripheral pulmonary arteries. 143
Several patient-related factors will prevent the acquisition of a diagnostic study. The most obvious anatomic causes for suboptimal opacification of the pulmonary arteries include obstruction of the superior vena cava, a substantial left-to-right shunt, or a patent foramen ovale – all of which will reduce opacification; up to a fifth of patients investigated have a patent foramen ovale and as a consequence there may be early opacification of the aorta, with suboptimal opacification of the pulmonary arteries, particularly if the scan is obtained at deep inspiration. 144 The examination of patients who are unable to breathhold will result in suboptimal CT scans for two reasons. First, pulmonary arterial flow rate changes with the phase of respiration: pulmonary arterial pressure is raised at both end-expiration and end-inspiration145 so that arterial opacification is variable. Second, marked motion artifact from breathing causes image degradation, but this is less of an issue with rapid MDCT. Occasionally ingress of unopacified blood from the inferior vena cava transiently interrupts the continuous column of contrast within the pulmonary arteries, and this may mimic a filling defect.146. and 147.
Early reports suggested that the frequency of nondiagnostic CTPAs for pulmonary embolism was low, between 2% and 9%,93. and 98. and in the recent PIOPED II study 51/824 (6.2%) CTPAs were recorded as indeterminate. 106 In practice, outside the ambit of clinical trials, the proportion of indeterminate, if not frankly nondiagnostic, CTPAs is probably higher but exact figures are difficult to establish. A practical point is that with a suboptimal CTPA it is usually still possible to confirm or exclude pulmonary embolism to a certain anatomic level (e.g. first segmental arteries) and a report to this effect may have a bearing on how vigorously the referring clinician pursues further imaging, given the pretest probability of pulmonary embolism.
CTPA signs of acute pulmonary embolism
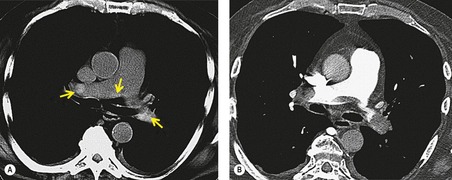
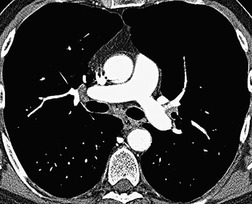
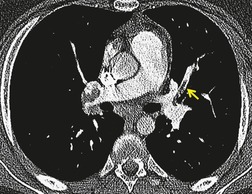
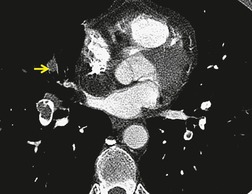
The cardinal sign of acute pulmonary embolism, that is a filling defect within an opacified pulmonary artery, is straightforward and analogous to the arteriographic sign of pulmonary embolism (Fig. 7.11).120.148.149. and 150. When contrast can flow around an embolus, the appearance is of a central or eccentrically placed filling defect within the artery lumen on perpendicular sections (Fig. 7.12) or a ‘tram-track’, if the artery lies parallel and within the plane of section (Fig. 7.13). If there is complete occlusion of a small pulmonary artery, such that there is no surrounding contrast medium, a pulmonary embolus may be less conspicuous (Fig. 7.14). A semi-quantitative score of the extent of pulmonary artery obstruction by emboli correlates well with echocardiographic151 and angiographic152 estimations of disease severity, but not necessarily with patient survival.153.154.155. and 156.
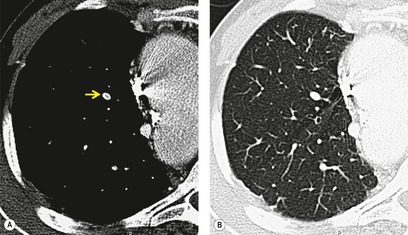
Ancillary signs of thromboembolic disease, such as a small dependent pleural effusion or focal consolidation in the costophrenic recess, although nonspecific, provides important additional evidence of pulmonary embolism. 157 A mosaic attenuation pattern in the lung parenchyma, analogous to the regional inhomogeneity seen on a scintigraphy perfusion scan, is sometimes present but is often subtle; in one study this feature was identified in only 1 of 13 patients who had acute pulmonary embolism. 158 However, CT densitometry and post-processing of contrast-enhanced CT images can show measurable differences between perfused and underperfused lung.159. and 160. Variation in the caliber of segmental and subsegmental pulmonary arteries can be striking, even in the absence of identifiable embolism on CTPA at that level (Fig. 7.15). The presence or absence of parenchymal and pleural abnormalities on CT in patients with suspected pulmonary embolism is largely nondiscriminatory in determining the diagnosis of pulmonary embolism. 75 Nevertheless, scrutiny of the lung window settings of the entire volume included is important because ancillary signs of pulmonary embolism, such as small peripheral infarcts, pleural effusions, or a mosaic perfusion pattern, 157 may be revealed (Fig. 7.16). Furthermore, CT may show other abnormalities that provide an alternative explanation for the patient’s symptoms.87.93.101. and 161. In massive pulmonary embolism there may be signs of right heart strain such as right ventricular dilatation and straightening of the interventricular septum,162. and 163. which may presage a poor outcome, 164 but not all studies agree on this point. 165 Increased right ventricular to left ventricular (short axes) ratio and dilatation of the azygos vein have also been reported to be associated with increased mortality. 155
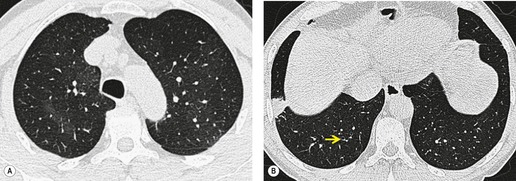
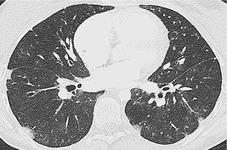
Infarcts in the lung on CT may show a pleural-based truncated cone or triangular configuration – a shape that corresponds to the Hampton hump described in the section on chest radiography. While the cross-sectional images of CT show the wedge shape of pulmonary infarction to advantage166 (see Fig. 7.16), a postmortem high-resolution CT (HRCT) study of 83 fixed lungs with subpleural densities (12 contained pulmonary infarcts and 71 a variety of pathologic conditions including pneumonia, hemorrhage, and tumor) showed that there was no significant difference in the frequency of wedge-shaped opacities on CT between the lungs with infarcts and those with other disorders. A ‘vascular sign’ (a vessel running into the apex of the wedge) was slightly more common in the infarct group167 (Fig. 7.17). However, some infarcts do not have the truncated wedge configuration but have a more rounded form without a broad base in contact with the pleura and indeed some infarcts, apart from their distinctly subpleural location, do not have any obvious characteristics (Fig. 7.18).79. and 168.
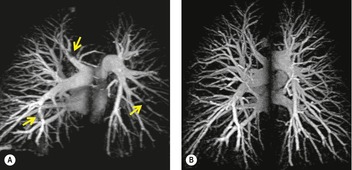
The distinction between acute and chronic pulmonary embolism on CTPA is, as with other tests, not always possible. The hemodynamic consequences of recurrent pulmonary emboli may be seen as dilatation of the proximal pulmonary arteries, tortuosity of the intrapulmonary arteries, and narrowing of the peripheral pulmonary vessels with a mosaic attenuation pattern. 169 Chronic pulmonary embolism usually appears as a crescentic thrombus adhering to the arterial wall (Fig. 7.19); the thrombus occasionally contains calcifications and may show signs of recanalization.169.170. and 171. In more severe cases there may be hypertrophy of the systemic supply to the lungs, particularly the bronchial arteries172 (Fig. 7.20). Although it is hard to establish the exact prevalence, changes in the lung periphery – reflecting previous pulmonary infarcts – are present in most patients with chronic thromboembolism (the signs encountered in patients with pulmonary hypertension secondary to chronic thromboembolism are discussed more fully on pp. 417–419).
The causes of a false-negative CTPA are most often due to technique. 173 Conversely, mimics of pulmonary embolism causing false-positive results are less frequent and more often due to anatomic variants or unrelated pathology (Box 7.4).
Box 7.4
False negatives
• Inadequate opacification of pulmonary arteries (factors: flow rate, concentration of contrast, and scan delay) (see Fig. 7.8)
• Emboli confined to peripheral subsegmental pulmonary arteries
• Unfavorable patient hemodynamics (e.g. cardiomyopathy, patent foramen ovale, superior vena cava obstruction, right-sided heart failure)
• Motion artifact degrading image (severe respiratory movement or cardiac pulsation artifact)
• Partial volume effect (inappropriate thick collimation)
• Low signal-to-noise ratio (insufficient milliamperage/large patient) (see Fig. 7.8)
• Beam hardening from concentrated contrast in the superior vena cava (obscuring adjacent right pulmonary artery)
• Extensive parenchymal disease or any cause of increased pulmonary vascular resistance (e.g. consolidation, atelectasis or pulmonary fibrosis)
False positives
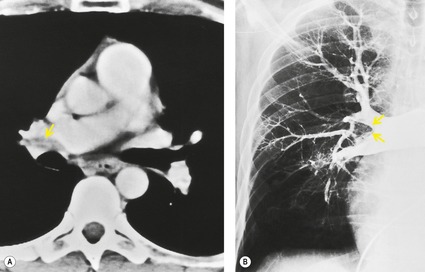
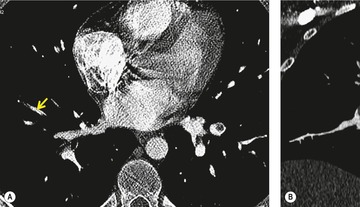
• Hilar and bronchopulmonary lymph nodes (Fig. 7.21) (especially N1b, N2a, and N2b lymph nodes adjacent to the right main pulmonary artery (Fig. 7.21)
• Partial opacification of pulmonary arteries or veins (e.g. insufficient scan delay resulting in pseudofilling defects in pulmonary arteries, partial opacification of pulmonary veins (not recognized as such) (Fig. 7.22)
• Partial volume effect (e.g. adjacent mediastinal fat, oblique running pulmonary vessels [Fig. 7.23])
• Artifactual high-attenuation collar around vertically orientated arteries (caused by inappropriate use of high spatial frequency reconstruction algorithm)
• Any cause of focal reduced pulmonary perfusion (i.e. reduced blood flow, and thus vascular opacification, in consolidated lung; transiently unopacified blood from inferior vena cava)
• In situ thrombosis (e.g. in post-pneumonectomy arterial stump)
Small or moderately enlarged lymph nodes arising immediately adjacent to the central and segmental pulmonary arteries are a frequent cause of false-positive diagnosis of pulmonary embolism for the unwary. An intimate knowledge of the precise location of these lymph nodes is desirable; 174 the most frequently identified lymph node (and also the most convincing mimic of an intravascular filling defect) lies on the superolateral aspect of the right main pulmonary artery. This fibrofatty lymph node, classified as N1b, may be identified in up to 80% of individuals174 (Fig. 7.21B). Other bronchopulmonary lymph nodes lying around the more vertically orientated lower lobe and segmental pulmonary arteries are more readily identified as such because of their eccentric disposition around the circumference of the arteries. Pulmonary veins, when partially opacified, may also cause interpretative problems. However, the identification of pulmonary veins as such can be made by following their course to a central pulmonary vein on contiguous sections on lung window settings (and noting the lack of an accompanying bronchus).
Accuracy of CTPA
Final conclusions about the accuracy of CTPA remain difficult to reach because of differences in patient populations studied, technique, location of emboli, whether CT venography is included, and crucially the chosen ‘gold standard’. In an early systematic review of published studies up to the year 2000, the reported sensitivity of CTPA ranged from 53% to 100% (specificity 81–100%). 175 Although some of these fin de siècle studies of CTPA have been criticized on methodologic grounds, it is worth remarking that they are generally more robust than those that led, in an earlier era, to the adoption of scintigraphy for the diagnosis of pulmonary embolism. In the landmark study of Remy-Jardin et al. in 1992, 85 the sensitivity and specificity of CTPA for the detection of acute central pulmonary embolism was 100% and 96%, respectively. The same group later reported a sensitivity and specificity of 91% and 76% in a larger group of patients. 98 The discrepancy between the two studies was explained by the exclusion of technically unsatisfactory CTPAs in the first study. Later studies (of comparable methodology but with MDCT against angiography) indicate that the range of sensitivity for CTPA is 83–100% and the range of specificity 89–97%.106.108. and 176. Interobserver agreement appears to be good for CTPA: in a European study, observer agreement for CTPA (kappa 0.72) was superior to pulmonary angiography (kappa 0.46), which was in turn superior to ventilation/perfusion ( ) scanning (kappa 0.39). 102 Similar, or better, results of observer agreement for CTPA have been subsequently reported.105.177.178. and 179.
) scanning (kappa 0.39). 102 Similar, or better, results of observer agreement for CTPA have been subsequently reported.105.177.178. and 179.The emergence of CTPA for the detection of pulmonary embolism has highlighted the problems of comparing a new diagnostic technique with an established, but fallible, test. Pulmonary angiography was historically regarded as the standard to which CTPA should aspire (pulmonary angiography has an estimated sensitivity of 98% and specificity of 97%), 100 despite the fact that CTPA can occasionally detect pulmonary embolism in the face of a technically adequate negative pulmonary angiogram. 180 A metaanalysis of 15 studies (including 3500 patients followed for at least 3 months) has confirmed that the negative predictive value of a CTPA that rules out pulmonary embolism (negative predictive value 99.4%; 95% CI 98.7% to 99.9%) is comparable to pulmonary angiography. 113
The anatomic level down to which emboli can be ‘chased’ in small subsegmental vessels has progressed with further improvements in MDCT technology.126.127.130.181. and 182. The question about the prevalence of emboli confined to the subsegmental pulmonary arteries (anywhere between 2% and 36%)118. and 183. cannot easily be answered, but is probably less than 5%. 184 The hemodynamic effects of a small subsegmental embolus will be negligible in normal individuals (and the risks of anticoagulation may outweigh any putative benefit) but may be more important in patients with severe cardiopulmonary disease. Moreover, the idea that such small emboli should be regarded as the herald of a larger, possibly fatal, embolus has been questioned. 184 Nevertheless, the current consensus is that anticoagulation for patients with isolated subsegmental pulmonary embolism is usually indicated in (1) patients with little cardiopulmonary reserve, (2) patients with accompanying acute deep venous thrombosis and (3) patients with thrombophilia who are at risk of developing chronic pulmonary embolism and consequent pulmonary arterial hypertension. 116
Much effort has gone into the investigation of the implications of a negative CTPA in patients suspected of having pulmonary embolism.103.113.185.186.187.188.189.190.191. and 192. In the absence of a reliable gold standard diagnostic test, there is much merit in what are, in effect, patient outcome studies. Not only does the negative predictive value of CTPA appear to be good,113.185.186. and 193. even in the presence of an underlying lung disease, 191 the CT examination may provide alternative diagnoses in a substantial proportion of patients with a negative CTPA.103.132.185. and 194. There is increasing interest in modifying the MDCT technique by employing electrocardiographic (ECG)-gating so that in a single examination evaluation for pulmonary embolism, right ventricular function, and coronary artery disease may be possible;195.196. and 197. longer scanning times, intrinsic to ECG-gating, and the increased radiation burden to patients may be mitigated by dual source CT technology.
Inevitably, a negative CTPA cannot absolutely exclude the possibility of a future embolic episode. However, a review by Gulsun and Goodman192 of seven studies that documented the outcome of a total of 7128 patients with a negative CTPA suggests a very small likelihood of subsequent pulmonary embolism (average 0.7%, range 0.5–1.8%) and, more specifically, death from pulmonary embolism (average 0.2%, range 0–1.6%). Thus the inference has been made that anticoagulation can be safely withheld in most patients with a negative CTPA, the caveat being that patients with poor cardiopulmonary reserve should also undergo leg Doppler ultrasonography or CT venography.106. and 198.
The primacy of CTPA in various diagnostic pathways for the evaluation of patients with suspected pulmonary embolism is now acknowledged.116. and 199. The debate began in 1996 with a controversial editorial by Goodman and Lipchik, 200 which suggested that in many situations CTPA should be the first investigation in patients with suspected pulmonary embolism; numerous subsequent studies have largely supported this recommendation. Nevertheless, the undesirability of simply adding another test to other more or less inadequate tests is clear.201. and 202. Many of the proposed diagnostic algorithms in the past have built-in assumptions and biases, 203 such as the equivalent availability and cost of various tests, the same pretest probability of pulmonary embolism, 204 and the same importance of identifying large versus small emboli in all patients. Local differences in the availability of scintigraphy and CTPA are likely the single most important determinant of which tests are used.
An interesting debate about the emerging role of CTPA in the late 1990s can be found in a series of responses from experts205.206.207. and 208. to a commentary by Goodman. 209 The approach favored by Goodman at that time relied on the high specificity of a normal perfusion scintigram and the stratification of patients into outpatients (typically patients with a low pretest probability of pulmonary embolism and no pulmonary disease apparent on chest radiography) and inpatients (patients with a higher probability of pulmonary embolism and often with preexisting cardiopulmonary disease). Goodman209 emphasized that his approach should not be regarded as a rigid algorithm and with the passage of time some authorities have relegated scintigraphy to an alternative test that should be reserved for patients who cannot undergo CTPA. 116 The recent authoritative recommendations from the PIOPED II investigators199 and the Fleischner Society116 emphasize that, on the basis of currently available evidence, a ‘one algorithm fits all’ does not exist and assessment of pretest probability is a pivotal first step in choosing appropriate tests. Current recommendations are based on assimilation of numerous studies, most notably large and carefully designed studies reporting at or after 2005.106.111. and 210. The credo that an attempt to objectively stratify patients as having low, moderate, or high probability of pulmonary embolism should always be made, because it informs what tests are appropriate, cannot be overemphasized. 199 The measurement of plasma D-dimer (a degradation product of cross-linked fibrin) remains controversial, but because of its high sensitivity (95%) but low specificity (55%) for venous thromboembolism it can safely exclude pulmonary embolism in patients with a low pretest probability.211.212. and 213.
Pregnant women merit particular consideration because of their higher risk of pulmonary embolism, concerns about the effects of radiation (and to a lesser extent contrast media) on mother and child, and the potentially perturbing effects of pregnancy on D-dimer testing. With regard to D-dimer, a negative test remains a reassuring means of excluding significant thromboembolism (D-dimer levels rise throughout pregnancy). 214 Conversely, a positive venous ultrasound study may preclude further imaging using ionizing radiation. There is controversy about whether CTPA or a scintigraphy perfusion scan (assuming normal chest radiograph and venous ultrasound) is the most appropriate next test;215. and 216. approximately half of radiologists in a US survey used CTPA in preference to  scanning, 217 although dose-reducing strategies for CTPA were employed by only 40% of the respondents. The reported effective radiation received by mother and fetus from CTPA versus a scintigraphy scan, respectively, varies widely,218. and 219. but the consensus is that a perfusion scan alone imparts less to the fetus than CTPA.216. and 220. What is not in doubt is that CT venography, with its inherently high radiation dose to the pelvis, has no place in the investigation of a pregnant patient. If CTPA is performed there is the theoretical risk for the baby of contrast-induced hypothyroidism, and thyroid function testing within the first week of birth is recommended. 221
scanning, 217 although dose-reducing strategies for CTPA were employed by only 40% of the respondents. The reported effective radiation received by mother and fetus from CTPA versus a scintigraphy scan, respectively, varies widely,218. and 219. but the consensus is that a perfusion scan alone imparts less to the fetus than CTPA.216. and 220. What is not in doubt is that CT venography, with its inherently high radiation dose to the pelvis, has no place in the investigation of a pregnant patient. If CTPA is performed there is the theoretical risk for the baby of contrast-induced hypothyroidism, and thyroid function testing within the first week of birth is recommended. 221Few studies have attempted to address the cost implications of various diagnostic algorithms.222.223. and 224. In one analysis of 15 combinations of the diagnostic tests (CTPA, lower limb ultrasonography,  scanning, pulmonary arteriography, and D-dimer plasma levels), the authors found that the five strategies that were most effective (least mortality at 3 months and lowest associated costs per life saved) all included CTPA, usually in combination with lower limb ultrasonography. 100 Using CTPA as the initial test, with or without subsequent leg ultrasonography, is undoubtedly an expensive option, but is associated with improved survival. 225 It can be argued that CTPA used alone is not cost effective, but becomes so when it is used in combination with D-dimer testing and lower limb ultrasonography. 224
scanning, pulmonary arteriography, and D-dimer plasma levels), the authors found that the five strategies that were most effective (least mortality at 3 months and lowest associated costs per life saved) all included CTPA, usually in combination with lower limb ultrasonography. 100 Using CTPA as the initial test, with or without subsequent leg ultrasonography, is undoubtedly an expensive option, but is associated with improved survival. 225 It can be argued that CTPA used alone is not cost effective, but becomes so when it is used in combination with D-dimer testing and lower limb ultrasonography. 224Many studies, in particular the PIOPED II study, 106 have investigated the benefits of combining CT venography of the deep veins of the legs with CTPA,226.227.228.229.230.231. and 232. the rationale being that pulmonary embolism and deep venous thrombosis (DVT) are part of the same process, and that the detection of either is important. The increased diagnostic yield from CT venography, that is the proportion of patients with positive CT venography but negative CTPA, is reported to be between 3% and 8%.106.226.229.232. and 233. Whether such individuals include the very small proportion of patients with a negative CTPA who subsequently have pulmonary embolism remains a matter for conjecture. The influential PIOPED II study concluded that CTPA alone (sensitivity 83%, specificity 96%) was less adequate than combined CTPA/CTV (sensitivity 90%, specificity 95%) for the diagnosis of pulmonary thromboembolism. 106 The CT signs of DVT are, as might be expected, a filling defect within an opacified and distended vein234. and 235. (Fig. 7.25); in acute DVT, enhancement of the vein wall is occasionally seen reflecting the hyperemia. Rarely there are features suggesting perivenous soft tissue edema. 236 The first comprehensive study of the combined technique of CTPA followed by CT venography by Loud et al. in 199896 indicated that no extra contrast material was needed, and that a delay of up to 3.5 minutes was necessary to allow opacification of the veins of the legs and pelvis. More recent studies have suggested that peak venous opacification occurs earlier, at about 2 minutes, 237 although the timing for optimal opacification does not appear to be critical, and a 3-minute delay seems satisfactory. 238 Widely interspaced (4–5 cm) 10 mm collimation sections from the diaphragm to the ankles have been recommended. 239 Studies using contiguous sections226 through the pelvis are clearly associated with a considerably higher radiation burden than interspaced sections and the PIOPED II investigators have suggested that there is little to choose between them. 240Narrower than usual width (100 HU as opposed to 400 HU) windows for abdominal examinations improve the often low contrast encountered in CT venography.
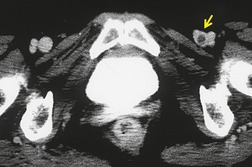 |
| Fig. 7.25 (With permission from Cham MD, Yankelevitz DF, Shaham D, et al. Deep venous thrombosis: detection by using indirect CT venography. The Pulmonary Angiography-Indirect CT Venography Cooperative Group. Radiology 2000;216:744–751. Copyright Radiological Society of North America.) |
The reported sensitivity, specificity, and observer agreement for CT venography are good, but decreased in asymptomatic patients or those with nonocclusive thrombosis.241. and 242. The attraction of a ‘one-stop shop’ examination for the diagnosis of venous thromboembolism is obvious, but concerns, particularly about the added radiation of CT venography, have been voiced.243. and 244. Risk/benefit issues are less crucial in older or critically ill patients; indeed, there are clear attractions for a comprehensive screen for venous thromboembolism in ICU patients. 245 However, even with interspaced sections, the radiation imparted to the pelvis is considerable (between 2.5 mSv and 6 mSv depending on technique), 116 and compelling evidence that CT venography should be part of a CTPA examination is lacking. In most circumstances when identification of lower extremity DVT is needed, Doppler ultrasound is the examination of choice.
Magnetic resonance imaging
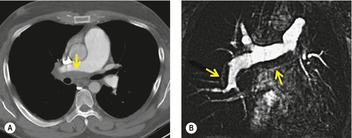
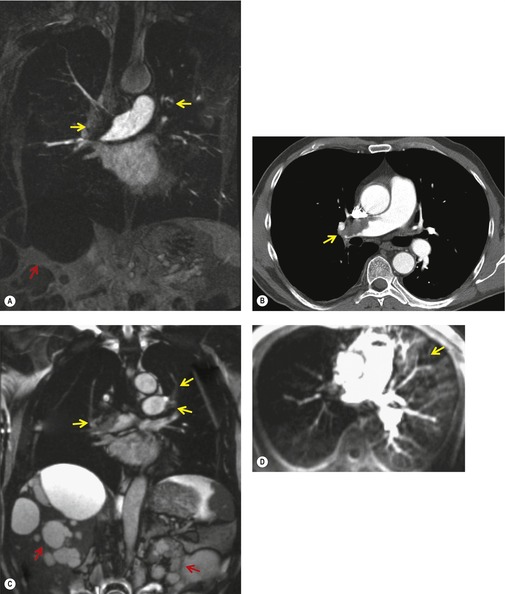
MRI is a less widely available alternative to CTPA for the diagnosis of pulmonary embolism and has the advantage that it does not use ionizing radiation (Fig. 7.26). The rapid development of a variety of magnetic resonance (MR) angiography techniques has meant that few large-scale studies, using a single standardized MR imaging protocol, to compare its diagnostic efficacy with other currently available tests have been performed. Nevertheless, an analysis of three comparable gadolinium enhanced MR studies, with conventional pulmonary angiography as the gold standard, documented a range of sensitivities (77–100%) and high specificities (95–98%). 246 As with CTPA the detection rate of emboli varies with the size of the pulmonary artery under consideration; for example, Oudkerk et al. 247 reported sensitivities of 100%, 84%, and 40% for emboli in the lobar, segmental, and subsegmental emboli, respectively (Fig. 7.27).
 |
| Fig. 7.26 (From Ley S, Kauczor HU, Heussel CP, et al. Value of contrast-enhanced MR angiography and helical CT angiography in chronic thromboembolic pulmonary hypertension. Eur Radiol 2003;13:2365–2371. With permission from Springer Science+Business Media.) |
 |
| Fig. 7.27 (Reprinted with permission from Oudkerk M, van Beek EJ, Wielopolski P, et al. Comparison of contrast-enhanced magnetic resonance angiography and conventional pulmonary angiography for the diagnosis of pulmonary embolism: a prospective study. Lancet 2002;359:1643–1647. Copyright Elsevier.) |
There are several fundamentally different MR techniques that can be used for the detection of pulmonary embolism. 248 In this context, the most frequently described approaches to MRI demonstration of pulmonary embolism have been:
• Spin-echo technique in which thrombotic emboli are seen as white objects, whereas fast flowing blood is black.
• Gradient-recalled-echo (GRE) technique with flow compensation in which emboli are dark and flowing blood is white.
• Phase-contrast technique, which can be used to clarify that an intraluminal signal (gray) is due to a thrombotic embolus rather than slow flowing blood. 249
Refinements include MR pulse sequences that emphasize the signal of flowing blood, and at the same time suppress signal from static structures; the resulting blood signal is post-processed to produce a two- or three-dimensional angiogram.250.251.252.253. and 254. Intravenous gadolinium contrast medium may be used to enhance further the blood signal247.255. and 256. (see Fig. 7.27). In addition, defects in pulmonary perfusion, analogous to the cardinal sign of pulmonary embolism on scintigraphy perfusion scanning, may also be demonstrated on noncontrast257 or gadolinium-enhanced MR angiography.258.259. and 260. Using a sophisticated three component MR protocol (real time MRI, MR perfusion imaging, and MR angiography) – all acquired within 10 minutes – Kluge et al. 261 reported a sensitivity of 100% and specificity of 93% for the combined protocol; these figures reflect, in part, the high sensitivity but low specificity of the MR perfusion component for subsegmental emboli (Fig. 7.28). In the same way that the role of CT venography in patients with suspected pulmonary embolism may be combined with CTPA, the utility of detecting pelvic and leg thrombosis with MR angiography has been explored.262.263.264. and 265. MR venography has a high sensitivity and specificity for iliocaval thrombosis and with advances such as parallel acquisition technique and table stepping, the venous system from the ankles to the inferior vena cava can be imaged in less than 10 minutes.263. and 266. Despite the attractions of a one-stop shop approach to the imaging of pulmonary and venous thromboembolism with MR its use is largely reserved for patients who cannot be given iodinated contrast medium for a CTPA, or for whom radiation dose is a prime concern.
 |
| Fig. 7.28 (From Kluge A, Luboldt W, Bachmann G. Acute pulmonary embolism to the subsegmental level: diagnostic accuracy of three MRI techniques compared with 16-MDCT. AJR Am J Roentgenol 2006;187:W7–14. Reprinted with permission from the American Journal of Roentgenology.) |
Scintigraphy
Lung scintigraphy involves the simultaneous imaging of the distributions of pulmonary blood flow and alveolar ventilation. The combined study is called a ventilation/perfusion ( ) scan and remains a widely available test. The technical aspects of
  scanning are considered in Chapter 1. In the era of readily available CT pulmonary angiography the role of
  scanning has become more circumscribed but it remains an effective test, particularly for ruling out pulmonary embolism;267. and 268. it remains the preferred test for those patients who cannot undergo CTPA.116. and 269. The principle underlying the diagnosis, i.e. ‘the scintigraphic diagnosis’, of pulmonary embolism is that, whereas pulmonary perfusion is abnormal, the pulmonary parenchyma usually remains intact and ventilation remains normal. This gives rise to the so-called mismatched perfusion defect, the hallmark of pulmonary embolic disease. If embolism results in pulmonary infarction, a defect of ventilation also appears, corresponding to the perfusion defect. There is a trend towards performing a perfusion (Q) scan without a concomitant ventilation (
 ) scan, 270 and provided the perfusion scan is read in conjunction with a chest radiograph, accuracy comparable with a
  scan, or CTPA, may be achieved.271. and 272.
) scan and remains a widely available test. The technical aspects of scanning are considered in Chapter 1. In the era of readily available CT pulmonary angiography the role of scanning has become more circumscribed but it remains an effective test, particularly for ruling out pulmonary embolism;267. and 268. it remains the preferred test for those patients who cannot undergo CTPA.116. and 269. The principle underlying the diagnosis, i.e. ‘the scintigraphic diagnosis’, of pulmonary embolism is that, whereas pulmonary perfusion is abnormal, the pulmonary parenchyma usually remains intact and ventilation remains normal. This gives rise to the so-called mismatched perfusion defect, the hallmark of pulmonary embolic disease. If embolism results in pulmonary infarction, a defect of ventilation also appears, corresponding to the perfusion defect. There is a trend towards performing a perfusion (Q) scan without a concomitant ventilation () scan, 270 and provided the perfusion scan is read in conjunction with a chest radiograph, accuracy comparable with a scan, or CTPA, may be achieved.271. and 272.Interpretation of the  scan
scan
An appreciation of how ‘defects’ on perfusion and ventilation scintigraphy are generated greatly helps in the correct interpretation of the  scan. The diagnostic feature of pulmonary embolism in a
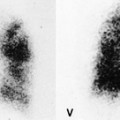
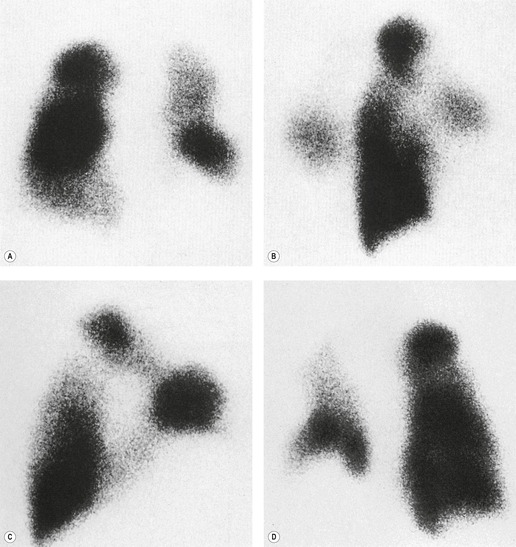
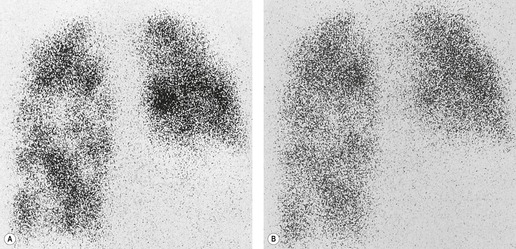
  lung scan is a perfusion defect in a region of normally ventilated lung – the mismatched perfusion defect (Figs 7.29 and 7.30). The size of the defect may range from appreciably smaller than a segment (subsegmental), to about the size of a segment (segmental), or very rarely a lobe or whole lung. A nonsegmental defect is one that does not correspond to segmental anatomy. The pathologic basis of the mismatched perfusion defect is that in uncomplicated pulmonary embolism, in otherwise healthy individuals, the pulmonary architecture remains intact and ventilation is therefore normal. However, when embolism is followed by lung infarction, a ventilation defect appears, although it is usually smaller than the perfusion defect because the lung around the periphery of the perfusion defect continues to ventilate. The diagnostic feature of a pulmonary infarct, therefore, is an incompletely matched perfusion defect (see Fig. 7.30) in association with an appropriate radiographic abnormality. The positive identification of a pulmonary infarct on a
  lung scan depends on high-quality, multiprojection imaging, and can be improved with single photon emission computed tomography (SPECT) imaging.3. and 273.
scan. The diagnostic feature of pulmonary embolism in a lung scan is a perfusion defect in a region of normally ventilated lung – the mismatched perfusion defect (Figs 7.29 and 7.30). The size of the defect may range from appreciably smaller than a segment (subsegmental), to about the size of a segment (segmental), or very rarely a lobe or whole lung. A nonsegmental defect is one that does not correspond to segmental anatomy. The pathologic basis of the mismatched perfusion defect is that in uncomplicated pulmonary embolism, in otherwise healthy individuals, the pulmonary architecture remains intact and ventilation is therefore normal. However, when embolism is followed by lung infarction, a ventilation defect appears, although it is usually smaller than the perfusion defect because the lung around the periphery of the perfusion defect continues to ventilate. The diagnostic feature of a pulmonary infarct, therefore, is an incompletely matched perfusion defect (see Fig. 7.30) in association with an appropriate radiographic abnormality. The positive identification of a pulmonary infarct on a lung scan depends on high-quality, multiprojection imaging, and can be improved with single photon emission computed tomography (SPECT) imaging.3. and 273.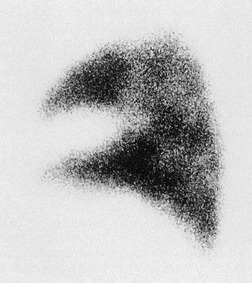
A perfusion scan showing two or more defects of segmental size or larger in the presence of a normal ventilation scan (Fig. 7.31) and the appropriate clinical setting signifies a high probability (greater than 90%) of recent pulmonary embolism, whereas a normal perfusion scan effectively excludes embolism (likelihood ≪5%), whatever the ventilation scan shows.274.275. and 276. However, patients with suspected pulmonary embolism often have coincidental cardiopulmonary disease making it more difficult to rule in or rule out the diagnosis of pulmonary embolism.
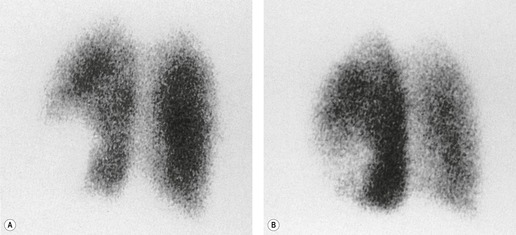
Complete matching of defects is often seen in obstructive airways disease, either acute, as in bronchial asthma, or chronic, as in chronic obstructive airways disease (Fig. 7.32). Defects are complete and matched because of efficient hypoxic vasoconstriction, a defense mechanism that prevents pulmonary arterial blood from circulating through nonventilated lung. Hypoxic vasoconstriction may nevertheless be incomplete, in which case a region of lung may be better perfused than ventilated – a so-called reversed mismatch (Box 7.5).

Box 7.5

• Basal pleural effusion
• Lobar pneumonia
• Lobar collapse
• Acute partial bronchial obstruction
• Chronic obstructive airway disease
Several chest diseases are characterized by reversed mismatching, including pleural effusions and fluid in the fissures, lobar pneumonia, collapsed and consolidated lung, and gross cardiomegaly (which compresses the adjacent lung).277.278. and 279. The phenomenon is also seen in acute partial bronchial obstruction, in which the chest radiograph may appear normal, and in chronic obstructive airway disease, especially in acute exacerbations. 280 In these conditions, hypoxic vasoconstriction fails or is incomplete. Completely matched defects are seen in destructive parenchymal disease, such as bullous or fibrosing lung disease and pulmonary abscess.
It has proved difficult to find a terminology that precisely conveys the likelihood of pulmonary embolism on the basis of the  appearances, and several diagnostic algorithms have been developed for the interpretation and reporting of
  lung scans.274.275.281.282. and 283. These algorithms express the likelihood of embolism on a verbal probability scale as low, intermediate, and high. The probability or likelihood that an abnormal scan is due to pulmonary embolism is the positive predictive value of the test, defined as the ratio, true positives: all positives. It is highly dependent on the prevalence of the disease in the patient population studied. Before discussion of these algorithms, it should be emphasized that they generally ignore the pretest clinical likelihood of pulmonary embolism. 284 At the risk of oversimplification the literature can be summarized as follows: an abnormal
  scan indicating a low probability for pulmonary embolism is one in which the individual perfusion defects are (1) smaller than 25% of a segment (that is, subsegmental), regardless of the chest radiographic and ventilation scan appearances; or (2) are matched on the ventilation scan or are accompanied by larger chest radiographic abnormalities. Prominent, nonpulmonary intrathoracic structures, such as an enlarged hilum, cardiac chamber, and aorta, are described as giving matched defects, but they are readily identifiable from the chest radiograph and should not be described as ‘defects’.
appearances, and several diagnostic algorithms have been developed for the interpretation and reporting of lung scans.274.275.281.282. and 283. These algorithms express the likelihood of embolism on a verbal probability scale as low, intermediate, and high. The probability or likelihood that an abnormal scan is due to pulmonary embolism is the positive predictive value of the test, defined as the ratio, true positives: all positives. It is highly dependent on the prevalence of the disease in the patient population studied. Before discussion of these algorithms, it should be emphasized that they generally ignore the pretest clinical likelihood of pulmonary embolism. 284 At the risk of oversimplification the literature can be summarized as follows: an abnormal scan indicating a low probability for pulmonary embolism is one in which the individual perfusion defects are (1) smaller than 25% of a segment (that is, subsegmental), regardless of the chest radiographic and ventilation scan appearances; or (2) are matched on the ventilation scan or are accompanied by larger chest radiographic abnormalities. Prominent, nonpulmonary intrathoracic structures, such as an enlarged hilum, cardiac chamber, and aorta, are described as giving matched defects, but they are readily identifiable from the chest radiograph and should not be described as ‘defects’.The least problematic  scan is one indicating a high probability of recent pulmonary embolism, in which there are two or more perfusion defects, not matched by corresponding ventilation defects or chest radiographic abnormalities, including at least one of segmental or larger size (Fig. 7.31). In the appropriate clinical setting, a high-probability
  scan indicates a probability of pulmonary embolism exceeding 90%.
scan is one indicating a high probability of recent pulmonary embolism, in which there are two or more perfusion defects, not matched by corresponding ventilation defects or chest radiographic abnormalities, including at least one of segmental or larger size (Fig. 7.31). In the appropriate clinical setting, a high-probability scan indicates a probability of pulmonary embolism exceeding 90%.Most problematic is the intermediate-probability  scan, sometimes described as an indeterminate scan, which does not fit into the low- or high-probability categories. In essence, the probability of pulmonary embolism in patients with intermediate-probability scans is likely to be similar to what it was before the scan, and the patient will need further investigation. In general,
  scans indicating an intermediate probability for recent pulmonary embolism have been classified in the literature as those (1) with perfusion defects that, although matched, correspond in size and shape to an area of consolidation on the chest radiograph (and may therefore represent infarction – so-called triple match), or (2) with perfusion defects in areas of severe obstructive lung disease, pulmonary edema, or pleural effusion. Good-quality ventilation imaging has the potential to reduce the number of scans placed in the intermediate category.
scan, sometimes described as an indeterminate scan, which does not fit into the low- or high-probability categories. In essence, the probability of pulmonary embolism in patients with intermediate-probability scans is likely to be similar to what it was before the scan, and the patient will need further investigation. In general, scans indicating an intermediate probability for recent pulmonary embolism have been classified in the literature as those (1) with perfusion defects that, although matched, correspond in size and shape to an area of consolidation on the chest radiograph (and may therefore represent infarction – so-called triple match), or (2) with perfusion defects in areas of severe obstructive lung disease, pulmonary edema, or pleural effusion. Good-quality ventilation imaging has the potential to reduce the number of scans placed in the intermediate category.The probability-stratification approach, with its specified criteria, is exclusive to the  scan performed for suspected pulmonary embolism, and this has probably grown out of the philosophy that the only reason to perform
  scintigraphy is to diagnose pulmonary embolism. Several early reports comparing scintigraphy with pulmonary angiography failed to take into account the clinical and imaging evidence of DVT and the pretest likelihood of the disease. This last consideration was highlighted by the first PIOPED study, 274 which showed that the incidence of abnormal pulmonary angiography was greater, in all probability categories, when the prescan clinical likelihood of pulmonary embolism was high compared with when it was it low. This means that the
  scan can be regarded as a screening test which increases the pretest likelihood of embolism, decreases it, or leaves it unchanged. Thus a patient without risk factors for pulmonary embolism who presents with sudden onset of pleuritic chest pain and is deemed to have a low clinical likelihood of embolism, and who then has a
  scan indicating a low probability of embolism on scintigraphic criteria, can be deemed to have a post-
 scan likelihood which is even lower and which for clinical purposes rules out the need for anticoagulation. Conversely, a patient with a risk factor for pulmonary embolism, such as recent surgery or a history of previous DVT, who then has a low-probability
  scan retains an overall likelihood of embolism of 10–20%, or even higher. 285
scan performed for suspected pulmonary embolism, and this has probably grown out of the philosophy that the only reason to perform scintigraphy is to diagnose pulmonary embolism. Several early reports comparing scintigraphy with pulmonary angiography failed to take into account the clinical and imaging evidence of DVT and the pretest likelihood of the disease. This last consideration was highlighted by the first PIOPED study, 274 which showed that the incidence of abnormal pulmonary angiography was greater, in all probability categories, when the prescan clinical likelihood of pulmonary embolism was high compared with when it was it low. This means that the scan can be regarded as a screening test which increases the pretest likelihood of embolism, decreases it, or leaves it unchanged. Thus a patient without risk factors for pulmonary embolism who presents with sudden onset of pleuritic chest pain and is deemed to have a low clinical likelihood of embolism, and who then has a scan indicating a low probability of embolism on scintigraphic criteria, can be deemed to have a post- scan likelihood which is even lower and which for clinical purposes rules out the need for anticoagulation. Conversely, a patient with a risk factor for pulmonary embolism, such as recent surgery or a history of previous DVT, who then has a low-probability scan retains an overall likelihood of embolism of 10–20%, or even higher. 285In the context of suspected pulmonary embolism, an important function of the chest radiograph, apart from providing anatomic landmarks, is to avoid missing pulmonary infarction. A matched defect without a corresponding radiographic abnormality has a low probability for pulmonary embolism: the appearance of a corresponding radiographic abnormality moves the  scan into the intermediate category because it increases the likelihood of infarction. Partial mismatching typical of infarction with an appropriate radiographic abnormality further increases the likelihood. An important question that remains unanswered is how often an infarct can give a completely matched defect.
scan into the intermediate category because it increases the likelihood of infarction. Partial mismatching typical of infarction with an appropriate radiographic abnormality further increases the likelihood. An important question that remains unanswered is how often an infarct can give a completely matched defect.Rather than listing the criteria for categorizing a lung scan on a verbal probability scale, it may be more useful to identify those features on the  lung scan which have been most contentious and cause difficulty in diagnosing pulmonary embolism. These are (1) the solitary unmatched perfusion defect, (2) symmetric segmental unmatched perfusion defects, (3) the matched perfusion defect with a similar-sized corresponding radiographic opacity, (4) multiple unmatched but subsegmental perfusion defects, and (5) unmatched segmental perfusion defects not clearly seen on any projection to extend to the periphery of the lung (the so-called stripe sign).286. and 287. In this setting it is important to appreciate that the unmatched perfusion defect points to pulmonary vascular disease and not specifically to embolic disease. There are several diseases other than pulmonary embolism in which the
  scan may show mismatched perfusion abnormalities. A mismatched defect (Box 7.6) indicates pulmonary vascular disease, which usually, although not always, is due to pulmonary embolism.
lung scan which have been most contentious and cause difficulty in diagnosing pulmonary embolism. These are (1) the solitary unmatched perfusion defect, (2) symmetric segmental unmatched perfusion defects, (3) the matched perfusion defect with a similar-sized corresponding radiographic opacity, (4) multiple unmatched but subsegmental perfusion defects, and (5) unmatched segmental perfusion defects not clearly seen on any projection to extend to the periphery of the lung (the so-called stripe sign).286. and 287. In this setting it is important to appreciate that the unmatched perfusion defect points to pulmonary vascular disease and not specifically to embolic disease. There are several diseases other than pulmonary embolism in which the scan may show mismatched perfusion abnormalities. A mismatched defect (Box 7.6) indicates pulmonary vascular disease, which usually, although not always, is due to pulmonary embolism.Box 7.6

• Pulmonary embolism
– Acute
– Chronic
• Pulmonary thrombosis
• Idiopathic pulmonary arterial hypertension
• Pulmonary venoocclusive disease
• Vasculitis of medium-sized arteries
• Ventilated bullous disease
• External compression of pulmonary artery
– Lung cancer
– Lymphoma
• Focal obliteration of pulmonary capillaries
– Fibrosing lung disease
– Emphysema
– Irradiation
• Congenital pulmonary artery hypoplasia
• Sequestrated segment
– Artifactual (may be posture-dependent)
– Unstable ventilation
– Related to pleural effusion
• Upper lobe blood diversion (in heart disease)
• Previous vascular surgery with creation of intravascular shunts
• Intraluminal obstruction (e.g. catheters, Dirofilaria immitis)
• Pulmonary arteriovenous malformations (especially following therapeutic embolization)
Important causes include: carcinoma of the bronchus, which often gives rise to the characteristic finding of a completely nonperfused lung or lobe with a normally perfused opposite lung and normal ventilation (Fig. 7.33); bullae, which occasionally ventilate288 but are usually evident on the chest radiograph; pulmonary vasculitis involving medium-sized arteries, which have radiographic features suggestive of pulmonary infarction; and idiopathic pulmonary fibrosis, which usually involves the lower zones symmetrically289 (Fig. 7.34). In children, in whom pulmonary embolism is rarely diagnosed, unmatched perfusion defects are more likely to be due to sequestered segments, congenital anomalies of the pulmonary artery, and previous surgery for congenital cardiovascular anomalies. Caution is required in this last setting with regard to the venous site used for injecting the microparticles.
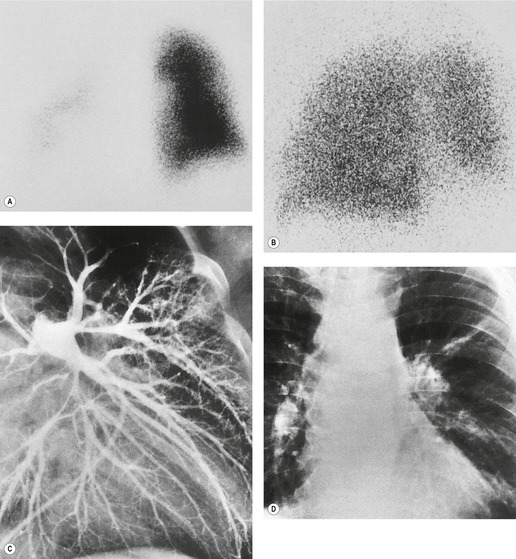
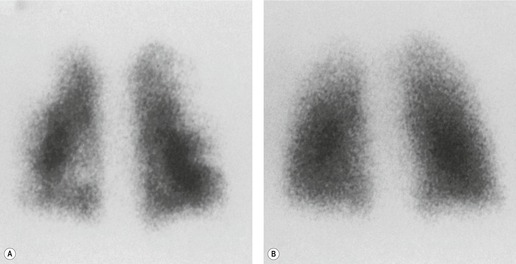

Although the role of scintigraphy as a first line test for suspected pulmonary embolism has diminished over the years it remains an important diagnostic option in specific circumstances, for example the investigation of pulmonary embolism during pregnancy (when a low-dose technique is used). The attraction of perfusion scintigraphy in this situation is its high negative predictive value (the frequency of indeterminate scans and nondiagnostic scans, because of concomitant lung disease, is relatively low in pregnant women). 290 The radiation dose to the fetus (~0.15 mGy) is higher than that delivered by CTPA (~0.03 mGy), but the radiation dose to the mother’s breasts from CTPA is a major consideration (35 mGy per breast); however, there is currently no clear consensus as to whether scintigraphy or CTPA should be used when imaging is required in pregnant women with suspected pulmonary embolism.199.215.216. and 217.
Pulmonary angiography
Pulmonary angiography was, once upon a time, the mainstay of demonstrating emboli in the pulmonary arterial tree. Recent guidelines make only passing reference to angiography (usually digital subtraction angiography) as an option of last resort in establishing the diagnosis of pulmonary embolism, 199 or when interventional thrombolysis is contemplated. 109 Most studies confirm the low morbidity and negligible mortality of pulmonary angiography, particularly when it is used in carefully selected patients.291.292. and 293. Pulmonary hypertension is the major predisposing factor for increased mortality. 294 Of the nonfatal complications, arrhythmias are the most common, followed by cardiac perforation. Cardiac perforation, although it may lead to pericardial tamponade, frequently resolves without incident, particularly if there is no associated myocardial intravasation. Such nonfatal complications occur in 1–5% of patients.291. and 294. Elderly patients are more at risk of renal failure but otherwise have the same low complication rate as younger patients. 295
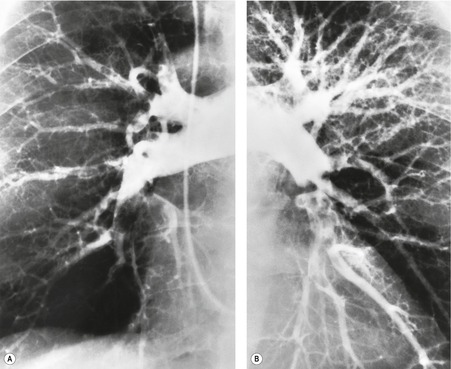
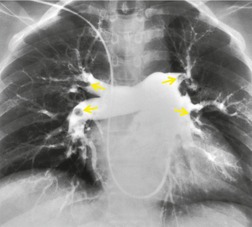
• Intraluminal filling defects within the opacified arterial tree. These filling defects are caused by opacified blood flowing around the thrombus. Sometimes, the contrast medium flows past the thrombus to opacify the distal vessels. At other times only the trailing edge of a thrombus impacted in a downstream arterial branch is seen.
• Complete occlusion of a pulmonary artery branch. Occlusion is a nonspecific sign and may be seen in a variety of conditions, including organized thrombus from a previous embolus, in situ thrombosis, occlusion from direct involvement by a neoplasm, or a variety of inflammatory diseases.
Another arteriographic sign of pulmonary embolism is a focal reduction or delay in the opacification of the pulmonary arterial branches, 298 equivalent to the perfusion defect seen at perfusion scintigraphy. However, reduced perfusion, regardless of how it is demonstrated, is a less specific sign than an intraluminal filling defect or an abrupt occlusion of a vessel. It will be seen in any condition that destroys lung parenchyma, notably emphysema or pulmonary fibrosis, and in any condition that leads to focal hypoxic vasoconstriction. Pulmonary thromboemboli usually lyse following the embolic episode but some do not lyse completely. They may leave residual webs, which can be seen angiographically,299. and 300. or they may form permanent occlusions.
Despite its accuracy and apparent safety, pulmonary angiography is no longer widely enough practiced301 to be considered a cost-effective first-line investigation in suspected pulmonary embolism. 302 A further consideration is the radiation dose of digital subtraction angiography which is up to five times higher than that delivered by CTPA. 303 In the increasingly unlikely event of CTPA being unavailable, pulmonary angiography may be indicated when:

• The positive identification of subsegmental emboli is regarded as vital – usually in patients with severely limited cardiopulmonary reserve
• In situ thrombolysis of central pulmonary emboli is contemplated.
As with other tests pulmonary angiography is prone to both false-positive and false-negative interpretations. Nevertheless, it appears that life-threatening emboli are very infrequently missed. 304 Furthermore, small subsegmental emboli can be detected, albeit with less reliability.305.306. and 307. Novelline and associates, 308 Cheely and co-workers, 309 and the original PIOPED study274. and 310. followed large groups of patients clinically suspected of having pulmonary embolism who had normal pulmonary angiograms. Had significant pulmonary emboli been overlooked, it seems likely that some of these patients would have had further embolic episodes in the ensuing years. In fact, none of Novelline’s 167 patients did (and none was receiving anticoagulant therapy); in three cases small incidental emboli were found in patients dying from other causes. 308 In Cheely’s series, four of 144 patients with negative angiograms subsequently developed emboli, but in none were they the cause of death. 309 In the PIOPED study, surveillance of 675 patients with negative angiograms revealed four (0.06%) patients with pulmonary embolism.274. and 310.
TUMOR EMBOLISM
Hemodynamically significant tumor emboli are rare311. and 312. but pulmonary hypertension can occasionally be the presenting feature of neoplastic disease.313. and 314. Tumor cells can involve the pulmonary vasculature in a variety of ways: (1) large proximal emboli, (2) pure microvascular involvement, (3) dissemination through the lymphatic vessels (lymphangitic carcinomatosa), and (4) a combination of these modes.315. and 316. Microscopic tumor emboli occlude small pulmonary vessels and can give rise to severe dyspnea, which develops rapidly over several weeks, 317 or sometimes days.318. and 319. Other symptoms include pleuritic chest pain, fatigue, weight loss, cough, hemoptysis, and syncope. The mortality of the condition is very high and antemortem diagnosis is rare. 320
On physical examination most patients show signs of right ventricular overload, but just as with pulmonary thromboembolism there may be relatively few respiratory findings. The condition differs from widespread, bloodborne metastases in that a ‘regular’ metastasis represents tumor that has invaded the vessel wall and acquired its own blood supply, whereas tumor emboli are clumps of cells that are lodged within the lumens of pulmonary arteries and have not yet invaded the vessel wall, but are acting as obstructing emboli similar to thromboemboli. Patients are hypoxemic, have increased alveolar–arterial oxygen gradients, and have pulmonary arterial hypertension, sometimes severe.321. and 322. Chan et al. 311 in their extensive review of the literature on the subject, found a wide distribution of types of malignancy. The commonest primary tumors associated with tumor embolism are adenocarcinoma, including bronchioloalveolar cell carcinoma, 322 breast cancer, 321 and gastric323 and prostate324 cancers. Many other neoplasms have been reported (usually single case reports), the most frequent types likely reflecting their higher prevalence in the population. 320 The diagnosis of pulmonary endovascular choriocarcinoma325 in young female patients is important because it is potentially curable with chemotherapy. 326
The chest radiograph is usually normal and signs of pulmonary arterial hypertension are rarely recognizable. A few patients show nonspecific pulmonary shadows, possibly infarcts. Scintigraphy lung scans show multiple, small, peripheral, subsegmental perfusion defects with a normal ventilation scan. Dilated and beaded pulmonary arteries have been described on CT, 327 reflecting distension by intravascular tumor. Occasionally pulmonary infarcts may be the only abnormality on CT. 328
An unusual pathologic response to microscopic tumor emboli is thrombotic microangiopathy,329. and 330. in which minute tumor emboli cause dramatic fibrocellular proliferation of the intima with resulting thrombosis and luminal obliteration. An undisclosed gastric cancer is one of the commonest sources of tumor microemboli.331. and 332. The HRCT correlate is prominence of otherwise inconspicuous small peripheral pulmonary arteries, resembling a tree-in-bud pattern333 (Fig. 7.37).
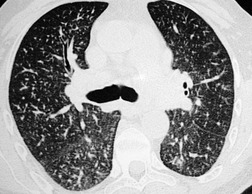 |
| Fig. 7.37 (Courtesy of Dr. T Franquet, Barcelona, Spain.) |
PULMONARY ARTERIAL HYPERTENSION
Pressure in the pulmonary arteries is a function of blood flow and the resistance across the pulmonary vascular system, the resistance to flow depending predominantly on the cross-sectional area of the perfused vascular bed. The pulmonary vascular bed has a much lower resistance than the systemic circuit and can respond to increasing flow by opening up additional vascular channels. Pulmonary arterial hypertension occurs when the flow increases to such an extent that the available extra channels are saturated, or because of vasoconstriction or structural change in the small pulmonary vessels. It is variably defined as pulmonary artery pressures above a mean of 25 mmHg at rest or above the mean value of 30 mmHg on exercise.
Since the classification of the various causes and associations of pulmonary arterial hypertension was proposed at a World Health Organization (WHO) symposium in 1998, 334 increased understanding of the pathogenesis and clinical management of pulmonary arterial hypertension has led to further refinement culminating in the so-called Evian classification, 335 which was subsequently modified by Simonneau et al. 336 at the Third World Symposium on Pulmonary Arterial Hypertension held in Venice, Italy, in 2003. In this last iteration the term primary pulmonary hypertension was replaced with idiopathic pulmonary hypertension, but the new Venice classification kept the five categories of the Evian classification (Box 7.7). In concert with the clinically based Venice classification, Pietra et al. 337 have revisited the complex interrelationships between the subtypes of pathologic lesions that are encountered in various forms of pulmonary hypertension.
Box 7.7
Classification of pulmonary hypertension, after Simoneau et al. (Third World Symposium on Pulmonary Arterial Hypertension, Venice, Italy, 2003) 336
1. Pulmonary arterial hypertension (PAH)
• Idiopathic (IPAH)
• Familial (FPAH)
• Associated with (APAH):
– Collagen vascular disease
– Congenital systemic-to-pulmonary shunts
– Portal hypertension
– Human immunodeficiency virus (HIV) infection
– Drugs and toxins
– Other: thyroid disorders, glycogen storage disease, Gaucher disease, hereditary hemorrhagic telangiectasia, hemoglobinopathies, myeloproliferative disorders, splenectomy
• Associated with significant venous or capillary involvement
– Pulmonary venoocclusive disease (PVOD)
– Pulmonary capillary hemangiomatosis (PCH)
• Persistent pulmonary hypertension of the newborn
2. Pulmonary hypertension with left heart disease
• Left-sided atrial or ventricular heart disease
• Left-sided valvular heart disease
3. Pulmonary hypertension associated with lung diseases and/or hypoxemia
• Chronic obstructive pulmonary disease
• Interstitial lung disease
• Sleep-disordered breathing
• Alveolar hypoventilation disorders
• Chronic exposure to high altitude
• Developmental abnormalities
4. Pulmonary hypertension due to chronic thrombotic and/or embolic disease
• Thromboembolic obstruction of proximal pulmonary arteries
• Thromboembolic obstruction of distal pulmonary arteries
• Nonthrombotic pulmonary embolism (tumor, parasites, foreign material)
5. Miscellaneous: sarcoidosis, histiocytosis X, lymphangioleiomyomatosis, compression of pulmonary vessels (adenopathy, tumor, fibrosing mediastinitis)
Although the clinical presentation and treatment for advanced pulmonary hypertension is similar whatever the pathogenesis, there are risk factors, of differing certainty, which can be screened for in any individual found to have pulmonary hypertension (Box 7.8).
Box 7.8
Drugs and toxins
• Definite
– E.g. toxic rapeseed oil, aminorex, fenfluramine, dexfenfluramine
• Very likely
– E.g. amphetamines, l-tryptophan
• Possible
– E.g. meta-amphetamines, cocaine, some chemotherapies
• Unlikely
– E.g. antidepressants, cigarette smoking, estrogen therapy oral contraceptives
Demographic and medical conditions
• Definite
– Female gender
• Possible
– Pregnancy, systemic hypertension
• Unlikely
– Obesity
Diseases
• Definite
– HIV infection
• Very likely
– Portal hypertension/liver disease
– Collagen vascular diseases
– Congenital systemic – pulmonary-cardiac shunts
• Possible
– Thyroid disease
(From Fishman AP. Clinical classification of pulmonary hypertension. Clin Chest Med 2001;22:385–391, vii. Copyright Elsevier.)
Radiographic signs of pulmonary arterial hypertension
The imaging features of pulmonary arterial hypertension are discussed before the various causes are described because the basic imaging signs are the same regardless of the cause of the hypertension. The well-known radiographic signs of pulmonary hypertension are cardiac enlargement (caused by right ventricular enlargement), enlargement of the central pulmonary arteries, and rapid tapering of the vessels as they proceed distally (Fig. 7.38). The distal vessels may be large, normal, or reduced in caliber. The important point is the disparity in the relative size of the central and distal vessels. The terms ‘central’ and ‘distal’ are inevitably vague because there is no precise anatomic definition of central and distal (peripheral) vessels, but the term ‘central arteries’ refers to the main pulmonary artery and its branches approximately down to segmental level. The term ‘distal vessels’ refers to vessels beyond the segmental level. The criteria of central vessel dilatation on plain chest radiographs are, with one exception, also poorly defined. On a posteroanterior chest radiograph the main pulmonary artery forms the border for less than half of its circumference, and this border represents a portion of the vessel that is traveling obliquely upward and backward. Thus, diagnosing dilatation based on increased prominence or convexity of the main pulmonary artery segment of the cardiac contour is at best a crude measurement. One well-documented measurement of the size of the pulmonary arterial tree on plain films is that of the right descending pulmonary artery. 338 The upper limit of normal for transverse diameter at the midpoint of this vessel is 16–17 mm. Thus, measurements of 17 mm or greater are taken to indicate dilatation (Fig. 7.39).
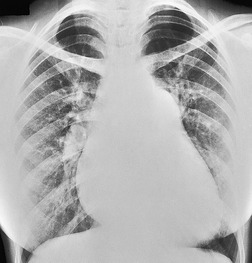
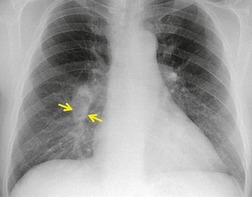
The degree of dilatation of the central pulmonary arteries varies considerably, not only among the various entities that cause pulmonary arterial hypertension, but also from patient to patient with the same condition. Therefore, although the radiographic changes are reasonably specific, they are not sensitive nor do they correlate well with the severity of the hypertension. Indeed, severe pulmonary arterial hypertension can be present in patients with a normal-appearing chest radiograph. More precise measurement of the main pulmonary artery is possible with CT, likely accounting for the reasonable correlation between the calculated cross-sectional area of the main pulmonary artery, adjusted for body surface area and mean pulmonary artery pressure. 339 Nevertheless, the caveat that occasionally healthy individuals have idiopathic dilatation of their pulmonary artery needs to be remembered. 340 Another study has confirmed that there is a reasonable correlation between pulmonary artery pressure and CT measures of various parts of the proximal pulmonary arterial tree. 341 A mean pulmonary artery diameter (measured at its widest point within 3 cm of its bifurcation) of 29 mm has been shown to have a positive predictive value of 0.97 (positive likelihood ratio of 7.91) for predicting pulmonary arterial hypertension (Fig. 7.40). 342 In another CT study in which the main pulmonary artery was measured close to its bifurcation, the mean diameter in 100 normal individuals was found to be 2.72 cm (SD 0.3 cm) compared with 3.47 cm (SD 0.3 cm) in 12 patients with pulmonary arterial hypertension of greater than 20 mmHg (mean pulmonary artery pressure). 343 The authors proposed that a main pulmonary artery diameter of greater than 3.32 cm is highly suggestive of pulmonary arterial hypertension (specificity 95%). However, this value is associated with a relatively low sensitivity (58%). 343 The relationship between main pulmonary artery diameter and pressure is not entirely predictable: in the latter study there was no linear correlation between the degree of pulmonary arterial hypertension and main pulmonary artery diameter. 342 Despite the complexity underlying this relationship, a useful empirical rule reported by Ng et al. 344 is that pulmonary arterial hypertension is likely when the diameter of the main pulmonary artery on CT exceeds that of the adjacent ascending aorta (positive predictive value 93%) (Fig. 7.41). However, the negative predictive value of this observation is relatively low (44%) and a nondilated main pulmonary artery, by reference to the aorta, does not necessarily exclude pulmonary arterial hypertension (see Fig. 7.40 in which the diameter of the ascending aorta and pulmonary artery are comparable). Dilatation of the proximal pulmonary arteries in pulmonary arterial hypertension may also be reflected by dilatation of the segmental arteries (such that the artery-to-accompanying bronchus ratio is >1:1 in three or four lobes); this sign has a high specificity, 342 but is unlikely to be present in the absence of a conspicuously dilated main pulmonary artery.
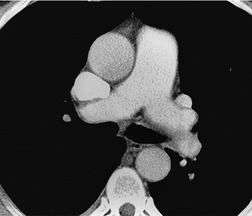
Just over half (53%) of patients with a mean pulmonary artery pressure of more than 35 mm, that is severe pulmonary arterial hypertension, have evidence of pericardial thickening or effusion on CT345 (Figs 7.41 and 7.42), whatever the cause of pulmonary hypertension (the same phenomenon has been reported in patients with systemic sclerosis-related pulmonary hypertension). 346 The pathophysiologic mechanism is unclear. Prolonged and severe arterial hypertension ultimately impacts on the right ventricle and this is manifested as dilatation of the ventricular cavity or straightening of the interventricular septum347 (Fig. 7.43). Reflux of contrast into the inferior vena cava and hepatic veins on first-pass contrast enhanced CT (e.g. CTPA) is a specific but indirect sign of pulmonary arterial hypertension348 (Fig. 7.44).
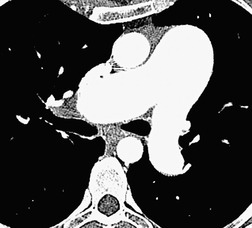
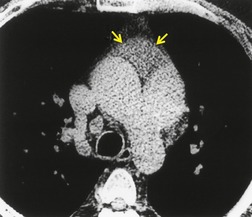
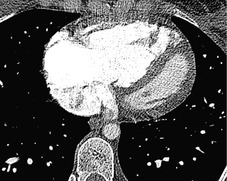
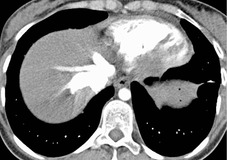
MRI measures of pulmonary artery diameter, flow characteristics, and other variables have been reported in patients with pulmonary artery hypertension.349.350.351.352.353. and 354. In a study that examined the ratio of the diameter of the main pulmonary artery to the diameter of the mid-descending thoracic aorta, Murray et al. 352 showed a significantly higher ratio in patients with pulmonary arterial hypertension. Pulmonary artery distensibility, as judged by changes in pulmonary artery caliber on MRI, is markedly diminished in patients with pulmonary arterial hypertension.349. and 353. Velocity mapping with cine MRI shows inhomogeneity of flow in the main pulmonary arteries in pulmonary hypertension. 350 Despite MR techniques showing perturbation in pulmonary hemodynamcs, correlation between various MR measurements and pulmonary artery pressures, as judged by echocardiography or right heart catheter measurements, remains elusive. 353
Prolonged severe pulmonary arterial hypertension may lead to atheroma formation in the central pulmonary arteries or their branches (atheroma is not seen in the pulmonary circuit with normal pulmonary artery pressures). The atheroma may be seen as curvilinear calcification identical to that seen with atheromatous change in the aorta and its branches (Fig. 7.45). In practice, atheromatous calcification of the pulmonary artery is very rare indeed and is seen only in Eisenmenger syndrome and in a few patients with prolonged pulmonary hypertension. Dissection of the pulmonary artery is even rarer and may be recognized on echocardiography, contrast-enhanced CT, or, as described in a single case report, on MRI. 355
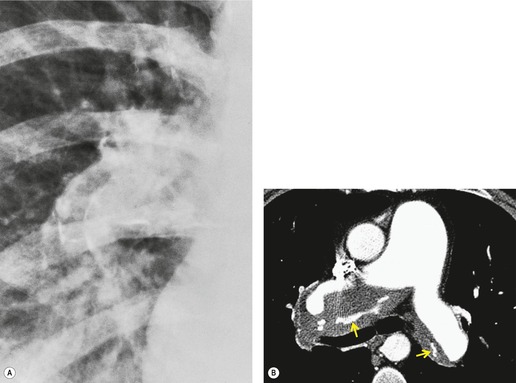
Subtle parenchymal changes, seen on HRCT, are sometimes seen in patients with pulmonary hypertension, particularly in conditions primarily affecting the small pulmonary vessels; 356 abnormalities include mosaic attenuation pattern, a nodular or micronodular pattern, and thickening of the interlobular septa. These signs are more prevalent in some causes of pulmonary hypertension than in others and are considered in more detail in the relevant sections that follow.
Pulmonary arterial hypertension – idiopathic and associated disorders
Formerly termed ‘primary pulmonary hypertension’, idiopathic pulmonary arterial hypertension (IPAH) refers to a group of patients who have pulmonary arterial hypertension with no clinically discernible cause, a normal pulmonary arterial wedge pressure, and no evidence of a left-to-right shunt. Pulmonary hypertension at rest reflects extensive obliteration (>70%) of the pulmonary vascular bed, and in this sense clinical presentation occurs comparatively late in the development of the disease. There is a striking female preponderance in IPAH; the genetic predisposition to IPAH is not fully understood, but mutations in the gene encoding the bone morphogenetic protein receptor type II (BMPR2) occur in well over half of patients with familial pulmonary hypertension and about a quarter of individuals with noninherited IPAH.357. and 358.
Prolonged vasoconstriction is believed to be the first stage of plexogenic pulmonary arteriopathy; the next stage is structural change in the arterial wall. On pathologic study,337. and 359. the initial structural manifestations are medial hypertrophy of the muscular pulmonary arteries and muscularization of the arterioles. This is followed by concentric laminar fibrosis in a so-called onion skin configuration. The walls of the muscular pulmonary arteries occasionally show arteritis with fibrinoid necrosis. Plexiform lesions are a striking and important finding, consisting of a network of capillarylike channels within a dilated segment of a muscular pulmonary artery. The lesions are seen in patients with severe pulmonary arterial hypertension. They are not a feature of pulmonary venoocclusive disease or in recurrent pulmonary thromboemboli.
Aminorex fumarate, and related appetite suppressants, may produce an identical picture to IPAH in some subjects who use the drug, 360 as does the ‘bush tea’ of native West Indians, in which Crotolaria fulva is believed to be responsible. Clinical and pathologic features identical to those encountered in IPAH have been reported in patients with the toxic oil syndrome. 361
Most cases of IPAH are adults or older children, but cases have been described in young children and infants. Persistent pulmonary hypertension of the newborn (PPHN) is multifactorial but reflects a failure of transition from fetal to neonatal circulation and is manifest as hypoxemic respiratory failure; 362 occasionally, rather than PPHN resulting from failure of the pulmonary vasculature to ‘relax’ at birth, it is the consequence of morphologic dysplasia and misalignment of small vessels, so-called alveolar capillary dysplasia. 363 In a large series of 156 adult patients with IPAH the average age was 33 (range 16–69) and the female-to-male ratio was 4:1. 364 The patients complain of weakness, dyspnea, and chest pain. Arrhythmias are common in the later stages. Physical examination reveals all the expected signs of right ventricular pressure overload and elevated systemic venous pressure.
The radiographic features of pulmonary hypertension described earlier (Figs 7.38 and 7.39; Fig. 7.46) are dilatation of the main pulmonary artery and central arteries with rapid tapering to oligemic peripheral lung. The peripheral lung vessels are narrow and inconspicuous. The average width of the right descending pulmonary artery was twice the diameter of that in normal control subjects in one review of 54 patients with primary pulmonary hypertension, 365 but as with all types of pulmonary hypertension, the plain chest radiographs may show relatively little dilatation of central vessels (Fig. 7.47).
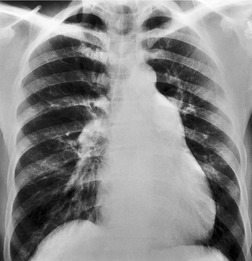
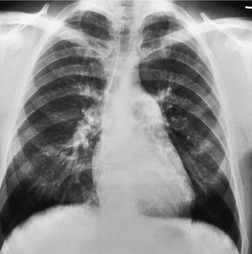
 scintigraphy is not a useful diagnostic tool for IPAH; it may be normal or show multiple small unmatched perfusion defects throughout both lungs.366.367. and 368. The appearances are, in other words, quite different from those in chronic thromboembolism. At cardiac catheterization pulmonary vascular resistance is very high. The pulmonary capillary wedge pressure, if it can be measured, is normal, and the left-sided pressures are also normal. Right-to-left shunting through a patent foramen ovale may be present.
The HRCT literature on the effects of IPAH on the appearances of the lung parenchyma is limited, and this reflects both the relative rarity of the condition and the nonspecific and subtle changes that occur (Box 7.9). While the mosaic attenuation pattern on HRCT is an expected feature of chronic thromboembolic disease, 369 this is less prevalent and conspicuous in IPAH. However, in a study of 64 patients with pulmonary artery hypertension of various causes, only four had ‘primary pulmonary hypertension’ but all of these had some regional inhomogeneity of the attenuation of lung parenchyma (13/15 patients with thromboembolic disease had a frank mosaic attenuation pattern). 370 Whether the distribution of the pathologic process in IPAH (relatively uniform involvement of the small muscular pulmonary arteries, in comparison with patchy thrombotic occlusion of larger generations of pulmonary arteries in thromboembolic disease) is responsible for different HRCT manifestations; for example, loss of the normal gravity-dependent density gradient in nonthromboembolic pulmonary hypertension371 rather than the obvious mosaic attenuation pattern seen in chronic thromboembolic pulmonary hypertension372 is uncertain. In some patients with advanced pulmonary hypertension, there is scintigraphic evidence of reversed mismatching, that is pulmonary perfusion of areas of lung showing little or no ventilation; a CT study has shown that such areas show normal, or engorged, pulmonary vasculature, with areas of increased parenchymal attenuation which show ventilatory defects on scintigraphy. 373
Box 7.9
• Dilatation of proximal and segmental pulmonary arteries
• Small pericardial effusion (usually severe pulmonary hypertension, mean pressure >35 mmHg)
• Subtle mosaic attenuation pattern (may be absent)
• Small poorly defined centrilobular nodules (rare, and may signify another condition)
• Signs of right and subsequently left ventricular failure in late stage disease
Inconspicuous small, poorly defined, low attenuation, centrilobular nodules (similar to those seen in subacute hypersensitivity pneumonitis) are an uncommon HRCT feature (Fig. 7.48) in patients with pulmonary arterial hypertension, usually severe, of various causes.374. and 375. The histologic correlate of these nodules seems to be variable and includes plexogenic arterial lesions and cholesterol granulomata, the latter thought to be the consequence of macrophage ingestion of red blood cells following repeated microhemorrhage. The presence of a widespread nodular pattern on HRCT clearly raises the possibility of a secondary (diffuse parenchymal) cause for pulmonary hypertension; for example, conditions characterized by a nodular pattern with a propensity to cause pulmonary hypertension, such as Langerhans cell histiocytosis376 (Fig. 7.49), sarcoidosis, 377 or pulmonary capillary hemangiomatosis378 (Box 7.9).
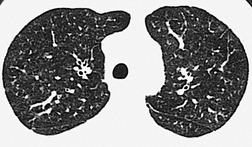
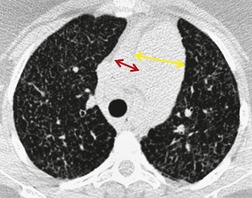
Pulmonary microvasculopathy
Because they are potent causes of pulmonary hypertension, and are of unknown cause, two rare conditions, pulmonary capillary hemangiomatosis and pulmonary venoocclusive disease, are considered within the ambit of IPAH.336. and 337. At a pathologic level these two rare diseases share several features, such that some authorities suggest that there is continuum between them; 379 nevertheless, there are sufficient differences to consider them as separate entities.
Pulmonary capillary hemangiomatosis
In its pure form pulmonary capillary hemangiomatosis is characterized by widespread abnormal proliferation of thin-walled capillary channels in the pulmonary interstitium; there is often accompanying obstruction of small venules, resulting in pulmonary hypertension. 380 Most patients are in the age range of 20–40 years and present with slowly progressive dyspnea caused by pulmonary hypertension; the prognosis is poor. The proliferation of fragile capillary-sized vessels, prone to bleed, is responsible for the CT picture of poorly defined small nodular opacities, thickened interlobular septa (minor feature), and areas of ground-glass opacification378.381.382. and 383. (Fig. 7.50). The distinction between capillary hemangiomatosis and idiopathic pulmonary arterial hypertension is important because the treatment of patients with a post-capillary cause of pulmonary hypertension with prostaglandin vasodilators can precipitate fatal pulmonary edema.
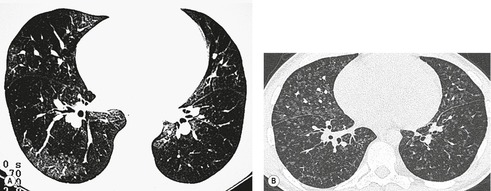 |
| Fig. 7.50 (Courtesy of Dr. L Mitchell, Newcastle upon Tyne, UK.) B, Another patient with a different HRCT pattern – poorly defined nodules – of capillary hemangiomatosis. |
Pulmonary venoocclusive disease
Pulmonary venoocclusive disease is a very rare disorder, and its cause is unknown.385. and 386. Occasionally the disease may be hereditary. It may be more prevalent in patients with connective tissue disease-related pulmonary hypertension. 387 The pulmonary veins thrombose and develop intimal fibrosis. Occlusion of the pulmonary veins leads to pulmonary venous and capillary congestion, pulmonary edema, rarely acute pulmonary hemorrhage, 388 alveolar hemosiderin deposits, and pulmonary arterial hypertension that may be very severe. 389 Thrombi, which may be recent, organized, or recanalized, may be seen in the affected vessels, but plexiform lesions are absent. The pulmonary arteriolar wedge pressure is usually normal – and if abnormal, is only mildly elevated;390.391. and 392. one reason why pulmonary venoocclusive disease has historically been included in the category of primary pulmonary hypertension. The outcome is almost invariably fatal, and in most cases the only curative treatment is lung transplantation. 393 Steroid therapy seems to be ineffective. There are a few reports of individual patients showing sustained response to vasodilators394 and specifically nifedipine. 395 However, prostacyclin therapy has been associated with acute and fatal pulmonary edema in one patient with venoocclusive disease, 396 similar to reports of adverse response to prostaglandin treatment in patients with pulmonary capillary hemangiomatosis.397. and 398.
The chest radiographic appearances are those of pulmonary arterial hypertension, but usually accompanied by signs of pulmonary edema. Both alveolar edema and interstitial edema are commonly seen in this condition (Fig. 7.51). In one review of the radiographic features of 26 cases, 20 patients showed pulmonary edema. 390 The left atrium is not enlarged, an important point of difference from mitral valve disease, left atrial myxoma, and cor triatriatum. There is usually no evidence of upper zone blood diversion.
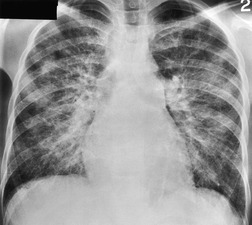
The CT features of venoocclusive disease mirror the radiographic abnormalities: ground-glass opacity, reflecting interstitial and early alveolar edema is the most frequent finding, and smooth thickening of the interlobular septa is almost invariably present399. and 400. (Fig. 7.52). There is no particular distribution to the ground-glass opacification but focal areas may have a centrilobular distribution. 401 Mediastinal adenopathy is an inconstant feature.401. and 402. In the eight patients described by Swensen et al., 400 five patients had bilateral pleural effusions and four showed a mosaic attenuation pattern; the central pulmonary arteries were judged to be dilated in seven patients (whereas the pulmonary veins were not). Although this constellation of HRCT features is suggestive of pulmonary venoocclusive disease the authors concluded that a lung biopsy is required to confirm the diagnosis400 although others have suggested that the clinical findings may be sufficiently characteristic to avoid the need for biopsy confirmation386 (Box 7.10).
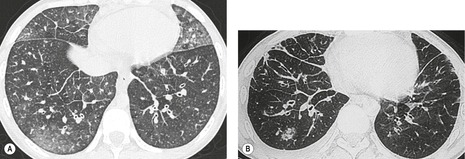
Box 7.10
• Signs of pulmonary arterial hypertension
• Radiographic signs of (interstitial) pulmonary edema
– No upper lobe blood diversion
• Pleural effusions
• Mediastinal lymphadenopathy (an occasional CT finding)
• Ground-glass opacity thickened interlobular septa (conspicuous) on HRCT
Congenital systemic-to-pulmonary shunts
Pulmonary artery pressure can be elevated even without a rise in pulmonary vascular resistance if the pulmonary arterial blood flow is large enough. Sustained very high flows of this order are seen only with left-to-right shunts. The increased vessel size resulting from the massive blood flow dominates the radiographic picture. The elevations of pulmonary artery pressure are mild and do not contribute in a recognizable fashion to the radiographic appearances. A classification proposed by Simoneau et al. for congenital shunts that can result in pulmonary hypertension is shown in Box 7.11.
Box 7.11
1. Type
• Simple
– Atrial septal defect (ASD)
– Ventricular septal defect (VSD)
– Patent ductus arteriosus (PDA)
– Total or partial unobstructed anomalous pulmonary venous return
• Combined
– Describe combination and define prevalent defect if any
• Complex
– Truncus arteriosus
– Single ventricle with unobstructed pulmonary blood flow
– Atrioventricular septal defects
2. Dimensions
• Small (ASD ≤2.0 cm and VSD ≤1.0 cm)
• Large (ASD >2.0 cm and VSD >1.0 cm)
3. Associated extracardiac abnormalities
4. Correction status
• Noncorrected
• Partially corrected (age)
• Corrected: spontaneously or surgically (age)
(after Simonneau et al.336 Copyright Elsevier.)
The radiographic features of left-to-right shunt are cardiac enlargement and enlargement of all the pulmonary vessels, both central and peripheral, in all lung zones. With normal pulmonary vascular resistance the distension of the pulmonary vascular tree is approximately proportional to the increased flow. With a fully established Eisenmenger syndrome (reversal of shunt owing to elevation of pulmonary vascular resistance) the central vessels show disproportionate enlargement with rapid tapering at segmental level and beyond. It can be difficult to recognize mild or moderate elevation of pulmonary vascular resistance because the diagnosis depends on evaluating the relative size of the vessels and there are no acceptable measurements or ratios on which to base this judgment. The pattern varies according to the defect. Rees and Jefferson403 noted that in Eisenmenger ASD the chest radiograph shows massive enlargement of the central vessels with rapid tapering beyond hilar level (Fig. 7.53), whereas with Eisenmenger VSD the degree of dilatation of the central vessels is usually mild (Fig. 7.54) and sometimes even unrecognizable. Thus, with VSD, even in cases with systemic pressures in the pulmonary circuit, the rapid tapering of vessel size is often not present. In fact, the appearances are often similar to a mild or moderate left-to-right shunt with no recognizable evidence of pulmonary arterial hypertension. It is even possible to have a normal or near-normal radiograph in Eisenmenger VSD. Eisenmenger PDA shows moderate dilatation of the aortic arch and the main pulmonary artery, and mild dilatation of the right and left hilar arteries. (The ductus itself may calcify.) The explanation for the different appearances of Eisenmenger ASD, VSD, and PDA remains conjectural.
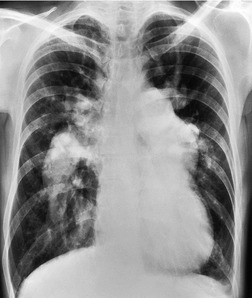
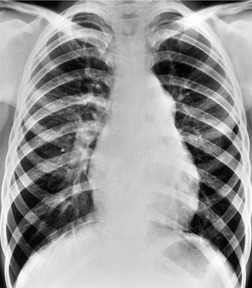
On both chest radiography and CT, Sheehan et al. 404 reported features that they described as representing ‘neovascularity’ in patients with Eisenmenger syndrome (but not in patients with acyanotic pulmonary hypertension); these included serpiginous intrapulmonary vessels and micronodules, as well as larger centrilobular ground-glass opacities (Fig. 7.55). In addition, prominent hilar and subcarinal vessels (bronchial arteries), intercostal vessels, and serpiginous vessels transgressing the visceral pleura were all more frequently identified in Eisenmenger patients than in acyanotic pulmonary hypertension. However, Griffin et al. 405 showed no significant difference in the prevalence of pulmonary changes between patients with idiopathic pulmonary arterial hypertension and Eisenmenger syndrome, although the latter showed more pronounced bronchial artery collateral formation.
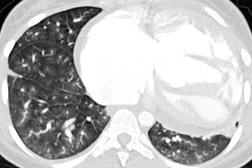
Pulmonary hypertension with left heart disease
Restriction of flow through the pulmonary venous system or through the left atrium and mitral valve raises pulmonary venous pressure, which in turn leads to elevation of pulmonary arterial pressure. With a healthy right ventricle, increases in mean left atrial pressure up to 25 mmHg are accompanied by a proportional increase in pulmonary artery pressure to maintain a constant mean gradient of approximately 10 mmHg.
When the mean venous pressure is chronically greater than 25 mmHg, a disproportionate elevation of pulmonary arterial pressure is observed, indicating an increase in pulmonary arteriolar resistance (mitral stenosis is a good example; just under a third of patients with stenosis sufficiently severe to chronically elevate pulmonary venous pressure above 25 mmHg develop systolic pressures of 80 mmHg or greater). The mechanism for the elevation of pulmonary arterial pressure is unclear. Both vasoconstriction and structural changes play a part. Microscopic examination shows distension of the pulmonary capillaries, thickening and rupture of the basement membranes of the endothelial cells, and minor degrees of hemorrhage into the alveoli.
The changes of pulmonary arterial hypertension secondary to chronic impedance of pulmonary venous drainage are visible radiographically only when the pulmonary arterial pressures are very high. Such high pressures are almost never encountered in left ventricular failure, reduced left ventricular compliance, or constrictive pericarditis. Thus, when radiographic features of pulmonary arterial hypertension are evident in an adult, the conditions to be considered in the category of increased impedance to pulmonary venous drainage are mitral valve disease, left atrial myxoma, cor triatriatum (which may develop in adulthood), and pulmonary venoocclusive disease.
The radiographic changes reflect a combination of pulmonary arterial and pulmonary venous hypertension together with the features of the primary condition (Fig. 7.56). The central pulmonary arteries are dilated, tapering to normal caliber at or beyond segmental level. The upper zone vessels are enlarged because of upper zone blood diversion. In mitral stenosis the left atrium is enlarged and may show calcification either in its wall or in left atrial thrombus. Although the left atrium is almost invariably enlarged in cases of mitral valve disease with pulmonary arterial hypertension, it may not be strikingly large, and enlargement should therefore be looked for carefully on the plain chest radiograph. The chest radiograph in left atrial myxoma is identical to that of mitral stenosis except that occasionally it is possible to recognize focal calcifications within the tumor mass.
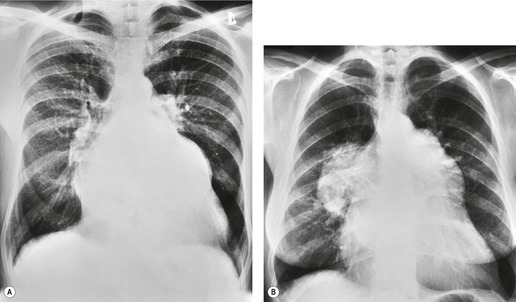
Pulmonary hypertension associated with lung diseases and/or hypoxemia
Pulmonary hypertension is a common phenomenon in chronic pulmonary diseases, notably in chronic obstructive pulmonary disease (Fig. 7.57) and interstitial fibrotic lung disease. The acquired immunodeficiency syndrome is a recognized cause of pulmonary hypertension,406.407. and 408. but the mechanism by which HIV infection causes pulmonary hypertension remains unclear.409. and 410. Fibrothorax and lung destruction resulting from infection are less frequent causes of pulmonary hypertension.
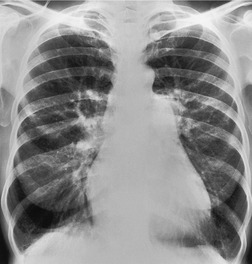
The common factor responsible for the elevated pulmonary vascular resistance in all these conditions is probably hypoxia, the most efficient known vasoconstrictor. In disorders such as emphysema and interstitial fibrosis there is the added possibility that destruction of the lung vasculature may play a role. 411 The relationship between lung destruction and raised pulmonary vascular resistance is not simple. No direct correlation between the severity of the emphysema and the degree of right ventricular hypertrophy (the pathologist’s criterion of longstanding pulmonary arterial hypertension) at autopsy has been shown.412. and 413. However, in vivo studies using MRI have demonstrated right ventricular hypertrophy in patients considered to have mild and even trivial chronic obstructive pulmonary disease.414. and 415. Conversely, chronic obstructive pulmonary disease as a cause of severe pulmonary hypertension, as judged by its low prevalence in a population of 600 patients with documented pulmonary hypertension, is noteworthy. 416
The commonly used yardstick of dilatation of the main pulmonary artery, as a measure of pulmonary hypertension, does not seem to reliably apply to patients with idiopathic pulmonary fibrosis – in this context many patients have a dilated main pulmonary artery without raised pulmonary artery pressures (although the pulmonary artery to aorta ratio remains more or less valid) 417 as a measure of pulmonary hypertension, does not seem to reliably apply to patients with idiopathic pulmonary fibrosis – in this context many patients have a dilated main pulmonary artery without raised pulmonary artery pressures417 (Fig. 7.58). Doppler echocardiography provides indirect evidence of pulmonary arterial hypertension in patients with a variety of disorders such as chronic obstructive pulmonary disease,418. and 419. and the pulmonary vasculopathy associated with systemic sclerosis, 420 but there may be problems in consistently obtaining pressure gradient readings with continuous wave Doppler. 421 The radiographic features consist of a combination of the signs of the responsible pleuropulmonary disease and the signs of pulmonary arterial hypertension, often with evidence of associated biventricular cardiac failure.
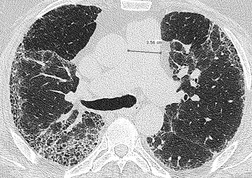
Alveolar hypoventilation can lead to hypoxia, and hypoxia is the most potent known stimulus for pulmonary vasoconstriction. 422 Hypoxic pulmonary vasoconstriction normally helps match blood flow and ventilation, diverting blood flow away from poorly ventilated areas. 423 When only a small portion of the lung is hypoxic, this response improves arterial oxygen saturation by reducing blood flow to the poorly ventilated segments without increasing pulmonary artery pressure. However, with widespread alveolar hypoxia, this normally protective response causes a large fraction of the pulmonary vasculature to constrict, increasing pulmonary artery pressure. 423
Alveolar hypoventilation without underlying disease is seen in morbid obesity. 407 The effects of morbid obesity on lung ventilation are complex, consisting of (1) obstructive sleep apnea (almost invariably) and (2) hypoventilation (hypoxemia and hypercapnia) even while awake and breathing room air. The mechanisms of hypoventilation include a marked increase in abdominal contents that push the diaphragm up, increased chest wall compliance, weakness of inspiratory muscles, and altered hypoxic and hypercapnic responsiveness.424. and 425. Most patients with the sleep apnea and alveolar hypoventilation syndromes are markedly obese, but there are exceptions. Conversely, many very obese patients do not suffer from either syndrome. On radiographic study the appearances are those of pulmonary arterial hypertension with cardiomegaly and dilatation of the central pulmonary arteries in an obese subject. Biventricular cardiac failure is a frequent cause of death in these patients. 426
A consequence of chronic hypoxia has been elegantly demonstrated in a radiographic study of individuals living at sea level and 1400 m and 2600 m above sea level. The width of the right descending pulmonary artery, presumed to reflect pulmonary artery pressure, was independently related to residence at elevated altitude. 427
Pulmonary hypertension due to chronic thromboembolism
Pulmonary hypertension may result from acute pulmonary embolism when the emboli occlude enough of the pulmonary arterial bed. The mechanisms are complex, consisting of a mixture of mechanical obstruction and vasoconstriction. These acute changes in pulmonary artery pressure do not produce radiographically visible pulmonary arterial hypertension, in part because a previously normal right ventricle can produce right ventricular systolic pressures only up to 45–55 mmHg. Higher pressures indicate preexisting right ventricular hypertrophy, not attributable to acute pulmonary embolism.
Repetitive thromboemboli without intervening lysis of the thrombus load may lead to chronic elevation of pulmonary artery pressure. As a sequel to acute pulmonary embolism the condition is rare. Infrequently there is an obvious source for recurrent pulmonary emboli, such as a ventriculoatrial shunt catheter. 428
It must be acknowledged that there are those who question whether pulmonary hypertension caused by chronic obstruction of the pulmonary arterial blood flow is actually the result of recurrent pulmonary emboli, rather than in situ thrombotic occlusion of the pulmonary microvasculature.429. and 430. Nevertheless, the development of chronic thromboembolic pulmonary hypertension has been estimated to occur in at least 3% of patients who have experienced acute pulmonary embolism. 22 Infarction is not usually a feature, and the condition is frequently undiagnosed until widespread and progressive occlusion of the pulmonary vascular bed has led to symptomatic pulmonary arterial hypertension. It is these patients who may show the radiographic changes of pulmonary arterial hypertension. Surgical thromboendarterectomy may be undertaken in carefully selected patients with substantial success.21.431. and 432.
At pathologic study, organized thrombi are seen in both elastic and muscular arteries. The thrombi in the smaller vessels show recanalization, forming a lattice of fibrous trabeculae lined by endothelium. New blood channels may form within the thrombi, and medial hypertrophy occurs secondarily. Plexiform lesions (see description in the section on Pulmonary arterial hypertension – idiopathic and associated disorders, p. 411) are absent, although organizing thrombi may on occasion be difficult to distinguish from plexiform lesions.
The chest radiograph shows cardiomegaly and central vessel dilatation, with regional peripheral oligemia in the majority of patients433. and 434. (Fig. 7.59). A few patients have normal or near-normal radiographs. Others show only changes such as atelectasis, pleural thickening, or pleural effusion, with no radiographic signs of pulmonary hypertension. Unsurprisingly, pleural changes are more frequent in patients with thromboembolic pulmonary hypertension than in those with idiopathic pulmonary arterial hypertension. 435
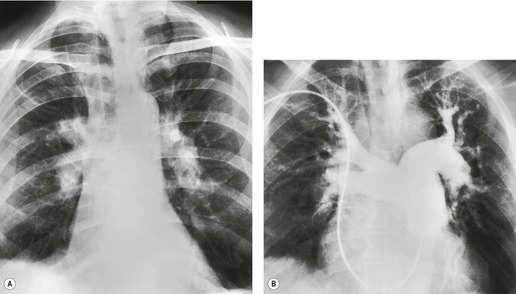
The features shown on CT can be broadly divided into cardiac, vascular, and parenchymal abnormalities;150.369. and 436. these are summarized in Box 7.12. Dilatation of the right ventricular cavity and deviation of the interventricular septum reflecting pulmonary hypertension may be clearly evident on contrast-enhanced CT or MRI347 (see Fig. 7.43). Marked dilatation of the proximal pulmonary arteries, which very rarely have calcified walls, and intraluminal thrombus are clearly demonstrated on CT; 169 contrast-enhanced CT or MRI are probably superior to pulmonary arteriography for the detection of central thrombus, particularly when it is lamellar, in patients being considered for thromboendarterectomy170. and 437. (see Figs 7.20, 7.26 and Fig. 7.60); nevertheless, conventional pulmonary angiography is still recommended for surgical assessment. 21 Bronchial artery hypertrophy usually accompanies chronic thromboembolic disease and the enlarged vessels may be readily identified on contrast-enhanced CT172.369. and 438. (see Fig. 7.20). Indeed, Remy-Jardin et al. 439 have reported a highly significant difference in the prevalence of systemic (bronchial and nonbronchial) arteries in patients with pulmonary hypertension secondary to chronic thromboembolism (16/22 patients, 73%) and patients with idiopathic pulmonary arterial hypertension (2/14 patients, 14%), suggesting that this is a useful discriminatory sign.
Box 7.12
• Cardiac
– Features of right heart strain (dilated right ventricle and bulging of interventricular septum)
• Vascular
– Dilated proximal pulmonary arteries (eccentric intraluminal thrombus, very rarely calcification in artery walls)
– Regional variation in caliber of subsegmental pulmonary arteries
– Abrupt vessel narrowing
– Filling defects in pulmonary arteries representing emboli/thrombus
– Weblike filling defects in pulmonary arteries
– Out-pouching/aneurysmal pulmonary arteries sometimes containing thrombus (rare)
– Tortuous/serpiginous vessels (reflecting chronic pulmonary hypertension)
– Hypertrophied bronchial arteries and other systemic collaterals
• Parenchymal
– Mosaic attenuation pattern
– Basal subpleural linear and irregular opacities reflecting previous infarcts
– Dilatation of bronchi and air-trapping (occasional feature)
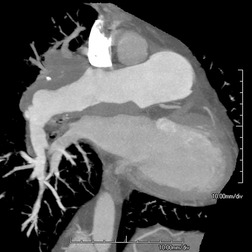
Areas of low attenuation of the lung parenchyma caused by hypoperfusion secondary to the pulmonary vascular occlusion, the mosaic oligemia, or mosaic attenuation pattern150.370.436. and 440. is an expected and often striking feature (Fig. 7.61). The intervening normal lung may appear abnormally dense, because of relatively increased perfusion, and these areas may be misinterpreted as having an abnormal ground-glass pattern due to another cause.441. and 442. A mosaic attenuation pattern appears to be an almost invariable finding in patients with chronic thromboembolic disease and this, coupled with disparities in the size of segmental pulmonary arteries, may differentiate such patients from those with other causes of pulmonary arterial hypertension. 372 Dilatation of bronchi in areas of reduced perfusion (hypoxic bronchodilatation) is an interesting ancillary CT sign that has been reported in some patients with chronic thromboembolic disease443 (see Fig. 7.16B). Furthermore, expiratory CT has been reported to show patchy air-trapping (not necessarily in segments with occluded supplying vessels) in over half of patients with pulmonary embolism; 444 the degree to which this phenomenon is responsible for the mosaic pattern seen in patients with chronic thromboembolic disease is uncertain.
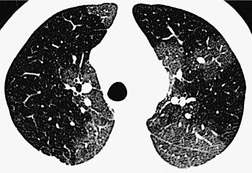
Pulmonary angiography433 reveals filling defects caused by thrombi in the lobar or segmental arteries, with occlusions of large- and medium-sized vessels. If the thrombus in the main pulmonary arteries is laminated, the typical angiographic signs of filling defects may be absent. 445 As with CTPA the central vessels are usually dilated, with rapid distal tapering. Web-shaped filling defects are occasionally seen. ‘Pouching’ of partially or completely occluded pulmonary arteries is also seen in chronic thromboembolic disease. 446
 lung scintigraphy in pulmonary hypertension secondary to chronic thromboembolic disease shows multiple segmental mismatched perfusion defects indistinguishable from high-probability scans in acute pulmonary embolism. 366 The appearances remain unchanged on sequential imaging. It is not uncommon to find patients with suspected acute pulmonary embolism who are referred for
  scintigraphy for the first time to show mismatched perfusion defects that do not resolve on repeat scans performed several weeks later.
  scintigraphy has been reported to be more sensitive than CTPA for identifying patients with potentially treatable chronic thromboembolic pulmonary hypertension (sensitivities 96% and 51%, respectively), 447 and in patients with suspected chronic thromboembolism, full assessment should probably include both tests.448. and 449. MRI is a good alternative to CTPA for identifying several of the vascular signs of chronic thromboembolism437 and will also provide information about right ventricular function.347. and 450.
Other vascular causes of pulmonary hypertension
Pulmonary arterial hypertension may be caused by a variety of extremely rare pulmonary vasculopathies. Mostly these conditions affect the small vessels, and these are discussed in Chapter 10. Vasculitis confined to the large vessels and causing pulmonary hypertension is recognized but is much less common; 451 Takayasu disease is the best known example.
Takayasu arteritis (Takayasu disease, occlusive thromboarteriopathy, pulseless disease) is an arteritis of medium and large arteries that most commonly affects segments of the aorta and its main branches. 452 The vessel wall becomes fibrosed and thickened, usually causing luminal stenosis rather than aneurysm. Takayasu arteritis occurs chiefly in Asian women, and is manifested between 10 and 20 years of age in 75% of patients.453. and 454. The presenting features are constitutional symptoms, fever, arthralgia, and symptoms of local ischemia with absent pulses or bruits. Moderate systemic hypertension is common and is usually due to renal ischemia. 453 The course is variable, with episodic remissions or progression; death occurs in about 25% of cases.
Involvement of pulmonary arteries occurs in approximately half the patients455. and 456. and there appears to be a correlation between the frequency of pulmonary and systemic artery lesions. 457 The pulmonary hypertension is usually mild, and pulmonary symptoms are unusual. 456 The plain chest radiograph, in addition to showing the features of pulmonary arterial hypertension, may reveal oligemic areas beyond the obstructed arteries. 458 The plain chest radiograph may also show the features of aortic arteritis, namely irregular outline to the aorta, aortic ectasia, calcification of the aortic wall, or even rib notching.458. and 459. Angiography reveals obstructions or stenoses of the lobar and segmental branches of the pulmonary arteries, and there may also be focal areas of dilatation.456. and 458. Endovascular stenting, sometimes with numerous stents, may alleviate symptoms.460. and 461. Both MRI and CTPA can show vessel wall abnormalities to advantage462. and 463. (Fig. 7.62). Precontrast CT scans may reveal the aortic wall to be of higher than normal attenuation, with or without obvious calcification. The thickened walls of involved vessels sometimes show early or delayed enhancement following contrast enhancement. 463 The inflammatory process is reflected by a modest increase in positron emission tomography (PET) activity which can be seen to be centered in vessel walls on co-registered PET/CT. 464
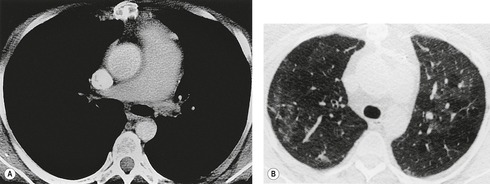
PULMONARY ARTERY ANEURYSM
Pulmonary artery aneurysms (Box 7.13) are very rare. They may be congenital in origin or acquired. In terms of rarity, idiopathic pulmonary artery aneurysms are limited to single case reports.465. and 466. Mycotic aneurysms are the most frequently encountered in practice. 467 Those that develop in the walls of tuberculous cavities are known as Rasmussen aneurysms. Mycotic aneurysms may also occur in association with lung abscess or septicemia, particularly in drug addicts, and actinomycosis. 468 Behçet disease, described on p. 616, is an important cause of lobar and segmental artery aneurysms, 469 and segmental pulmonary artery aneurysms are a feature of the rare and probably related Hughes–Stovin syndrome470 (see p. 616). Posttraumatic false aneurysm471 (reported as a complication of Swan–Ganz catheter placement),472. and 473. dissecting aneurysm of a pulmonary artery, 474 postembolic aneurysm, 475 bronchial carcinoma, 476 and myxomatous emboli from a right atrial myxoma477 are all very rare causes of pulmonary artery aneurysm. There appears to be a link with tuberous sclerosis.478. and 479. Very rarely the main pulmonary artery appears aneurysmally dilated in otherwise healthy individuals, 340 but only with prolonged follow-up can such cases be regarded as idiopathic and of no clinical consequence.
Box 7.13
• Intrapulmonary arterial aneurysms are exceedingly rare.
• Mostly acquired (infection e.g. tuberculosis or vasculitis e.g. Behçet syndrome)
• Severe hemoptysis (may be fatal) is common
• Easily overlooked on plain chest radiography and unenhanced CT
Hemoptysis is the principal complication and is frequently fatal. In one autopsy series, 480 rupture of the aneurysm was the immediate cause of death in 38 of the 45 tuberculosis patients examined. In only two cases were the aneurysms believed to be incidental.
It is rare to see the aneurysm as a discrete mass in an otherwise normal lung (Behçet disease being an exception). Usually the aneurysm is adjacent to, or surrounded by, the infective consolidation that caused it, and it may therefore be very difficult to appreciate. On chest radiography, Rasmussen aneurysms may occasionally resemble mycetomas. Because both cause hemoptysis, the true diagnosis is easily overlooked. The clue may be the rapid change in size of a mass resulting from an aneurysm. CT scanning with contrast clearly shows the vascular nature of pulmonary artery aneurysms481. and 482. (Fig. 7.63).
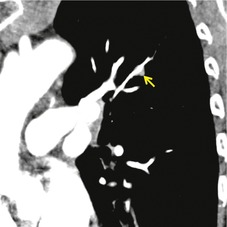 |
Fig. 7.63
Related posts:Stay updated, free articles. Join our Telegram channel
Full access? Get Clinical Tree
 Get Clinical Tree app for offline access

|