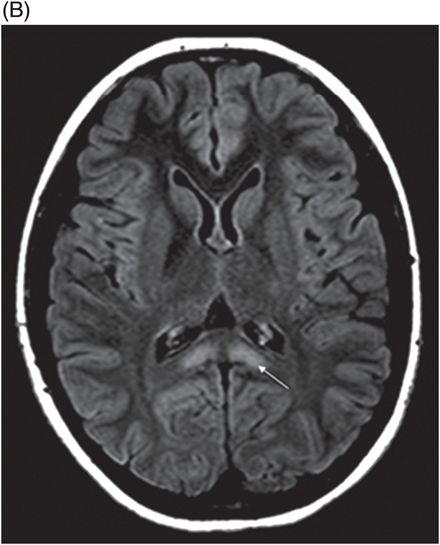
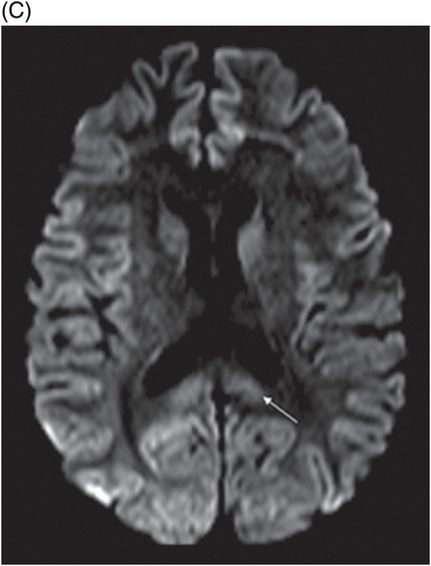
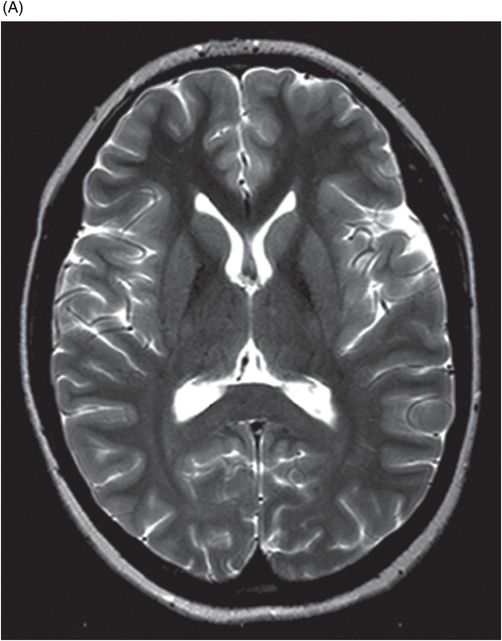
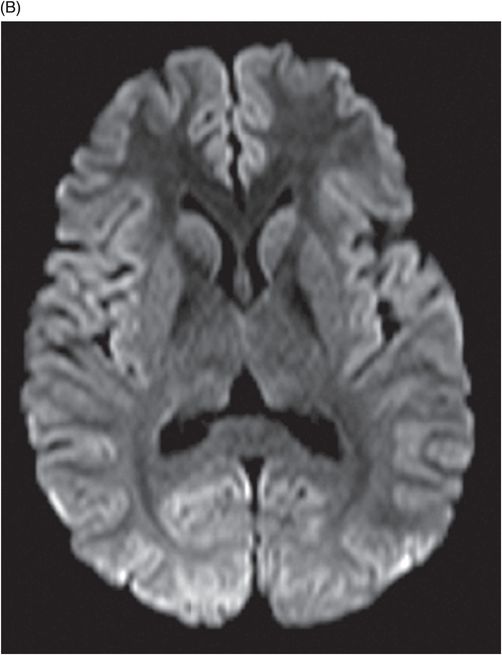
(A) Axial T2WI and (B) DWI at the level of lateral ventricles and splenium of corpus callosum.
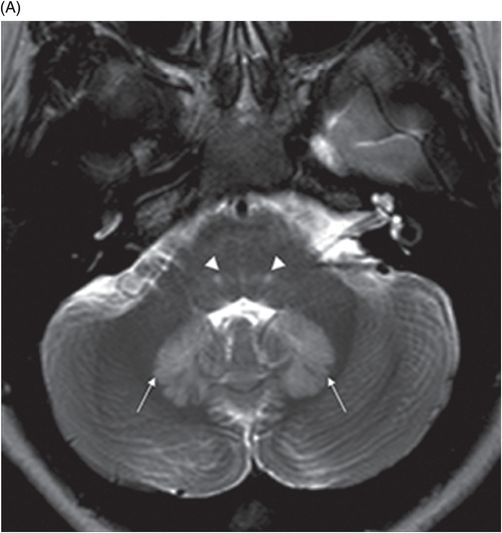
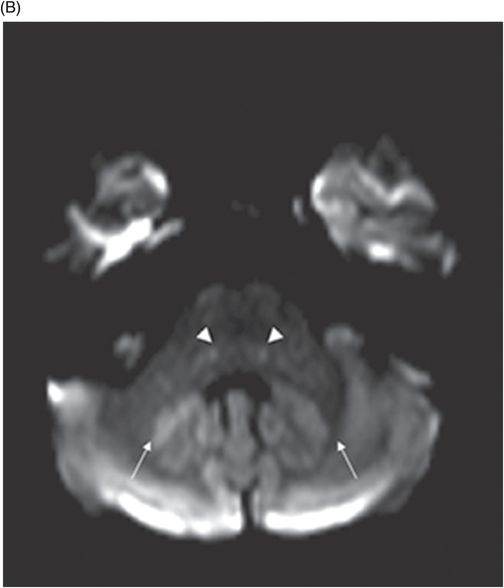
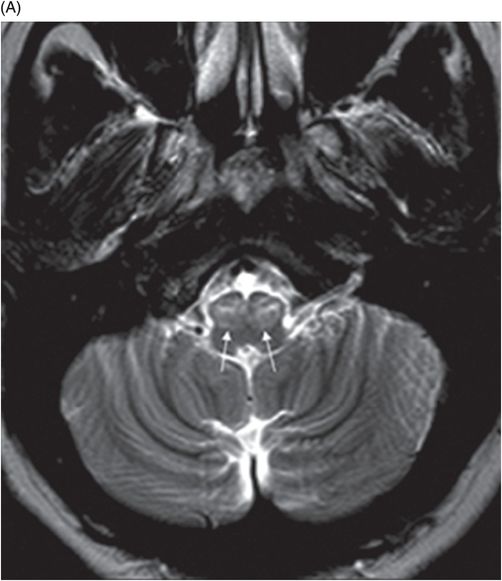
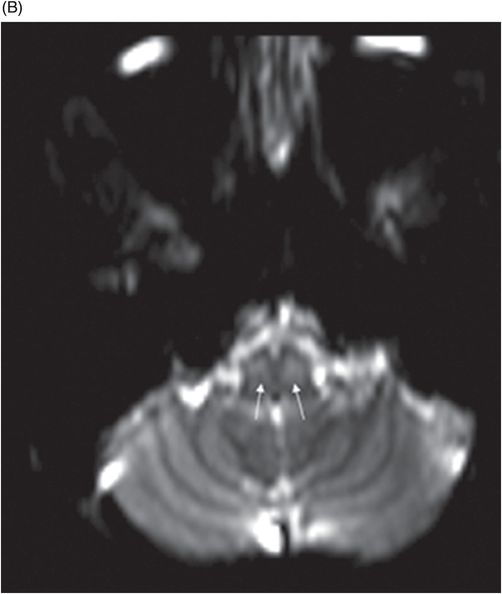
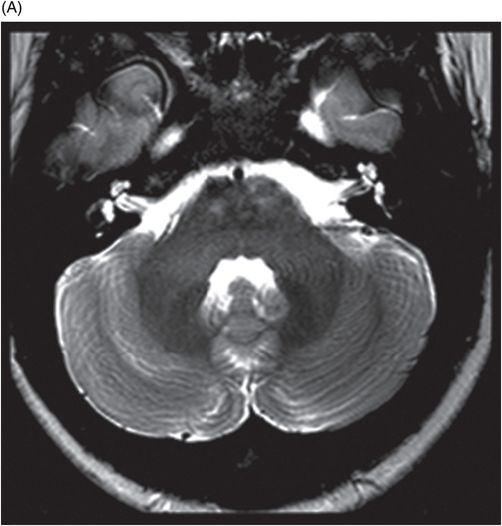
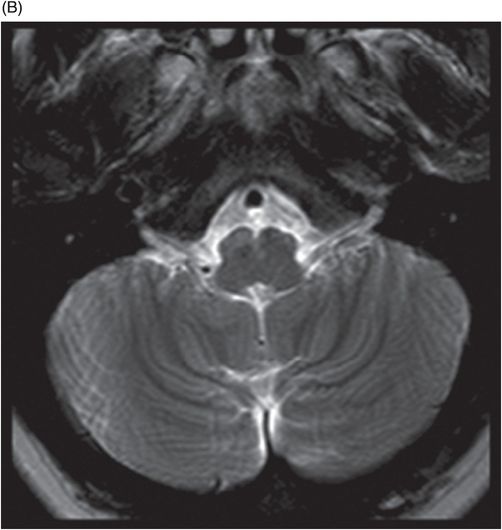
(A) Axial T2WI at the level of cerebellar dentate nuclei and midpons and (B) Axial T2WI at the level of inferior olivary nuclei.
Metronidazole-Induced Encephalopathy
Primary Diagnosis
Metronidazole-induced encephalopathy
Differential Diagnoses
Non-alcoholic Wernicke encephalopathy
Methylbromide intoxication
Maple syrup urine disease (MSUD)
Enteroviral encephalitis
Imaging Findings
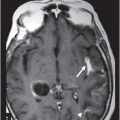
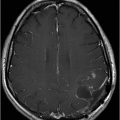
Fig. 72.1: (A) T2WI and (B) FLAIR showed focal hyperintense lesion in the splenium of corpus callosum (arrow). (C) DWI image demonstrated diffusion restriction in the same area. Fig. 72.2: (A) T2WI and (B) DWI demonstrated symmetric T2 hyperintense lesions with diffusion restriction in the bilateral dentate nuclei (arrows) and tegmentum (arrowheads). Fig. 72.3: (A) T2WI demonstrated similar symmetric signal abnormality in the inferior olivary nuclei (arrows) and (B) DWI with restricted diffusion. Fig. 72.4: (A) T2WI and (B) DWI demonstrate reversal of signal abnormality in the splenium of corpus callosum (8-week follow-up). Fig. 72.5: (A) Axial T2WI demonstrates resolution of T2 signal abnormality in (A) bilateral dentate nuclei and tegmentum and (B) inferior olivary nuclei.
Discussion
The diagnosis of metronidazole-induced encephalopathy (MIE) is characterized, in a given context of suspected drug toxicity, by a symmetric topographic MR imaging pattern involving the bilateral cerebellar dentate nuclei, dorsal pons, tegmentum, inferior olivary nuclei, and splenium of corpus callosum. Similar clinical presentation and imaging features can be seen in acute Wernicke encephalopathy but it tends to symmetrically involve the mammillary bodies, medial thalami, midbrain, floor of third and fourth ventricles and periaqueductal region. The subsequent reversal of imaging findings after drug cessation confirms the diagnosis, eliminating the other differential diagnoses options.
Metronidazole is a synthetic, 5-nitroimidazole antibiotic used for protozoal and anaerobic infections. It is widely used for surgical prophylaxis, to treat inflammatory bowel disease, and to treat non-infectious conditions, such as hepatic encephalopathy. The drug has high CNS penetrability, reaching close to serum level concentration in brain parenchyma. Commonly reported side effects include nausea, vomiting, headache, abdominal discomfort, and metallic taste. Less common adverse effects including peripheral neuropathy, ataxia, and seizures have been reported in the pharmacology literature.
Metronidazole-induced encephalopathy is a poorly understood entity with conflicting hypotheses for its cause; hence, the exact mechanism of CNS drug toxicity has not been completely elucidated. The proposed causal mechanisms include Purkinje cell damage, inhibition of protein synthesis and axonal degeneration induced by neuronal RNA binding, or vasogenic edema induced by the generation of semiquinone and nitro anion radicals. DNA binding of intermediate metronidazole compounds and modulation of cerebellar and vestibular nuclei GABA receptors has been found in animal studies. However, data for most of these explanations stems from animal model studies.
Metronidazole-induced encephalopathy exhibits a topographic brainstem distribution pattern comprising of symmetric bilateral cerebellar dentate nuclei, midbrain (tectum, red nucleus, tegmentum, and periaqueductal gray matter), dorsal pons (vestibular, superior olivary, and abducens nuclei), and dorsal medulla. Other areas that can be involved are splenium of corpus callosum, internal capsule, and anterior commissure. Bilateral inferior olivary nuclei changes, as seen in our patient, are uncommon. This may be the result of drug toxicity or a manifestation of hypertrophic olivary degeneration due to interruption of the Guillain-Mollaret triangle.
On MR imaging, the signal changes in MIE are best appreciated on T2WI and FLAIR sequences. The lesions are hyperintense on DWI and if based on high or low ADC values, can reflect either vasogenic or cytotoxic edema changes. The diffusion restriction changes in the splenium of corpus callosum are attributable to cytotoxic edema. Elsewhere in the brain, the parenchyma, for example, these diffusion changes are due to vasogenic edema. T2WI symmetric lesions are also reported in the periventricular regions of mammillary bodies, medial thalamus, floors of the third ventricle, and tectum; thus, Wernicke encephalopathy is an important differential diagnosis.
Etiologies characterized by the presence of a T2 hyperintense signal involving the splenium of corpus callosum vary widely, necessitating careful consideration of differential diagnoses in the context of imaging findings and clinical data. For example, antiepileptic drug withdrawal, demyelinating diseases, a spectrum of viral encephalitides, and multiple toxic and metabolic diseases should be considered in light of a patient’s clinical presentation. Osmotic myelinolysis involves the basis pontis and often shows diffusion restriction. In contrast, MIE has an affinity for the dorsal pons and rarely shows changes on diffusion imaging which are quite specific in topographic distribution. Imaging studies obtained post-metronidazole therapy cessation show complete symptomatic recovery. Resolution of cytotoxic and vasogenic edema has been reported on follow-up MR imaging after six to eight weeks.
Stay updated, free articles. Join our Telegram channel

Full access? Get Clinical Tree


