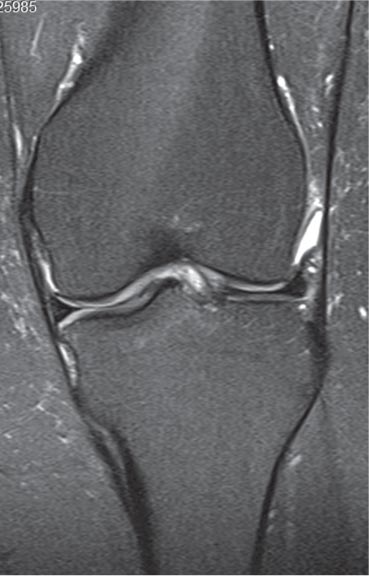
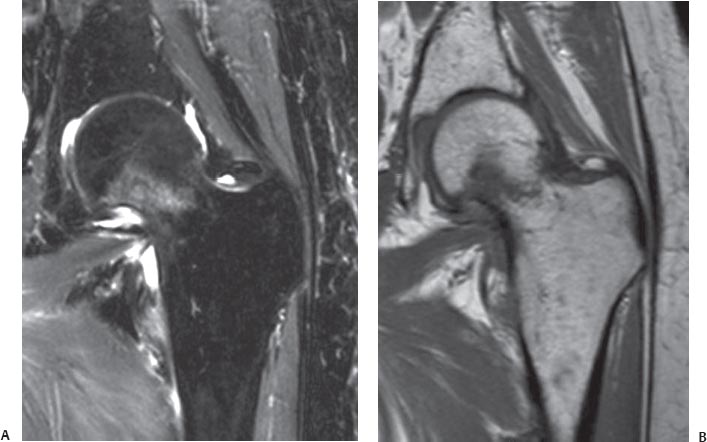
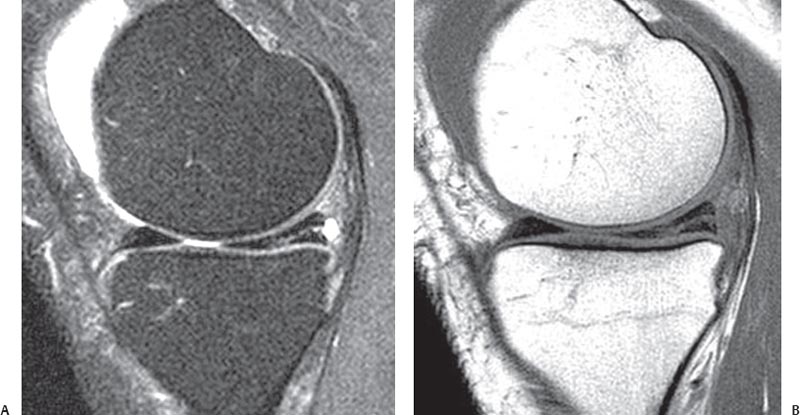
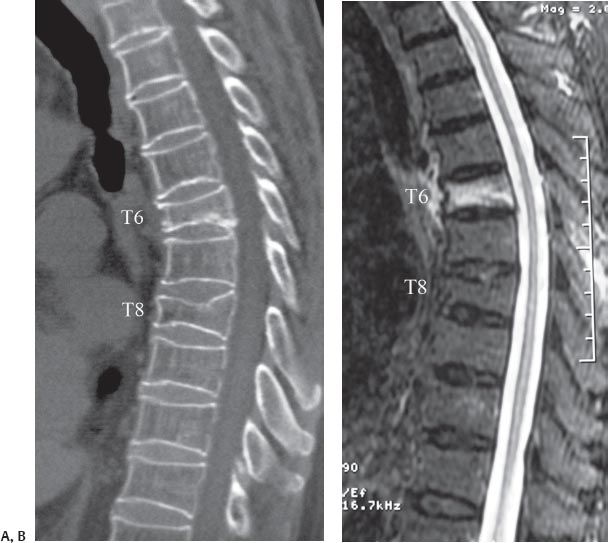
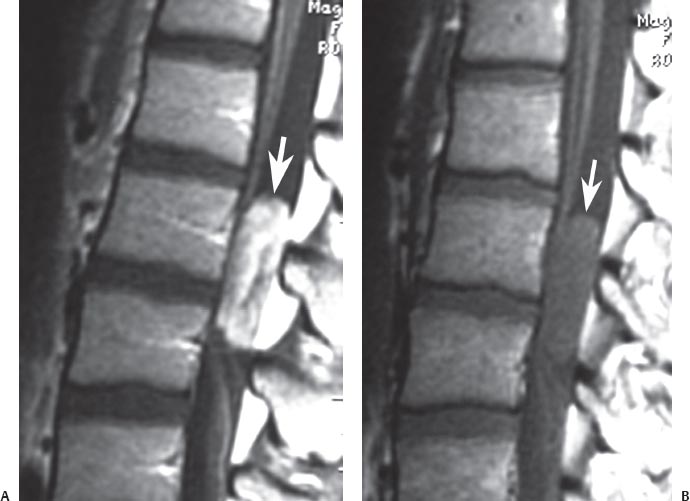
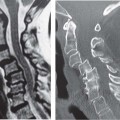
3 A Systematic Approach to the Review of Musculoskeletal MRI Studies As with any new skill, learning the process for evaluating an MRI study begins with a systematic approach. Less experienced clinicians may have a tendency to review films without paying special attention to the type of imaging studies, the pulse sequences that are being evaluated, or the plane in which they are being evaluated. When reviewing films on a computer workstation, they also may tend to review only one pulse sequence or one or two imaging planes. These shortcuts, especially early in a clinician’s experience in evaluating MRI studies, may lead to less accurate and less reliable MR study interpretation. Chapter 1 provided a summary of the technical foundation that radiologists often use to select the appropriate pulse sequences and imaging techniques for the study of a given region or pathologic process. The purpose of this more clinically oriented chapter is to provide the clinician or radiologist with a method for evaluating MRI studies in an organized and systematic fashion. The adoption of such a system early in a clinician’s experience is believed to lead to improved accuracy and reliability in the interpretation of MRI studies. Over time, clinicians may be able to incorporate a more informal method of evaluating the MRI studies and rely more on their own experience and personalized method of study evaluation. The evaluation of an MRI study can be divided into the following five steps: 1. Determination of which conventional and specialized MRI pulse sequences are available for review 2. Evaluation of T2-weighted images for recognition of areas of increased T2-weighted signal that are not expected or physiologic 3. Evaluation of T1-weighted images for improved detection of anatomic detail and correlation of the alteration in local and regional anatomy on the T1-weighted images with areas of increased signal intensity on the T2-weighted images 4. Evaluation of specialized MRI pulse sequences that may be specific to the region or disease process that is being evaluated 5. Correlation of the above imaging information with the patient’s history, physical examination, and laboratory study results to identify the most likely differential diagnostic considerations The use of a general technique of MRI study evaluation described in this chapter in conjunction with the more region- and concept-specific information provided in subsequent chapters will help improve a clinician’s ability to accurately interpret an MRI study of the musculoskeletal system. The first step in the evaluation of an MRI study is to determine which pulse sequences are available for review. For most cases, such sequences include at least T1-weighted and conventional T2-weighted images, acquired in the sagittal, axial, and (frequently) coronal planes. MR images of the spine (cervical, thoracic, and lumbar) are often acquired only in the sagittal and axial planes. Fig. 3.1 A sagittal T2-weighted image of the cervical spine. Note that the CSF is of high signal intensity. Fig. 3.2 Sagittal fat-suppressed T2-weighted (A) and T1-weighted (B) images of the knee. Note that the joint fluid is high signal on the former and low signal on the latter. Note also that there is a horizontal tear of the posterior horn of the medial meniscus with an associated meniscal cyst, which is best seen on the T2-weighted image (A). In addition to conventional T1-weighted and T2-weighted pulse sequences, there are other pulse sequences that are often acquired and that should be recognizable, including the following: • Fat-suppressed T2-weighted images or STIR images • Postgadolinium T1-weighted images • Gradient-echo images • MR arthrography images • MR angiography images One should be able to determine whether an image is T1-weighted or T2-weighted using the following techniques: • Recognition of an area within an image that is known to contain fluid, such as the spine (CSF) (Fig. 3.1), the region of the hip (bladder), and the knee or other joints (intraarticular fluid) (Fig. 3.2). If this fluid is noted to be bright or of high signal intensity, that image is likely T2-weighted. If the region of the fluid is noted to be dark, that image is likely T1-weighted. Fig. 3.3 In this coronal STIR image of the left knee, note that this image is relatively dark. Thus, if an area of increased signal is noted in the tibial plateau, for example, it would be relatively conspicuous and difficult to miss. • Recognition of the TR and TE values, which are often printed on the film or are visible on the workstation screen. Recognizing these values may allow the clinician to determine whether an image is T1-weighted or T2-weighted. In most institutions and in most cases, images are acquired using an SE technique (for additional details, see Chapter 1). When this technique or similar techniques are used, the TR value is usually 300 to 800 ms for T1-weighted images and 2001 to 5001 ms for T2-weighted images. If the clinician evaluates the image and is unable to use the technique in which fluid recognition allows the differentiation of T1-weighted and T2-weighted images, this technique is a good second option. If the TR number is found on the film and is noted to be in the 100s range, it likely is a T1-weighted image. If the TR number is found to be in the 1001s range, it likely is a T2-weighted image. With newer and more variable pulse sequences, this method may be less reliable. Fat-suppressed T2-weighted images are acquired using techniques similar to those for conventional T2-weighted images, and then various computer algorithms and processes are used to “suppress” the signal that is coming from fat. A more “pure” way of achieving this goal is to acquire a STIR image, in which case the signal from fat is not acquired. Because of the suppression of signal from fat in either of these techniques, the images tend to appear quite a bit “darker” than images obtained via other techniques (such as conventional T2-weighted images) and thus help accentuate the increase in T2-weighted signal (relative to the adjacent tissues), which may otherwise be missed (Fig. 3.3). Specifically, this technique facilitates the evaluation of bone marrow edema and edema secondary to other pathologic processes. Fat-suppressed T2-weighted images or STIR images show areas of edema with markedly greater conspicuity than that seen on conventional T2-weighted images (see individual chapters for applications of these techniques for region-specific pathology). As an example, in the evaluation of a nondisplaced femoral neck fracture, coronal T1-weighted or T2-weighted images may not show edema along the fracture line, whereas a fat-suppressed T2-weighted image or a STIR image would make such a finding quite obvious (Fig. 3.4). These latter images are also useful for determining whether a vertebral compression fracture represents a chronic fracture or an acute or subacute fracture (Fig. 3.5). Fig. 3.4 Nondisplaced femoral neck fracture in the left hip. (A) A coronal STIR image shows a region of increased signal intensity in the femoral neck, suggestive of an acute or subacute nondisplaced fracture. (B) A T1-weighted image shows a linear pattern of low signal within the femoral neck, which helps confirm the diagnosis of an acute, nondisplaced femoral neck fracture. Fig. 3.5 Vertebral compression fracture. (A) A sagittal reconstructed CT image shows vertebral compression fractures at the T6 and T8 levels. (B) A sagittal STIR image shows that the T6 vertebral compression fracture has increased signal compatible with edema within it, which is representative of an acute or sub-acute fracture. The T8 vertebral compression fracture shows no increase in signal within it, which is compatible with a chronic vertebral compression fracture. Postgadolinium T1-weighted images and fat-suppressed postgadolinium T1-weighted images are typically obtained for the evaluation of infection, tumor, and postsurgical changes or scar. These images can sometimes be confused with T2-weighted images because they may show areas of increased signal in the presence of pathology (Fig. 3.6); the distinction can be made using the techniques outlined above. Specifically, the clinician should evaluate the areas in which one may expect to find physiologic fluid, such as fluid within a joint or CSF in the spine. If this fluid is bright, then the images are T2-weighted. If this fluid seems to be dark, and the pathology seems to be bright, then the image is likely a postgadolinium T1-weighted image. In addition, the technique of TR evaluation described above can also be used to differentiate a postgadolinium T1-weighted image (TR is in the 100s range) from a T2-weighted image (TR is in the 1001s range). Gradient-echo images, which appear to be somewhat grayer in their general appearance than other images (including T1-weighted and T2-weighted images), are especially useful for the evaluation of articular cartilage (Fig. 3.7). In addition, it is important to note that the gradient-echo images are especially susceptible to ferromagnetic materials, such as metallic implants or hemosiderin, and therefore show “signal dropout” in the presence of these substances. MR arthrography images are obtained after the joint of interest is injected with gadolinium or normal saline (see Chapter 16) (Fig. 3.8). They may be diffcult to differentiate from T2-weighted images, which also contain bright fluid within the joint. MR arthrography images are often marked by the radiologist or the radiology technician so that it is relatively obvious that gadolinium has been injected into the joint. MR angiography images highlight the blood vessels and allow for evaluation of the arterial and venous vascular structures (see Chapter 16) (Fig. 3.9). These images are obviously different in appearance from the images acquired using the more conventional pulse sequences and MRI techniques. Fig. 3.6 Lumbar spine intradural-extramedullary mass. (A) A post-gadolinium sagittal T1-weighted image shows a high-signal intensity mass (arrow) just dorsal to the filum terminal. (B) The associated pregadolinium T1-weighted image shows the mass (arrow
 General Concepts
 Step 1: Determination of Pulse Sequences Available for Review

T1-Weighted and T2-Weighted Images
Fat-Suppressed T2-Weighted Images or STIR Images
Postgadolinium T1-Weighted Images
Gradient-Echo Images
MR Arthrography Images
MR Angiography Images
![]()
Stay updated, free articles. Join our Telegram channel

Full access? Get Clinical Tree


