Abdomen: Nontraumatic Emergencies


Abdomen: Nontraumatic Emergencies


Amanda M. Jarolimek

John H. Harris Jr.


In this chapter, the abdomen is considered to include the solid organs and hollow viscera located between the diaphragm and the pelvic peritoneal reflections. This includes the pancreas, adrenal glands, kidneys, and ureters. This chapter discusses disease entities that are frequently encountered in patients seeking care for abdominal pain or related symptoms in the emergency center. Only disease entities for which diagnostic imaging plays an important role are included. Since the 1980s and 1990s, the role of diagnostic imaging has continued to change. Abdominal radiographs have limited use in the care of the emergency patient with abdominal signs and symptoms. Computed tomography (CT) and ultrasound (US) are the principal tools for imaging emergency patients and provide sensitive and specific means of diagnosing abdominal pathology. Selection of the appropriate diagnostic examination should be based on the clinical presentation of the patient.


GENERAL CONSIDERATIONS

The American College of Radiology (ACR) Appropriate Criteria for Imaging and Treatment Decisions provides guidelines for the symptom-based triage of patients to the appropriate diagnostic imaging study (Table 14.1). The ACR criteria outline the best uses for each modality. Radiography is the primary imaging study for screening patients with suspected small bowel obstruction or bowel perforation. It is also used to follow patients with urolithiasis. US is the primary diagnostic tool in evaluating patients with jaundice and acute right upper quadrant pain. It is highly sensitive in detecting biliary obstruction, cholelithiasis, choledocholithiasis, or acute cholelithiasis. In many institutions, in thin and average size children, US with graded compression is the preferred modality for evaluation of suspected appendicitis. US and computed tomography angiography (CTA) are the modalities used for evaluation of pulsatile abdominal masses when abdominal aneurysm is suspected. Computed tomography (CT) examinations with oral, intravenous (IV), and rectal contrast are preferred in the evaluation for abdominal abscess and appendicitis. Unenhanced multidetector CT (MDCT) of the urinary tract is used for patients with acute flank pain and hematuria with suspected urinary stones. Hepatobiliary scintigraphy (cholescintigraphy) is an additional modality used in the evaluation of right upper quadrant pain and is used to diagnose cholecystitis, particularly when an US of the right upper quadrant is normal. Barium studies are used less frequently than other modalities emergently. However, barium swallows are used for the evaluation of esophageal perforation as well as for identifying the presence of a foreign body, and upper gastrointestinal (GI) studies may be done for the evaluation of duodenal hematoma.

It is of utmost importance to correlate the patient’s clinical presentation and physical exam
with the imaging findings. False-positive and false-negative results are encountered in the evaluation of the acute abdomen. An imaging finding not commensurate with clinical presentation, physical exam, or laboratory studies must be viewed with some suspicion. Knowledge of detailed patient medical data facilitates the radiologist selecting the appropriate imaging modality and improves interpretation and detection of subtle diagnostic findings.


TABLE 14.1 Summary of American College of Radiology Appropriateness Criteria for Selected Gastrointestinal, Genitourinary, and Cardiovascular Conditions


Clinical Presentation


Imaging Procedure of Choice


Recommended Alternatives


Suspected small bowel obstruction


CT


Supine and upright abdominal radiographs


Jaundice


US


CT


MRI abdomen without contrast with MRCP


ERCP


Acute right upper quadrant pain (suspect cholecystitis)


US


CT


Cholescintigraphy


Acute right lower quadrant pain (suspect appendicitis)


US-graded compression (children, young women, or pregnant patients)


CT if US is equivocal


CT (all other patients)


Suspected abdominal abscess


CT


MRI


US


Nuclear medicine white blood cell scan (postoperative)


Acute left lower quadrant pain (suspect diverticulitis)


CT


MRI (pregnant patient)


Acute pyelonephritis


No imaging in uncomplicated patient


Renal US


CT


CT with contrast


Acute onset flank pain (suspect stone disease)


CT low-dose renal stone protocol


Renal US with abdominal radiograph


Hematuria


CT urography


US kidney and bladder


IVU


Pulsatile abdominal mass


US


CT without contrast


CT with contrast


CTA abdomen


MRI with angiography


(MRA)


CT, computed tomography; US, ultrasound; MRI, magnetic resonance imaging; IVU, intarvenous urography; MRCP, magnetic resonance cholangiopancreatography; ERCP, endoscopic cholangiopancreatography; CTA, computed tomography angiography; MRA, magnetic resonance angiography.


DIAGNOSTIC IMAGING MODALITIES


Conventional Abdominal Radiography

The single supine frontal view of the abdomen is also referred to as the anteroposterior (AP) or supine radiograph, or as kidney-ureter-bladder (KUB). Additional erect and decubitus views of the abdomen as well as erect view of the chest are included to supplement the evaluation of pneumoperitoneum.
This series of radiographs comprise the standard abdominal series.

The AP radiograph of the abdomen should include from above the diaphragm to the anus. The erect view of the abdomen is preferred as the second view of the abdomen if the patient is capable of standing. This allows the evaluation of air-fluid levels in the intestinal tract, whereas a semierect view fails to depict air-fluid levels. Detection of free intraperitoneal air is possible in erect and decubitus views of the abdomen. However, a semierect view may not allow free intraperitoneal air to migrate upward into an easily detected subdiaphragmatic region. Patients who are unable to stand must have a left lateral decubitus view of the abdomen.


Ultrasound

US examination of the abdomen in the acutely ill or injured patient must be tailored to the clinical indication. The three most common emergency center abdominal US examinations are (1) right upper quadrant examination for suspected gallbladder or biliary tract abnormalities, (2) right lower quadrant examination with graded compression for suspected appendicitis, and (3) examination of the aorta for patients with a pulsatile mass.

US examination of the gallbladder and the biliary tree begins with longitudinal and transverse views of the gallbladder. The gallbladder is imaged in at least one of the following positions: supine, right decubitus, erect, or prone. With a change in position, detection of mobile gallstones is facilitated. The gallbladder is also assessed for the presence of stones or sludge in the lumen, for increased thickness of the gallbladder wall, and for the presence of pericholecystic fluid. If pain is elicited upon compression of the right upper quadrant, a sonographic Murphy sign is present. Examination of the intrahepatic ducts includes transhepatic views of the right and left ducts, which lie adjacent to the portal veins. The extrahepatic bile ducts should be followed through the porta hepatis as distally as possible. The distal common bile duct should be visualized through its course to the pancreatic head.

In cases of suspected appendicitis in thin patients, graded compression often allows visualization of a dilated inflamed appendix, establishing the diagnosis of acute appendicitis. This technique, originally described by Puylaert, involves using a 7.5 MHz or 5.0 MHz linear array transducer to compress overlying bowel loops and bring the inflamed appendix into view. Although adequate compression must be applied to displace colon and intraluminal contents from the area of interest, compression should be gently released to ensure the patient remains as comfortable as possible. The technique requires tracing the ascending colon downward to the cecum and identifying the base of the appendix. The appendix is imaged in transverse and longitudinal planes. Sonographic criteria for the diagnosis of appendicitis include an outer diameter of the appendix greater than 7 mm, the lack of compressibility of the appendix mesenteric stranding, and the presence of periappendiceal fluid collection or free intraperitoneal fluid.

Abdominal US is used for rapid diagnosis of abdominal aortic aneurysm. Obesity and overlying bowel gas may render the examination inconclusive or nondiagnostic. The proper technique uses an acoustic window through overlying bowel gas loops to permit transverse and longitudinal views of the aorta. The diameter of the abdominal aorta should be measured perpendicular to the axis of insonation to avoid overestimation of the size of the aorta, which does occur if the image plane is oblique to the axis of the aorta. CTA of the chest, abdomen, and pelvis is commonly used in the emergent evaluation for aortic aneurysms or aortic dissection.


Computed Tomography

Multiplanar CT is the most valuable imaging modality in evaluating abdominal emergencies. Oral, IV, and rectal contrast improves diagnostic capabilities and allows differentiation of contrast differences between adjacent structures. When the clinical setting permits, oral contrast should be administered 30 to 45 minutes prior to a CT examination of the abdomen or pelvis. Additional oral contrast should be administered immediately before imaging, so the stomach and proximal small bowel are well opacified. A dilute barium sulfate solution or iodinated contrast medium are taken orally or given via a gastric tube. Examination of the colon and the appendix is performed best with the administration of iodinated rectal contrast or air.


Oral contrast is extremely helpful in evaluation of thin patients in whom the lack of intra-abdominal fat limits distinguishing adjacent separate structures. In larger patients or in urgent situations, oral contrast may be omitted, particularly if pathology in the GI tract is not the principal concern.

IV contrast material is administered to delineate the boundaries or solid organs and bowel from surrounding tissues and to increase relative attenuation values between normal and abnormal tissues. The intensity of contrast enhancement is a function of the dose and injection rate, the timing of the imaging examination, the patient’s weight, and cardiac output. During the vascular phase, contrast material initially injected causes maximum vascular enhancement within the first 30 seconds after initial injection. During the redistribution phase, contrast rapidly redistributes to the extravascular space/tissues in the first 2 minutes after injection. At the end of redistribution, contrast enhancement of solid organs reaches its maximum. Over the next several minutes, in the equilibrium phase, contrast material within solid organs and vessels declines. Contrast material is excreted by the kidneys and excretion occurs over the next several hours. The proper CT scanning protocol should ensure the timing of the scan and contrast administration to allow accurate depiction of the area of interest. For most emergency CT studies, imaging toward the end of the redistribution phase and in the early equilibrium phase maximizes the contrast between parenchymal structures and eliminates diagnostic confusion of evaluating the liver and spleen, which are affected by mixing in the early vascular phase.


TABLE 14.2 Recommended CT Techniques for Routine Abdomen and Pelvis Imaging


Initial scan, adults and children >100 lb


Delayed scan, >100 lb


Children-, <100 lb


Infants


IV contrast material


GFR ≥60: Low osmolar, 300 mg/mL; GFR 30-40: Iso-osmolar, 320 mg/mL


Low osmolar, 300 mg/mL


Volume


150 mL


1.5 mL/kg


Rate


3 mL/s


Hand injection


Hand injection


Scan delay


60-80 s


5 min


End of bolus


End of bolus


Collimation


5 mm (helical)


10 mm (helical)


5 mm (helical)


5 mm (helical)


Top slice


Base of heart


Top of kidneys


Base of heart


Base of heart


Bottom slice


Symphysis pubis


Bladder


Symphysis pubis


Symphysis pubis


IV, intravenous; GFR, glomerular filtration rate.


Our standard examination technique consists of administration of 150 mL of low-osmolar IV contrast through an 18 gauge or larger antecubital IV catheter at 3.5 mL per second with helical scan acquisition beginning 60 to 70 seconds after the initiation of the bolus of contrast material. Delayed helical axial imaging is performed at 10 mm following a 5-minute delay following initial imaging. Children are imaged using a low radiation dose protocol. If children weigh less than 100 lb, a lowosmolar or iso-osmolar contrast is administered by hand injection if a 22 gauge or larger IV cannula can be placed in an antecubital fossa vein. The dose administered is 1.5 mL per kilogram and should not exceed 125 mL. In a child weighing greater than 100 lb, a power injection can be used via a central venous catheter or through a 24 gauge catheter if the rate of contrast injection is slow at 1 mL per second. Imaging begins at the end of contrast administration.

Technical parameters for common CT examinations of the abdomen and pelvis are detailed in Table 14.2. For the initial contrast-enhanced images, helical scanning with 5 mm collimation
and a pitch of 1.0 to 1.5 is commonly used. Delayed scanning of the kidneys is performed for evaluation of renal excretion with helical axial imaging at 10 mm collimation.

CTA is the standard examination for the evaluation of the abdominal aorta and branches. CTA is an excellent preoperative assessment of aortic aneurysm, aortic dissection, arterial stenosis, and arterial occlusion. The 1.0 mm helical images in the axial, sagittal, and coronal planes as well as maximum intensity projection (MIP) images are used.


Nuclear Medicine

Nuclear medicine techniques are used infrequently in the care of emergency center patients. Hepatobiliary imaging using99mTc iminodiacetic acid (IDA) analogues provides excellent quality accurate evaluation for acute and chronic biliary disease. Hepatobiliary scintigraphy (cholescintigraphy) is used in patients suspected of having acute cholecystitis but in whom US does not provide definitive diagnosis. Common indications are acute (calculous or acalculous) cholecystitis, biliary patency, and to identify biliary leaks.

GI bleeding studies are performed emergently to localize the site of bleeding.99mTc-labeled red blood cells and99mTc colloid are the most common radiopharmaceuticals used. The technique involves administering the99mTc-labeled red blood cells and imaging the patient using a large field of view scintillation camera during the injection and for several minutes after the injection. If a site of bleeding is not initially detected, delayed images may be obtained within 24 to 36 hours. The detection of lower GI bleed by both99mTc-labeled red blood cells and colloid has higher sensitivity than angiography and is noninvasive. Due to high background activity in the upper digestive tract and the diagnostic efficacy of endoscopy, nuclear imaging is used more commonly for evaluation of the lower GI tract. However, in evaluations of the GI tract, active, brisk bleeding in the duodenum and distal stomach are commonly detected in spite of background activity. Angiography may be negative with intermittent bleeding or in cases of bleeding rates lower than 1 mL per minute. With nuclear imaging, bleeding rates of .02 mL per minute are accurately detected. Although the accuracy of endoscopic diagnosis of upper GI bleeding is greater than 90%, tagged red blood cells are the agent of choice for diagnosis in slow or intermittent bleeding, with sensitivity of greater than 90%.


RADIOGRAPHIC ANATOMY


Boundaries of the Abdomen

The abdomen includes all of the structures contained within the transversalis fascia and extends from the diaphragm to the pelvis. It is divided by the peritoneum into a peritoneal cavity and several extraperitoneal spaces.

The rectus abdominis muscle comprises the anterior portion of the abdominal wall. This muscle extends from the xiphoid process and costal cartilages of the fifth through seventh ribs to attach inferiorly on the pubic symphysis. From superficial to deep the external oblique, internal oblique and transversus abdominis muscles form the lateral abdominal wall from its anterolateral to its posterolateral extent. The transversalis fascia arises from the transverse abdominis muscles and surrounds the entire abdomen. The posterior abdominal wall is made up of the latissimus dorsi muscles located laterally and the erector spinae muscles located medially (Fig. 14.1). A variably thick fat layer external to the peritoneum surrounds the peritoneal cavity anteriorly, laterally, and posteriorly (Fig. 14.2). On conventional AP radiographs, the extraperitoneal fat between the transversalis fascia and the peritoneum is visible as the “flank stripe” described by Frimann-Dahl (Figs. 14.3 and 14.4). Normally, the ascending and descending colon are adjacent to the flank stripe. Processes that thicken the colonic wall or fill the peritoneal space between the colon and the parietal peritoneum (the paracolic gutter) displace the colon away from the flank stripe. The flank stripe is not visible in infants with a normal
protuberant abdomen, debilitated patients, or patients with little body fat.


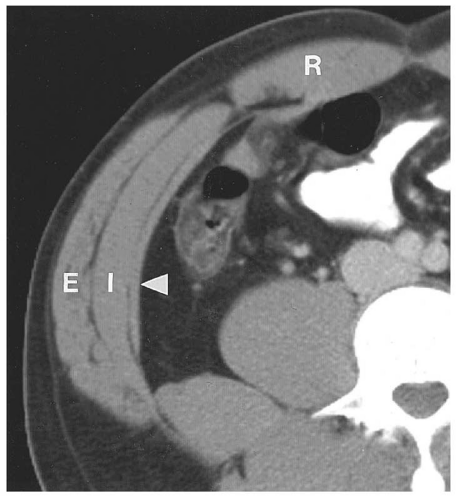
Figure 14.1. CT of the abdominal wall. CT image at the level of the upper portion of the umbilicus shows the muscles of the abdominal wall: external oblique (E), internal oblique (I), and transversus abdominis (arrowhead). The rectus abdominis muscle (R) is seen anteriorly closer to the midline.


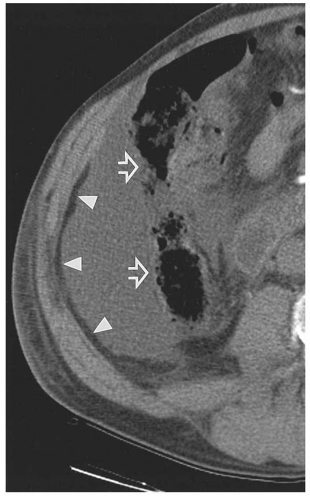
Figure 14.2. Fluid in the paracolic gutter. CT shows a collection of fluid in the right paracolic gutter displacing the ascending colon and hepatic flexure medially. The displacement is accentuated by the absence of the right kidney in this individual. The increased distance between the flank stripe (white arrowheads) and the lateral wall of the colon (open arrows) was evident on a conventional radiograph.


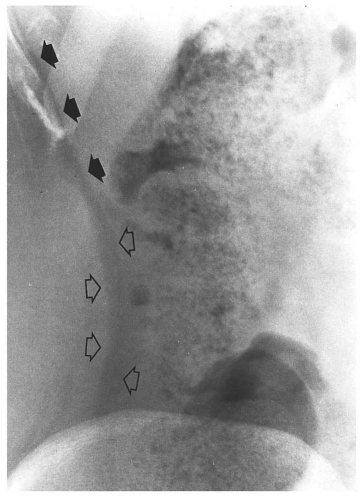
Figure 14.3. Radiographic appearance of the soft tissues of the right flank. The extraperitoneal fat (“flank stripe”) produces the sharply defined, gently curved lucent band (open arrows) extending from below the iliac crest to above the lateral margin of the liver (solid arrows). Gas and feces identify the ascending colon and the hepatic flexure and outline the inferior margin of the liver.

Superiorly, the abdomen is bounded by the diaphragm. The central tendon, the highest and thinnest part of the diaphragm, is located anterior to the inferior vena cava (IVC) and forms the margins of the esophageal hiatus. The radiographic appearance of the diaphragm depends on the patient’s body habitus. Typically, the right hemidiaphragm is higher than the left, but the reverse situation is normal. Posteriorly, the diaphragm attaches to the lumbar spine via the right and left diaphragmatic crura. Posterior to the crura is the retrocrural space, bounded posteriorly by the lumbar vertebrae, through which pass the aorta and the azygos and hemiazygos veins (Fig. 14.5A).


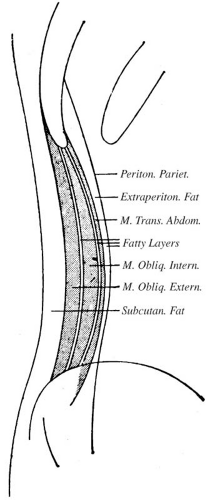
Figure 14.4. Schematic drawing of the soft tissues of the flank. The extraperitoneal (preperitoneal, properitoneal, and retroperitoneal) fat produces the lucent shadow of the flank stripe. (From Soyer P. Segmental anatomy of the liver: utility of a nomenclature accepted worldwide. Am J Roentgenol. 1993;161(3):572-573, with permission.)


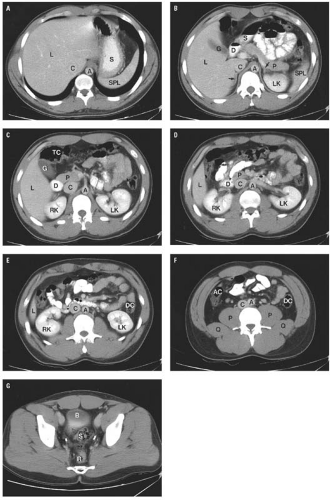
Figure 14.5. Normal CT anatomy. A: Diaphragmatic hiatus. Note the collapsed esophagus immediately anterior to the aorta. L, liver; C, inferior vena cava; A, aorta; S, stomach; SPL, spleen. B: The pancreatic body and tail are located immediately anterior to the splenic vein. Note the superior end of the gallbladder fossa, which is located immediately caudal to the interlobar fissure. An air-oral contrast material level is present in the second portion of the duodenum. Both adrenal glands are visible in this section (arrows). L, liver; G, gallbladder; D, duodenum; C, inferior vena cava; S, stomach; A, aorta; P, pancreatic tail; LK, left kidney; SPL, spleen. C: Pancreatic head. At the level of the superior mesenteric artery origin, an elongated but homogeneous pancreatic head has no contour abnormalities. The duodenum is filled with contrast material on this image. Note the close relationship between the hepatic flexure, the gallbladder, and the liver. L, liver; G, gallbladder; TC, transverse colon; D, duodenum; RK, right kidney; P, pancreatic head; C, inferior vena cava; S, stomach; A, aorta; LK, left kidney. D: The third portion of the duodenum. Note the contrast-filled duodenum crossing anterior to the inferior vena cava and the aorta immediately posterior to the superior mesenteric artery and vein at the upper end of the root of the small bowel mesentery. L, liver; RK, right kidney; D, duodenum; P, pancreatic head; C, inferior vena cava; A, aorta; LK, left kidney. E: Kidneys. Image at the level of the left splenic vein shows the inferior portion of the right lobe of the liver. The superior mesenteric vein and artery are visible in the root of the small bowel mesentery. L, liver; RK, right kidney; C, inferior vena cava; A, aorta; DC, descending colon; LK, left kidney. F: Paracolic gutters. In the normal individual, the paracolic gutter is a potential space between the parietal peritoneum of the body wall and the visceral peritoneum surrounding the ascending and descending colon. Note the multiple small arteries and veins coursing through the mesentery. AC, ascending colon; P, psoas muscle; Q, quadratus lumborum muscle; C, inferior vena cava; A, aorta; DC, descending colon. G: Peritoneal reflection. This image is below the anterior surface of the peritoneal reflection where the parietal peritoneum covers the dome of the bladder. B, bladder; S, sigmoid colon; R, rectum.


Inferiorly, the peritoneal cavity is bounded by the pelvic peritoneal reflection, which contains the pelvic loops of ileum (Fig. 14.5G).


The Peritoneal Spaces

The peritoneal cavity is divided into recesses, based on the proximity of adjacent structures and the complex embryology of each region (Fig. 14.6). The right peritoneal space includes the right perihepatic space and the lesser sac. The right perihepatic space surrounds the right lobe of the liver from the falciform ligament anteriorly to the coronary ligament, which surrounds the large, nonperitonealized, bare area of the liver. More caudally, the right perihepatic space surrounds the right lobe of the liver and forms a posterior recess (Morrison pouch) between the liver and the upper pole of the right kidney. The lesser sac is bounded by the stomach anteriorly, the porta hepatis on the right, the spleen on the left, and the pancreas posteriorly.

The left peritoneal space surrounds the left lobe of the liver from the falciform ligament to the left abdominal wall. Anteriorly, the space is termed the anterior left perihepatic space and posteriorly, the posterior left perihepatic space. The lateral extension of the left peritoneal space between the stomach and the diaphragm is called the left anterior subphrenic space. Further, posteriorly and laterally is the posterior subphrenic space, also termed the perisplenic space, which surrounds the spleen.

Caudal to Morrison pouch and the spleen, the peritoneal cavity does not have separate compartments, except for the paracolic gutters (Fig. 14.5F). In the pelvis, the peritoneum continues as an inferior recess (Fig. 14.5G). In men, this recess is termed the rectovesical pouch. In women, the recess is called the rectouterine pouch (pouch of Douglas) and the shallower, more anterior vesicouterine space.

The peritoneal spaces are easily defined on CT scans, and many of the compartments of the peritoneal cavity are visible by US. Although the peritoneal space is not directly visible on radiographs, the fat of the flank stripes and the perivesical fat between the peritoneum and the bladder serve mark the parietal peritoneum.


The Extraperitoneal Spaces

The extraperitoneal spaces are contained within the transversalis fascia but are outside the peritoneum. Although a large proportion of the retroperitoneum
is fat between other structures, the retroperitoneum also contains the great vessels, pancreas, portions of the duodenum and colon, the adrenal glands, kidneys, ureters, and bladder. The extraperitoneal spaces extend from the diaphragm to the floor of the pelvis and wrap around the entire peritoneal cavity. They are divided into the abdominal retroperitoneum, which is the subject of this section, and the pelvic perivesical space, which is described in conjunction with normal anatomy of the pelvis in Chapters 15 and 17.


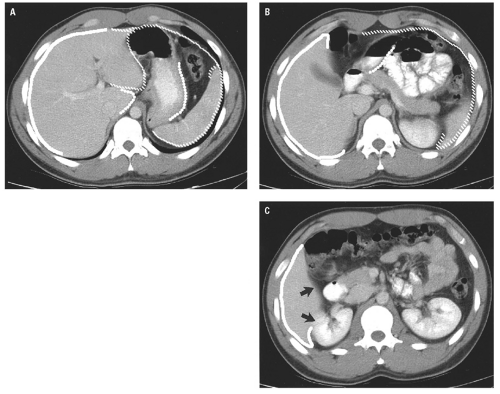
Figure 14.6. Peritoneal spaces. A: The heavy white line outlines the right perihepatic space. The hash marks outline the left peritoneal space, which is made up of the anterior left perihepatic space, the posterior left perihepatic space, and the perisplenic space. The series of dots outlines portions of the lesser sac around the caudate lobe and posterior to the stomach. B: At a lower level, the right perihepatic space, outlined by the heavy white line, is limited posteriorly by the coronary ligament, which defines the bare area of the liver. The left posterior hepatic space has ended below the liver. A small portion of the lesser sac is visible between the stomach and the pancreas. C: Caudally, the right perihepatic space continues as the hepatorenal recess (Morrison pouch) (arrows) between the liver and the right kidney.

Detailed description of the retroperitoneum is beyond the scope of this chapter; however, a basic understanding of the compartments within the retroperitoneum is essential in understanding the possible distribution of blood, pus, or fluid through the retroperitoneum. The aorta and IVC and their segmental and distal branches course through the retroperitoneum anterior to the vertebral bodies. Hemorrhage from these central vessels may extend throughout the retroperitoneum via the retroperitoneal fasciae.

At the level of the kidneys and pancreas, the retroperitoneum is divided into several compartments. The thin anterior and thicker posterior renal (Gerota) fasciae surround the kidneys. The anterior and posterior renal fasciae fuse laterally to form the lateroconal fascia, which extends anteriorly to fuse with the parietal peritoneum lateral to the ascending and descending colon (Fig. 14.7). Inside the renal fascia, the perirenal space contains the kidney, the adrenal gland, and perirenal fat. Below the kidneys, the perirenal space tapers in the shape of a cone (Fig. 14.8).

The posterior pararenal space is lateral to the lateroconal fascia and posterior to the posterior
renal fascia and contains only fat. This space becomes important when inflammatory processes track into it.


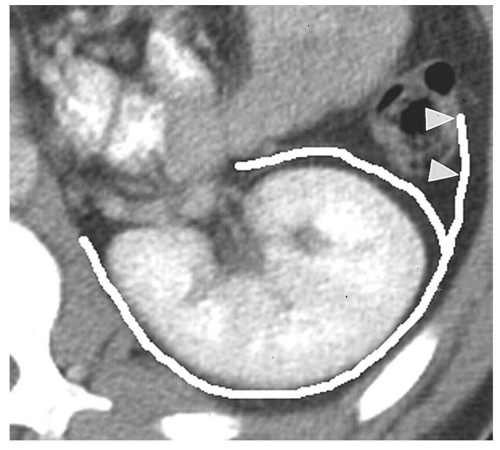
Figure 14.7. Perirenal space. The heavy white line outlines the renal fascia, which merges with the lateroconal fascia extending anteriorly to the descending colon (arrowheads).

The anterior pararenal space, lying between the anterior renal fascia and the posterior peritoneum, is continuous across the midline and contains most of the duodenum, the ascending and descending colon, and the pancreas (Fig. 14.5B-E). The anterior pararenal space communicates readily with several peritoneal ligaments: the small bowel mesentery; the transverse mesocolon; the phrenicocolic, duodenocolic, and splenorenal ligaments; and the lesser omentum.


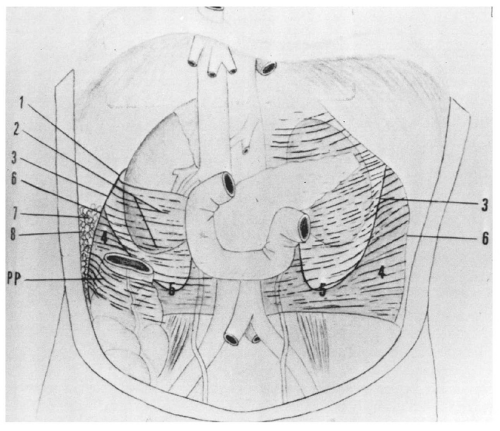
Figure 14.8. Schematic representation of the retroperitoneal compartments. This drawing clearly illustrates the conical configuration of the inferior portion of the perirenal space (5). Other extraperitoneal structures represented include the posterior renal fascia (1), anterior renal fascia (2), line of fusion of anterior and posterior renal fasciae (3), lateroconal fascia (4), line of fusion of lateroconal fascia with posterior parietal peritoneum (6), posterior pararenal fat extending into the flank stripe (7), transverse fascia (8), and parietal peritoneum (PP). (From Meyers MA, Whalen JP, Peelle K, et al. Radiologic features of extraperitoneal effusions. An anatomic approach. Radiology. 1972;104(2):249-257, with permission.)

The psoas muscle and the quadratus lumborum muscles (Fig. 14.5F) communicate with the extraperitoneal spaces, allowing hematomas and fluid collections to track along these muscles.


Major Vessels

The abdominal aorta descends through the diaphragmatic hiatus in the retrocrural space to the left of midline at the ventral aspect of the lumbar vertebrae. At the L4 level, it bifurcates into the common iliac arteries. The normal aortic diameter does not exceed 3 cm and tapers progressively below the renal arteries. The common iliac arteries bifurcate at the pelvic brim into external and internal iliac arteries. The external iliac arteries extend anteriorly to the inguinal triangle, and the internal iliac arteries supply the pelvis.

The celiac axis originates at the level of the diaphragmatic hiatus (Figs. 14.9A and 14.9B). One centimeter inferiorly, the superior mesenteric

artery arises from the anterior surface of the aorta (Fig. 14.9C). One centimeter below this, the renal arteries arise from the lateral aspects of the aorta (Fig. 14.9D). Just above the aortic bifurcation, the small inferior mesenteric artery arises from the anterior wall of the aorta (Fig. 14.9E).


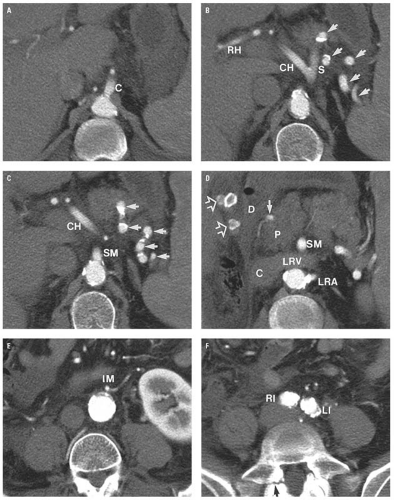
Figure 14.9. Abdominal vascular anatomy. A: Origin of the celiac axis (C) at the inferior margin of the diaphragmatic hiatus. B: Division of the celiac axis into common hepatic (CH) and splenic (S) arteries. Note the splenic artery coursing in and out of the plane of section (arrows). The right hepatic (RH) artery is visible in the porta hepatis. The third division of the celiac axis, the left gastric artery, is not visible on the section. C: Superior mesenteric (SM) artery origin 1.3 cm caudal to the celiac axis origin. The splenic artery is also visible (arrows).CH is the common hepatic artery. D: Origin of the left renal artery (LRA). The right kidney is absent. The superior mesenteric (SM) artery passes anterior to the left renal vein (LRV). The gastroduodenal artery (solid arrow) passes along the anterior margin of the pancreatic head. Several faceted rim-calcified gallstones (open arrows) are seen in the gallbladder. E: The inferior mesenteric (IM) artery originated from the anterior wall of the aorta on the image immediately cephalad to this one; on this image, the inferior mesenteric artery tracks to the left of midline. F: Aortic bifurcation at the L4-5 disc level. The irregularity of the common iliac artery walls and the aortic lumen is due to atherosclerosis. The aorta bifurcates into right (RI) and left (LI) common iliac arteries. There is a pars interarticularis defect on the right side of L5 (arrow).

The IVC is formed by the confluence of the two common iliac veins at the L5 level, and it courses over the right common iliac artery and ascends to the right of the abdominal aorta. The IVC passes through the substance of the liver before passing through the diaphragm to drain into the right atrium. The size and shape of the IVC vary considerably based on intravascular volume, phase of respiration, and the presence or absence of IVC obstruction. The renal veins join the IVC at approximately the same level as the corresponding renal arteries. The right renal vein is shorter, whereas the left renal vein, which passes anterior to the aorta, is longer. The left renal vein receives the left gonadal vein.


Solid Organs


Liver and Biliary Tract

The liver fills much of the right upper quadrant of the abdomen, extending from the diaphragm to a point near or even below the right iliac crest. Its size and shape are quite variable. On conventional radiographs, the diagnosis of hepatomegaly should be reserved for instances in which the liver displaces adjacent structures. The size of the liver is readily measured by CT.

The liver is divided into lobes, segments, and subsegments based on its vascular anatomy. A line extended anteriorly and inferiorly from the middle hepatic vein separates the right and left hepatic lobes. The lobes are easy to separate in patients who have a well-defined interlobar fissure along the inferior margin of the liver, which then extends inferiorly as the gallbladder fossa. The large right lobe of the liver is divided into anterior and posterior segments by an imaginary line extended outward from the right hepatic vein to the lateral surface of the liver. The left hepatic lobe is typically much smaller than the right and is divided into lateral and medial segments by a line drawn from the left hepatic vein to the falciform ligament. Each of the four liver segments, which constitute the right and left lobes, is further divided into subsegments based on position above or below the portal venous confluence. The caudate lobe has a separate vascular supply and is a separate posteromedial lobe of the liver adjacent to the IVC. Couinaud and Bismuth designed a widely used system of numbered segments based on these anatomic subdivisions (Table 14.3; Fig. 14.10). Routine use of this system to describe hepatic pathology reduces ambiguity in communication and assists in surgical planning.

The gallbladder fossa lies at the inferior extent of the interlobar fissure of the liver. In the fasting state, the fully distended gallbladder has a thin wall, measuring no more than 3 mm in thickness (Figs. 11A and 11.B). The gallbladder’s length is variable but rarely exceeds 10 cm. The gallbladder is circular in cross section.

Biliary anatomy can be evaluated either by US or CT scan (Fig. 14.12). In cross section, the hepatic ducts are usually located immediately anterior to the portal vein within the substance of the liver

(Fig. 14.13A). Caudally, the common hepatic duct (CHD) is seen anterolateral to the main portal vein. The hepatic artery lies anteromedial to the main portal vein. In cross section, both the CHD and hepatic artery appear as small, round structures, anterior to the portal vein. On the transverse view, the appearance of the CHD, hepatic artery, and portal vein has been likened to Mickey Mouse (Fig. 14.13B) and provides a frame of reference for longitudinal imaging of the CHD and common bile duct. A long segment of the bile duct may be demonstrated longitudinally, anterior to the portal vein (Fig. 14.13C). A portion of the hepatic artery is often seen in cross section between the bile duct and the portal vein. The size of the CHD varies with age and increases slightly after cholecystectomy. Generally, 6 mm is taken as the upper limit of the normal diameter of the CHD in adults. In adults older than 75 years, 10 mm is the upper limit of normal, whereas in children, 3 mm is the upper limit of normal. Distally, the common bile duct shows even greater variability in caliber and may be up to 3 mm larger than the CHD.


TABLE 14.3 Couinaud-Bismuth Segments and Corresponding Liver Anatomy


Couinaud-Bismuth Segment


Lobe


Segment


Subsegmenta


I


Caudate


II


Left


Lateral


Superior


III


Left


Lateral


Inferior


IVa


Left


Medial


Superior


IVb


Left


Medial


Inferior


V


Right


Anterior


Inferior


VI


Right


Posterior


Inferior


VII


Right


Posterior


Superior


VIII


Right


Anterior


Superior


a Superior or inferior to the transverse scissura (i.e., portal vein confluence).


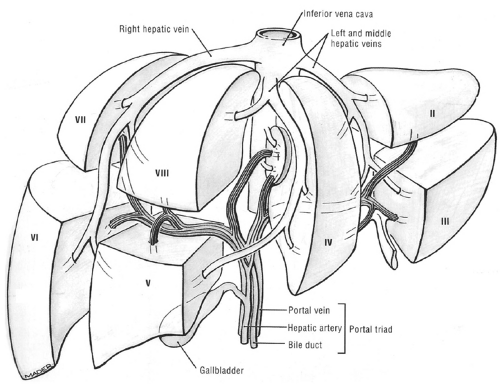
Figure 14.10. Segmental and vascular anatomy of the liver. Each segment of the liver is supplied by a branch of the hepatic artery, bile duct, and portal vein. The hepatic veins do not follow the structures of the portal triad and are considered intersegmental in that they drain portions of adjacent segments. (From Agur AMR. The abdomen. In: Grant’s Atlas of Anatomy. 9th ed. Baltimore, MD: Lippincott Williams & Wilkins; 1991:115, with permission.)


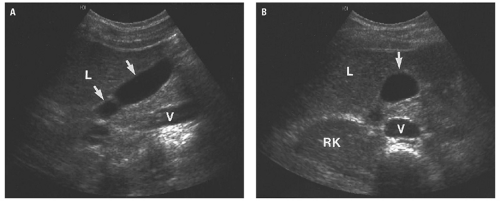
Figure 14.11. Normal gallbladder. Longitudinal (A) and transverse (B) ultrasound images of a normal gallbladder (arrows) within the gallbladder fossa immediately posterior to the liver (L). V, inferior vena cava; RK, right kidney.


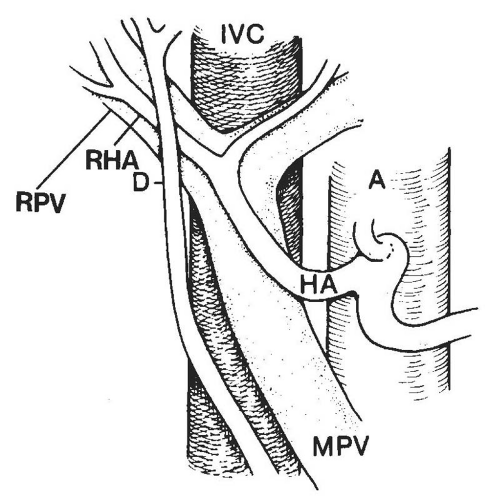
Figure 14.12. Schematic representation of the normal porta hepatis and their relationships to the inferior vena cava (IVC). The structures of the porta hepatis bear a constant relationship to each other. The common hepatic duct (D) lies lateral to the proper hepatic artery (HA) and crosses anterior to the right hepatic artery (RHA) and right portal vein (RPV). MPV, main portal vein; A, aorta. These relationships may be readily appreciated on both ultrasound and CT. (From Zeman RK, Simeone JF. The biliary ducts: anatomy, examination, technique and pathophysiologic considerations. In: Taveras JM, Ferrucci JT, eds. Radiology: Diagnosis, Imaging, Intervention. Vol 4. Philadelphia, PA: JB Lippincott; 1998:1-18. Modified from Zeman RK, Burrell MI. Gallbladder and Bile Duct Imaging: a Clinical Radiologic Approach. New York, NY: Churchill Livingstone; 1987, with permission.

CT scans illustrate the biliary anatomy well. CT demonstration of the ducts may be limited by motion artifact. On CT, the gallbladder is filled with bile that has an attenuation value near that of water (0 to 20 Hounsfield units [HU]). The gallbladder wall is 1 to 3 mm in thickness, and it often enhances after the administration of IV
contrast material. CT usually demonstrates the common bile duct passing through the head of the pancreas.


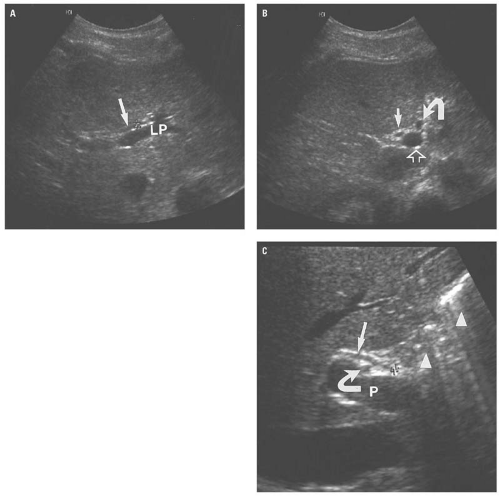
Figure 14.13. Ultrasound anatomy of the bile ducts. A: Transverse image through the porta hepatis at the left portal (LP) vein shows a normal caliber left hepatic duct (arrow) measuring 2 mm in diameter. Note that peripheral intrahepatic ducts are not visible. B: Transverse image through the porta hepatis as it exits the liver shows the “Mickey Mouse” appearance of the porta hepatis in a normal patient. The “head” is the portal vein (open arrow), the “right” (lateral) ear represents the common hepatic duct (straight arrow), and the “left” (medial) ear represents the hepatic artery (curved arrow). Use of these landmarks can help in tracing the common duct through the porta hepatis. C: Longitudinal image through the extrahepatic bile duct shows the common duct (electronic cursor and straight arrow) measuring 1 mm in diameter. The main portal vein (P) is located posterior to the common duct. The right hepatic artery (curved arrow) is visible between the common duct and the main portal vein. Note the “dirty shadows” from a bowel loop located posterior and inferior to the liver (arrowheads).


Spleen

The spleen is located in the left upper quadrant of the abdomen along the lateral and posterior aspects of the left hemidiaphragm. The anterior medial border of the spleen abuts the stomach. Inferiorly, the posterior medial surface of the spleen is near the upper pole of the left kidney and the anterior surface is near the descending colon. The shape of the spleen is variable, but it is a crescentic, pliable organ that is much longer than it is thick. Clefts are common and may be as deep as 2 or 3 cm and are typically located along the upper surface of the spleen. Occasionally, small lobules of splenic tissue (accessory spleens) are encountered near the spleen, often near the hilum. The spleen is enhanced with IV contrast. Early after administration of the bolus of contrast material, the enhancement pattern is heterogeneous and may simulate splenic injury or other pathology (Fig. 14.14). After 60 seconds, the enhancement becomes homogeneous in a normal spleen.


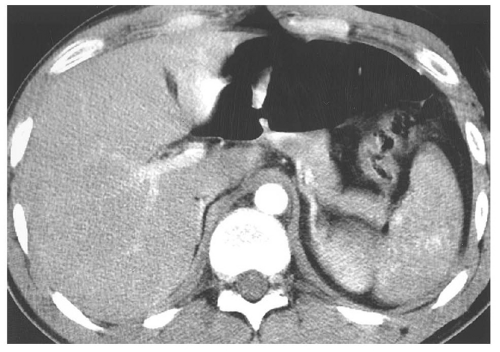
Figure 14.14. Early bolus effect in the spleen. CT image through the inferior portion of the spleen shows mottled central enhancement of the spleen with unenhancing parenchyma peripherally. This image was made 30 seconds after the beginning of the bolus of contrast material because of a technical error.


Pancreas

The pancreas is located deep in the epigastrium anterior to the lumbar vertebrae within the anterior pararenal space (Figs. 14.5B and 14.5C). The duodenum surrounds its head. The portal vein crosses anterior to its neck. A portion of the body and tail of the pancreas lies anterior to the splenic vein. The tip of the tail is often found adjacent to the splenic hilum near the anterior margin of the left kidney. The splenic artery follows a serpentine course superior and anterior to the pancreas. The normal pancreas is not visible on conventional radiography but is readily seen on CT scans, and it may be visible by US using an acoustic window between gas-filled bowel loops. The pancreatic duct is frequently visible on helical CT images, varying in diameter from 3 to 6 mm. The size of the pancreas is highly variable; thus, pancreatic pathology is detected by the presence of mass or heterogeneity in contrast enhancement rather than by measurement of the size of the pancreas.


Adrenal Glands

The adrenal glands are located cephalad and slightly anterior to the upper pole of each kidney (Fig. 14.5B). The adrenal glands are readily seen by CT and are well seen with US. The configuration of the adrenal glands is variable; typically, the right adrenal gland can be seen as an inverted “U”, directed anteriorly and located between the medial aspect of the liver and the right crus of the diaphragm. The left adrenal most often has an inverted “V” configuration and is located between the fundus of the stomach and the left crus of the diaphragm. The limbs of the adrenal are variable in length but have a uniform thickness and shape. Adrenal masses are identified as nodular protrusions from the normal contour. An adrenal limb thicker than 10 mm is considered abnormal.


Urinary Tract

The kidneys are frequently visible on conventional radiographs because they are surrounded by perinephric fat. Overlying bowel contents may obscure them. Ninety percent of the time, the left kidney is higher than the right. Congenital absence of a kidney occurs in 1 in 700 individuals. When one kidney is absent or hypoplastic, the remaining kidney demonstrates compensatory hypertrophy. When visible, the adult renal shadow measures 12 to 14 cm in length, with the disparity in length between the kidneys not exceeding 1.5 to 2.0 cm.

The kidney consists of renal parenchyma surrounding a central renal pelvis. The parenchyma is divided into an outer cortex and an inner medulla, consisting of several renal pyramids whose apices project into the renal pelvis. Both CT and US are used to evaluate the kidneys. In the first 60 seconds after IV contrast medium injection, the enhancement of the cortex is greater than the enhancement of the medulla. After a 2-minute delay, the medulla may be more intensely enhanced than the cortex. Between 3 and 5 minutes after injection, contrast appears in the collecting system. The renal artery and vein pass anterior to the renal pelvis and divide into segmental branches supplying the renal parenchyma.

The ureters arise from the renal pelvis and extend through the medial aspect of the perirenal space and then continue caudally lateral to the great vessels. As they cross the pelvic brim, they track posterolaterally through the true pelvis to enter the trigone of the bladder from a posterolateral approach. The ureters are extraperitoneal along their entire course. Normal ureters can be identified on unenhanced CT scanning by tracing them on sequential, adjacent images from the renal pelvis. The ureters are readily visible when filled with opacified urine after IV administration of contrast material. The segments of the ureters that are best seen by US are the ureteropelvic junction and at the ureterovesicular junction. Ureteral peristalsis causes segmental variation
in the caliber of the ureter through its course from the renal pelvis to the bladder.


Gastrointestinal Tract

The bowel gas normally present in the intestinal tract frequently aids in the recognition of GI pathology, both by conventional radiography and CT. However, bowel gas is undesirable for US because it causes shadows that obscure structures deep to the gas.

Gas is almost always present within the stomach. Gas migrates to the least dependent position within the stomach with a change in body position. On a supine radiograph, the gas is located in the body and/or antrum of the stomach (Fig. 14.15). In the erect position, the gas migrates into the gastric fundus. The stomach can be distinguished from the splenic flexure of the colon by the gastric rugal folds, which are outlined by gas in the stomach. The distance between the stomach bubble and the upper margin of the left hemidiaphragm on the erect radiograph increases due to mass effect of free intraperitoneal air. This is a useful tool in distinguishing between a normal stomach bubble and pneumoperitoneum under the left hemidiaphragm.

Gas is frequently present in the duodenal bulb in normal individuals. This gas bubble is located adjacent to the inferior edge of the liver in the right upper quadrant. The remainder of the duodenum is not typically gas filled. Gas is normally present in the small bowel in greater quantities in patients presenting with abdominal pain but in lesser quantities in ambulatory, asymptomatic patients. Normal gasfilled small bowel loops are typically less than 3 cm in diameter. Analysis of the pattern of small bowel gas is more important than the diameter of individual small bowel loops. On the erect radiograph, a few air-fluid levels may be apparent in the normal, nonobstructed small bowel.


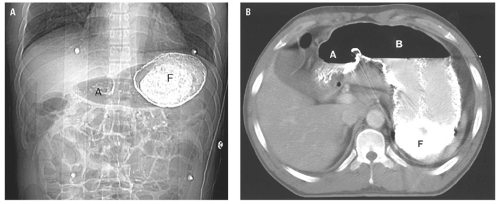
Figure 14.15. Stomach anatomy. A: Supine scout image for abdominal CT shows barium in the gastric fundus (F) and air in the gastric antrum (A). B: CT image through the stomach shows dense barium in the gastric fundus, barium mixed with gastric fluid in the dependent portion of the body, and air in the nondependent portion of the gastric body (B) and gastric antrum (A).

In the normally functioning colon, liquid feces should not be present beyond the splenic flexure. On the supine radiograph, gas collects in the least dependent portions of the bowel, which include the transverse colon and portions of the ascending and descending colon. The cecum is often recognizable by the bubbly appearance of its liquid contents. The rectum is the most dependent part of the bowel and may empty normally. Thus, the absence of gas in the rectum is not a definitive indicator of bowel obstruction. On the erect radiograph, colonic gas will migrate upward into the hepatic and splenic flexures. Air-fluid levels are normally encountered in the fluid-filled ascending or transverse segments of the colon.

CT provides a more detailed evaluation of the bowel than conventional radiographs. The same principles of bowel dilatation that form the basis of conventional radiographic diagnosis should be used in evaluating the CT images. The small bowel and colon are further evaluated by assessment
of the passage of liquid contrast material. The appearance of the small bowel is variable and depends on the degree of distention by gas or contrast material. The normal, nondistended small bowel wall is thick, but when completely distended by gas or contrast material, the wall measures no more than 3 mm in thickness. The colon is usually not well distended, so wall thickness is difficult to assess; however, when distended, the colon wall is typically less than 3 mm thick.

Using 2.5 mm MRCT technique and colonic distention with rectal contrast material, the appendix can be identified in most individuals. The appendix originates from the medial side of the apex of the cecum. The wall of the appendix is no more than 3 mm thick and no more than 6 mm in diameter. The normal appendix usually has no luminal contents but may contain a small amount of gas. GI contrast material administered before CT scanning may fill the normal appendix.

US has limited use in evaluation of the bowel, but it is useful in evaluating the appendix, particularly in thin patients. Using graded compression technique and a high-resolution transducer, the normal appendix may be identified originating from the cecal tip as a thin, blind-ending, nonperistaltic bowel segment (Fig. 14.16). The submucosa located centrally within the appendix is echogenic and is surrounded by the hypoechoic muscularis. By sonography, the normal appendix is less than 5 mm in diameter when compressed.


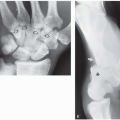
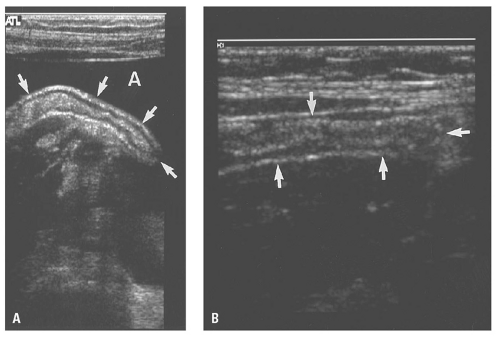
Figure 14.16. Ultrasound of the normal appendix. A: Longitudinal ultrasound image in a child with ascites (A) allows unusually clear visualization of the normal appendix (arrows). Note the echogenic submucosa, the hypoechoic muscularis, and echogenic serosa. B: Longitudinal ultrasound image of a normal appendix (arrows) in a child shows similar ultrasonographic features, but the surrounding echogenic abdominal wall makes the normal appendix more difficult to see. (Case courtesy of Cynthia I. Caskey, MD.)


NONTRAUMATIC EMERGENCY CONDITIONS


Peritoneal Cavity


Pneumoperitoneum

Pneumoperitoneum most often results from recent abdominal laparotomy or laparoscopy; it usually resolves 3 to 7 days after the procedure but may be present for as long as 4 weeks. Spontaneous pneumoperitoneum is most often due to perforation of a gastric or duodenal ulcer, but it occurs less frequently from perforation of the remainder of the small bowel and intraperitoneal portions of the colon. Even less frequently, air migrates to the peritoneal cavity from the chest secondary to pneumomediastinum or pneumothorax through pores in the diaphragm. Rarely, pneumoperitoneum occurs as the result of perforation of the small bowel affected with pneumatosis intestinalis. CT is the most sensitive means to detect small amounts of free intraperitoneal air. Although unenhanced helical CT has been advocated as the initial diagnostic tool in the evaluation of acute abdominal pain, this approach is not widely used. Instead, chest and abdominal radiographs usually constitute the initial diagnostic examination (Fig. 14.17). The smallest collections of free air will be seen on a properly exposed horizontal beam (cross-table) lateral view as crescents of air located between the anterior surface of the liver and the diaphragm.


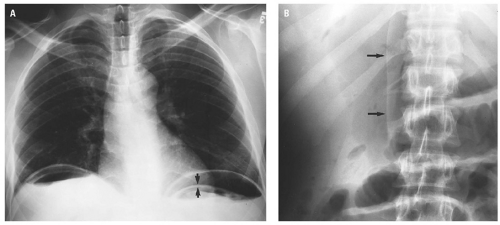
Figure 14.17. Pneumoperitoneum on erect radiograph. A: PA erect chest radiograph shows free intraperitoneal air beneath each hemidiaphragm. Note air outlining both sides of the stomach (arrows). B: In the same patient, the close-up view AP supine abdominal radiograph shows the falciform ligament (arrows) outlined by free air.

In patients unable to stand, the left decubitus view should be obtained. As noted previously in the conventional abdominal radiography technique section, proper positioning and exposure is critical. On the decubitus view, air will be demonstrated in the right perihepatic space (Figs. 14.18 and 14.19). Occasionally, in patients with a very broad pelvis, the decubitus view may show air collecting along the right parietal peritoneal margin in the pelvis (Fig. 14.18).


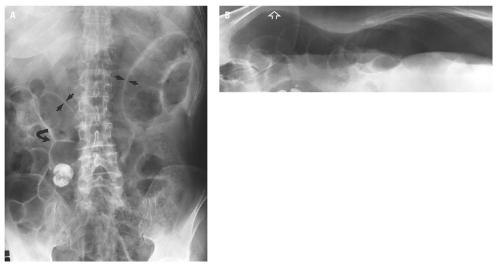
Figure 14.18. A: Supine view of the abdomen in a patient with massive pneumoperitoneum shows that both sides of several bowel loops are outlined by air in both the right and left upper quadrants (arrows). The triangular gas bubble between adjacent bowel loops (curved arrow) is Rigler triangle. This may be the only sign of a less extensive pneumoperitoneum. B: Right side up decubitus view of the abdomen shows the possible locations for free intraperitoneal air in the right perihepatic space and in the right side of the pelvis (open arrow). Note air outlining several small bowel loops and an air-ascites level within the peritoneal cavity.

Although the upright or decubitus view readily demonstrates free intraperitoneal air, free air may be diagnosed on a supine radiograph alone. An “anterior-superior bubble” positioned in the
medial half of the right upper quadrant of the abdomen below the hemidiaphragm is the most frequent juxtahepatic pattern of pneumoperitoneum (Fig. 14.17B). Other right upper quadrant signs include visualization of the falciform ligament as a thin linear density over the liver (Figs. 14.17B and 14.20); air within the hepatorenal recess (Morrison pouch) (Fig. 14.19A); extraluminal air outlining the serosal surface of bowel loops (Rigler sign) (Fig. 14.18); and a large, lucent, oval air collection in the midabdomen (football sign) (Fig. 14.20).


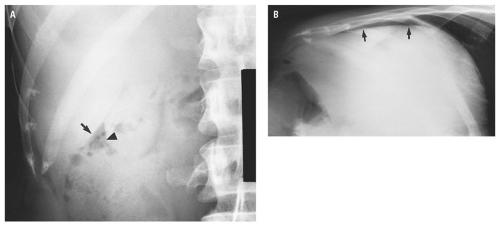
Figure 14.19. Pneumoperitoneum due to perforated duodenal ulcer. A: Supine radiograph shows free air between the liver edge (arrow) and the outer margin of the gallbladder fundus (arrowhead). B: Right side up decubitus radiograph shows free intraperitoneal air in the right perihepatic space (arrows).


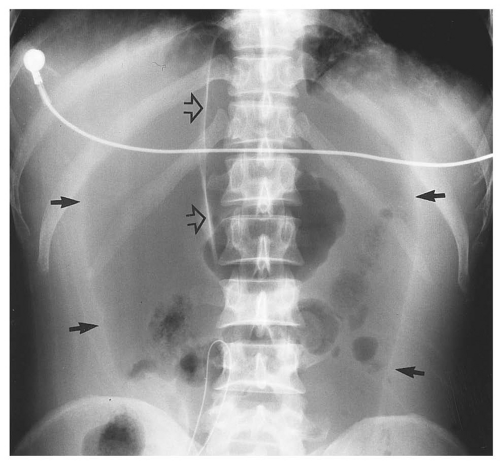
Figure 14.20. Massive pneumoperitoneum with demonstration of the falciform ligament (open arrows) outlined by air. The large collection of air in the midabdomen is described as a “football” sign (solid arrows).

On CT, pneumoperitoneum collects in the recess between the rectus muscles and the anterolateral abdominal wall (Fig. 14.21). Air also collects between the liver and the anterior abdominal wall within the mesentery, lesser sac, or Morrison
pouch. Findings can be subtle, with pneumoperitoneum manifesting as only a few trapped air bubbles in the mesentery. Wide window settings of more than 750 HU can help detect subtle air collections.


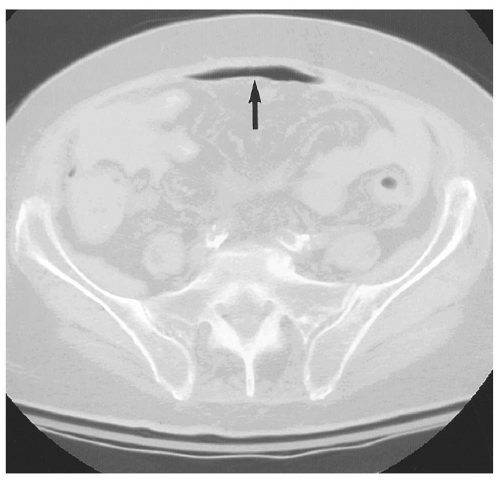
Figure 14.21. Pneumoperitoneum on CT. CT image through the midabdomen displayed at lung windows shows a collection of free intraperitoneal air (arrow) under the anterior abdominal wall in the least dependent part of the abdomen.

Radiography is the recommended initial test for the evaluation of possible bowel perforation. CT scanning is more sensitive for detection of small air collections and should be performed when wellexposed conventional radiographs are negative, but the patient’s symptoms are suggestive of bowel perforation.


Ascites

The transudation or exudation of fluid into the peritoneal cavity is protean in etiology. Conventional radiography, US, or CT may demonstrate the presence of fluid within the peritoneal cavity. Although the attenuation value of a transudate is typically 0 to 30 HU and that of an exudate is greater than 30 HU, measurement of attenuation value is not an adequate test to distinguish transudate from exudate; biochemical analysis of the fluid is required for this purpose.

On conventional radiographs, ascites causes increased soft tissue density between the flank stripe and the colon. When present in large amounts, it causes the bowel to float to the middle of the abdomen, elevated from the pelvic floor, becoming centralized relative to the surrounding peripheral fluid density (Fig. 14.22). Large amounts of fluid give the abdomen a homogeneously gray, “ground-glass” appearance. Normal soft tissue shadows of the liver margin or renal or psoas shadows may be obliterated or obscured by ascites.


Peritonitis

In peritonitis, conventional radiographs show ascites and may show blurring of the flank stripe. CT signs of diffuse peritonitis include ascites, thickening and enhancement of the peritoneum, and inflammatory infiltration of the mesenteric and omental fat (Fig. 14.23). Similar findings are seen in patients with intraperitoneal carcinomatosis.


Intra-abdominal Abscess

Intra-abdominal abscess most frequently develops following abdominal surgery but also occurs as a complication of appendicitis, diverticulitis, Crohn disease, biliary sepsis, and other systemic infections. Most intra-abdominal abscesses occur in the liver, subphrenic spaces, and pelvis, but they may occur anywhere in the peritoneal cavity or extraperitoneal spaces. CT is the imaging modality of choice. Oral administration of contrast material is very important to opacify bowel loops, eliminating the possibility that an abscess will be mistaken for an unopacified bowel loop. Dilute barium solution should be given orally even when IV contrast is contraindicated.


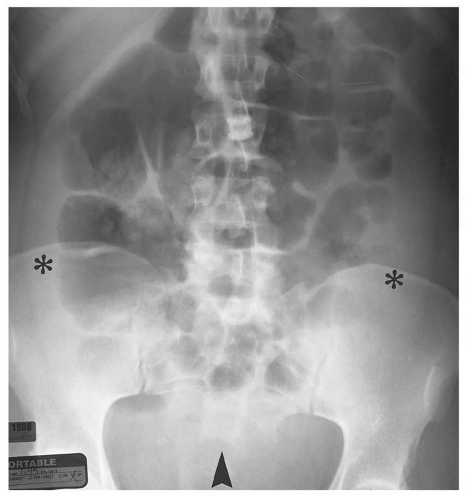
Figure 14.22. AP supine radiograph of the abdomen in a patient with ascites. Note the medial displacement of the air-filled loops of bowel including the ascending and descending colon, which are separated from the flank stripes by fluid in the paracolic gutters (asterisks). Airfilled loops of bowel have floated out of the fluid-filled pelvis (arrowhead).

Abdominal radiography is diagnostic of abscess in approximately one-half of cases. Abscesses may appear because of mass effect displacing adjacent structures (Fig. 14.24). Demonstration of an airfluid level or cluster of small bubbles not caused by bowel gas is strongly suggestive of a gas-containing abscess.

The CT appearance of an intra-abdominal abscess depends on its location. Abscesses within parenchymal organs are usually round or oval (see Fig. 14.48). Those in the peritoneal cavity, particularly those adjacent to the liver and spleen, have a crescentic or lentiform shape, conforming to the shape of the perihepatic and perisplenic spaces
(Fig. 14.25). Extraperitoneal abscess of the psoas muscles conforms to the shape of the muscle but may cause mass effect on adjacent structures (Fig. 14.26). Abscesses contain fluid with low attenuation near that of water. One-third contain small air bubbles or air-fluid levels. An enhancing rim of granulation tissue is characteristic, particularly as the abscess matures, but is present in only a minority of cases. Thickening of fascial planes and soft tissue strands infiltrating fat adjacent to the abscess are signs of inflammation that help distinguish an abscess from sterile fluid collections. However, when the characteristic features of abscess are absent, aspiration may be required to establish the diagnosis.


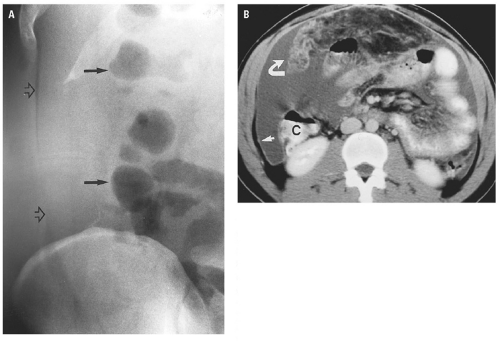
Figure 14.23. Ascites. A: Supine radiograph reveals increased opacity in the right paracolic gutter with increased distance between the flank stripe (open arrows) and the ascending colon (solid arrows). B: Enhanced CT at umbilicus reveals thickening of the mesentery and omentum (curved arrow). Ascites is present, displacing the ascending colon (C) from the abdominal wall, correlating with the appearance on the supine radiograph. The parietal peritoneum is thickened (straight arrow).


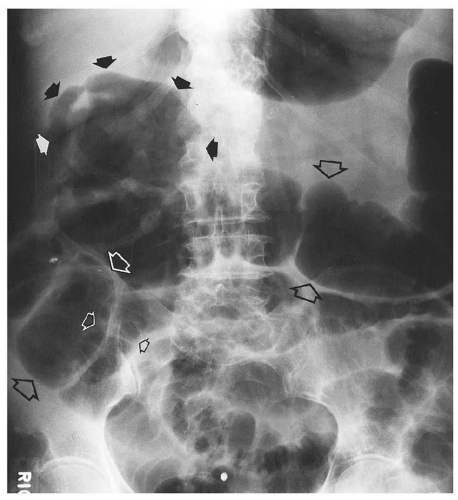
Figure 14.24. Subhepatic abscess. Solid arrows indicate a gas-filled subhepatic abscess. Large open arrows indicate distended colon. Small open arrows indicate dilated small intestine. The abscess produced peritonitis and resultant adynamic ileus.

For patients too ill to be transported to the CT scanner, US is a useful modality for diagnosing an abscess. US is excellent for evaluation of the subphrenic and perihepatic spaces and the pelvis. On US, abscesses typically appear as rounded or oval collections of fluid containing internal echoes and debris. The walls may be well defined or irregular. Echogenic foci of gas, which may cause an acoustic shadow, are strong evidence that a mass seen by US is an abscess (see Fig. 14.48).


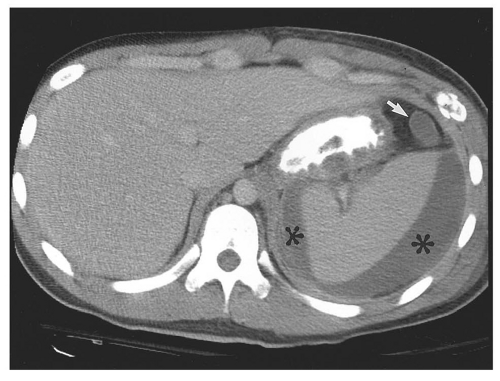
Figure 14.25. Postsurgical perisplenic abscess. Enhanced CT image below the left splenic hilum shows a thick-walled fluid collection in the perisplenic space (asterisks). A smaller collection is seen anterior to the spleen (arrow). The 400 mL of purulent material was aspirated.


Vascular


Abdominal Aortic Aneurysm

Abdominal aortic aneurysm (AAA) is diagnosed when the diameter of the abdominal aorta exceeds 3 cm, which is 50% larger than the upper limit of normal aortic diameter of 2 cm. AAA of 5 cm in diameter or larger have a 25% risk of rupture over 5 years, whereas there is much less risk of rupture for smaller aneurysms. Rapid enlargement of an aneurysm by more than 1 cm per year and the development of pain are other important predictors of rupture. AAA may present as an asymptomatic pulsatile abdominal mass or may present with an acute crisis of hypotension, abdominal pain, and palpable aneurysm consistent with aortic rupture.


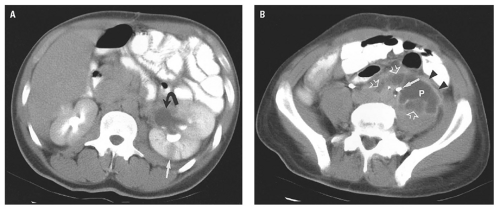
Figure 14.26. Left psoas abscess and left pyonephrosis. Young man with previous abdominal gunshot wound. A: Enhanced CT image through the left renal pelvis shows marked left hydronephrosis (curved arrow) and persistent nephrogram with focal hypoattenuation, indicating acute pyelonephritis (straight arrow). B: Image in the pelvis demonstrates a 5.1-by-3.3-cm left psoas abscess (P) with an enhancing wall displacing the left ureter medially. Note the enhanced rim of the abscess (arrowheads) and the small loculi posteriorly and medially (open arrows). Bullet fragments (arrow) are seen medial to the left ureter.

Conventional radiography often shows the calcified, atherosclerotic wall of a large AAA, but it is unable to demonstrate smaller aneurysms and is no longer used for initial evaluation of AAA (Fig. 14.27). Both US and CT are recommended for the initial evaluation of patients with suspected AAA. US has the advantage of being readily available and quickly performed. It is useful in confirming the presence of aneurysm and measuring its diameter (Fig. 14.28). It is limited in its ability to delineate the aneurysm and its relationship to adjacent visceral, renal, and iliac arteries. US cannot reliably demonstrate retroperitoneal hemorrhage, the most important indicator of ruptured AAA.

CT scanning without IV contrast may be used to confirm the presence and measure the size of an AAA. However, whenever possible, IV contrast
material should be administered to provide additional information about the size and location of intraluminal thrombus and to demonstrate extravasation from a contained rupture (Fig. 14.29). CT is able to show the principal diagnostic sign of a ruptured AAA, a periaortic retroperitoneal hematoma, which may extend into the perirenal or pararenal spaces. In the absence of retroperitoneal hemorrhage, signs of impending rupture may be detected, including “hyperdense crescent” sign, a high-attenuation crescent within the wall of the aorta; focal contour bulge; increased size; or the
demonstration of a focal defect in an otherwise calcified aortic wall (Fig. 14.30).


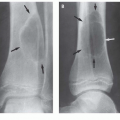
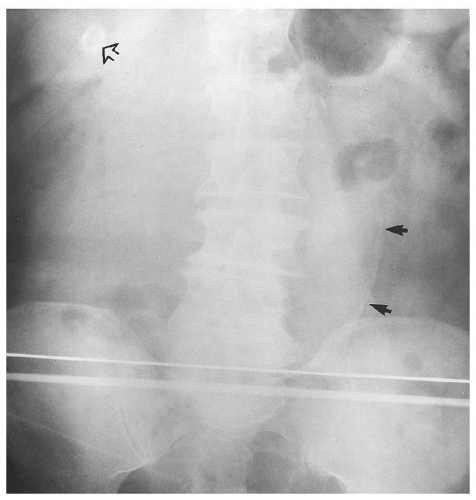
Figure 14.27. Ruptured abdominal aortic aneurysm (AAA). AP supine radiograph shows the atherosclerotic margin of a large AAA (arrows) in a patient presenting with an abdominal catastrophe. A rim-calcified gallstone is noted incidentally (open arrow). This radiograph does not depict the associated retroperitoneal hemorrhage.


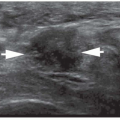
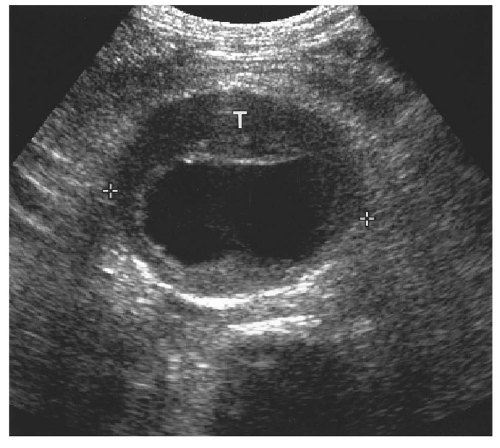
Figure 14.28. Abdominal aortic aneurysm (AAA). Transverse ultrasound image shows 6.8 cm in diameter AAA (electronic cursors). Note the mural thrombus (T) surrounding the lumen.


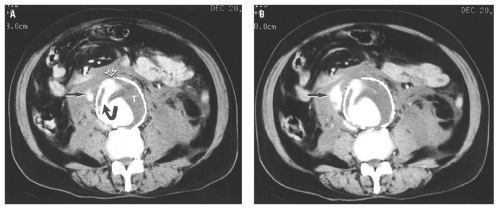
Figure 14.29. Ruptured abdominal aortic aneurysm. A: Enhanced CT image shows contrast material (curved arrow) leaking through mural thrombosis (T) and then through a gap (open arrow) in the calcified anterior wall of the aneurysm. Extravasated contrast material (arrow) is seen in the retroperitoneal hematoma on the right. B: Image at the same level made 3 minutes later shows an increased amount of extravasated contrast material (arrow).


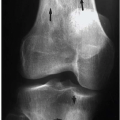
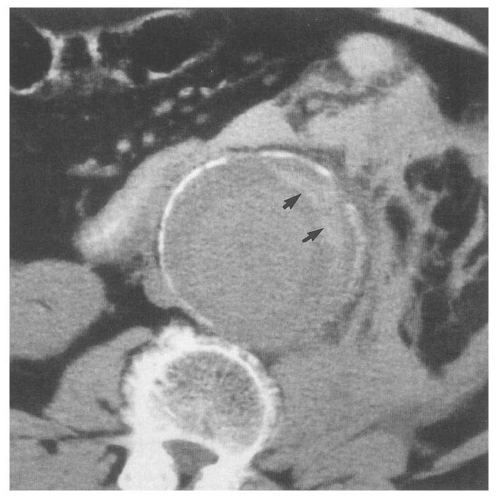
Figure 14.30. Elderly man with severe left lower quadrant pain from the previous day. This large abdominal aortic aneurysm has a calcified wall. Note the highattenuation crescent inside the calcification (arrows), which indicates impending rupture. Abundant left retroperitoneal hematoma is further evidence of impending rupture.

In many clinical situations, dedicated helical CTA of the aorta using 1.0 mm collimation can accurately define the relationship of the aneurysm to the renal arteries. Such examination obviates standard angiography in the preoperative assessment of the aorta.


Acute Aortic Occlusion

Acute occlusion of the aorta causes pain, pallor, pulselessness, paresthesias, and paralysis of the lower extremities. Either embolism or in situ, thrombosis may cause the occlusion. Paresthesias and paralysis indicate limb ischemia, requiring urgent embolectomy or revascularization. CTA can identify the level of aortic occlusion and shows the extent of the blockage (Fig. 14.31).


Retroperitoneal Hemorrhage

Retroperitoneal hemorrhage may occur spontaneously in patients taking anticoagulant therapy (Fig. 14.32) as a complication of AAA or iatrogenically after renal biopsy or translumbar aortography, by upward dissection of hematoma from transfemoral arterial puncture, or by rupture of retroperitoneal tumors. CT is the preferred modality for the detection and estimation of the size of hematomas within the retroperitoneum. For this purpose, IV contrast is not required, but contrast offers the advantage of demonstrating active
arterial extravasation when it is present (Fig. 14.33). An acute hematoma is hyperdense (70 to 90 HU). In hematomas that result from excessive anticoagulation, fluid cell levels and heterogeneity within the hematoma may be seen.

Only gold members can continue reading. Log In or Register to continue

Stay updated, free articles. Join our Telegram channel

Jun 20, 2016 | Posted by in GENERAL RADIOLOGY | Comments Off on Abdomen: Nontraumatic Emergencies

Full access? Get Clinical Tree

Get Clinical Tree app for offline access