(1)
Department of Medical Imaging, Linkou Chang Gung Memorial Hospital, Taoyuan, Taiwan
(2)
Department of Medical Imaging and Radiological Sciences, Institute of Radiological Research Chang Gung University, Taoyuan, Taiwan
8.1 Adrenal Pseudotumor
Case 1
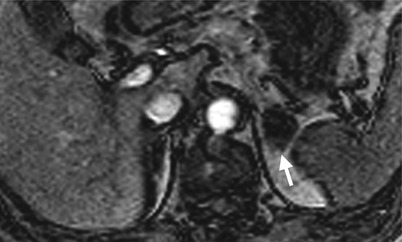
Fig. 8.1

Fig. 8.2
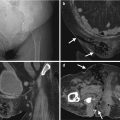
Magnetic resonance imaging (MRI) and computed tomography (CT) show left adrenal pseudotumor due to gastric fundus diverticulum. Out-of-phase axial image on MRI (Fig. 8.1) shows a low signal intensity nodule (arrow) at the left suprarenal area. Contiguous enhanced axial CT images (Fig. 8.2a, b) show a nodule (arrow, Fig. 8.2a) at the left suprarenal area, simulating a left adrenal tumor. However, the nodule is contiguous to the gastric fundus (arrowhead) and has air-fluid level (arrowhead, Fig. 8.2b), which suggests the diagnosis of gastric fundus diverticulum rather than left adrenal tumor.
Case 2
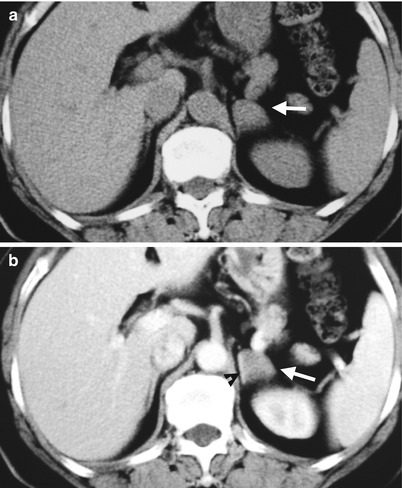
Fig. 8.3
Computed tomography (CT) shows a left retroperitoneal ganglioneuroma at left para-adrenal area simulating an adrenal tumor. Unenhanced axial CT (Fig. 8.3a) shows a well-defined small mass (arrow) at the left suprarenal area. Enhanced axial CT (Fig. 8.3b) shows this mass (arrow) abutting the left adrenal gland (arrowhead). Histological examination of the surgical specimen shows a ganglioneuroma adjacent to the left adrenal gland without invasion to the adrenal gland.
Case 3
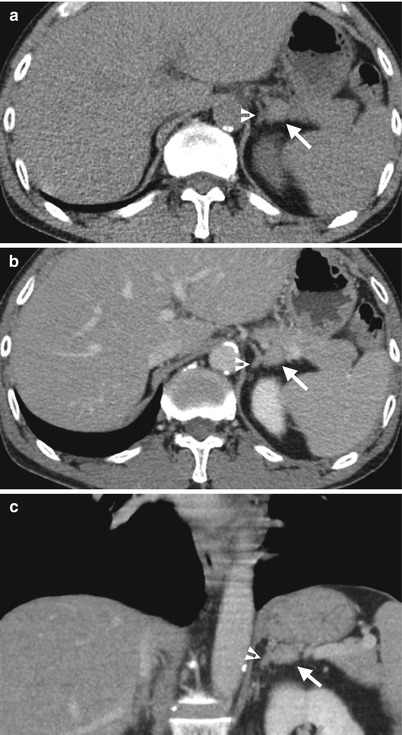
Fig. 8.4
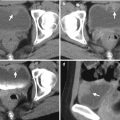
Computed tomography (CT) shows an accessory spleen with adrenal pseudotumor appearance. Unenhanced axial (Fig. 8.4a), enhanced axial (Fig. 8.4b), and enhanced coronal (Fig. 8.4c) CT images show a small soft tissue nodule (arrows) seemingly located at the lateral limb of the left adrenal gland (arrowheads). Histological examination of the resected nodule reveals an accessory spleen without left adrenal involvement. Review of CT images reveals the nodule with identical densities to the spleen on all phases of CT images.
Key Diagnostic Features
A variety of lesions could simulate adrenal tumors on images; however, careful recognition of the anatomical structures of the adrenal gland and adjacent structures are usually useful to differentiate these adrenal pseudotumors from true adrenal tumors. Adrenal pseudotumors include gastric diverticulum, accessory spleen, retroperitoneal tumors of para-adrenal location, pancreas lesion with posterior extension, renal upper polar mass with superior exophytic growth, hepatic tumor, and peri-adrenal varices [1]. Familiarity with the wide spectrum of imaging appearances of these adrenal pseudotumors aids in establishing correct diagnosis. For adrenal pseudotumors have extremely anatomical closeness to the adrenal glands, it remains a challenge to attain a correct preoperative diagnosis.
8.2 Adrenal Tuberculosis
Case 4
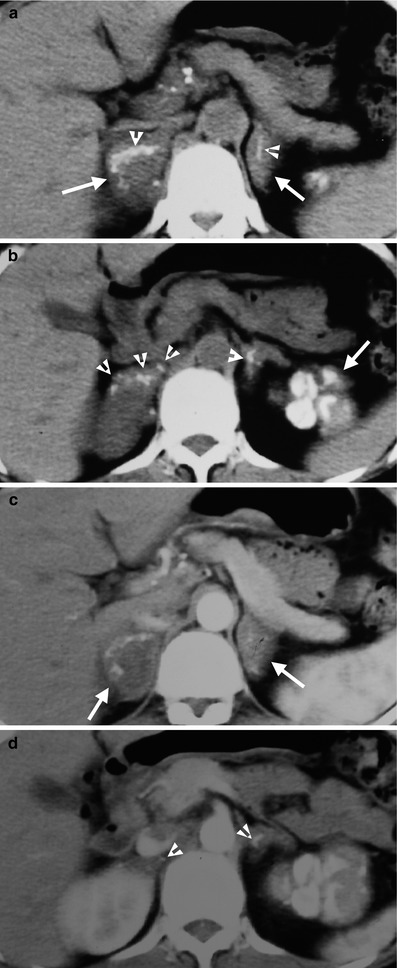
Fig. 8.5
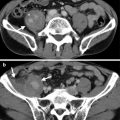
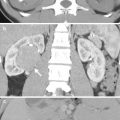
Computed tomography (CT) shows a patient having adrenal and left renal tuberculosis (TB). Figure 8.5a, unenhanced axial CT image shows enlargements of both adrenal glands (white arrows) with linear calcifications (arrowheads). Figure 8.5b, unenhanced axial CT shows multiple punctate calcifications (arrowheads) in both adrenal glands. The left renal upper pole is totally calcified. Figure 8.5c, axial enhanced CT image shows enlarged bilateral adrenal glands (arrows). The left adrenal gland has homogeneous enhancement, and the right adrenal gland has heterogeneous enhancement with central low-density area. Figure 8.5d, axial enhanced CT shows normal parenchymal enhancement of the right kidney. The left calcified kidney is not enhanced. There are several calcified foci (arrowheads) of both adrenal glands. Note the multiple small calcified lymph nodes at the peripancreatic area, representing TB granulomas.
Key Diagnostic Features
Adrenal tuberculosis (TB) is usually presenting with bilateral adrenal enlargements or adrenal masses with or without calcifications on images. The enlarged adrenal gland could have either homogeneous or heterogeneous enhancement. If the adrenal TB mass has a large necrotic area, it usually has a heterogeneous enhancement pattern with a central hypodense area after contrast medium administration on computed tomography and magnetic resonance. In prior healed adrenal TB infection, atrophic adrenal glands with calcifications may be seen. Adrenal TB could be found in patients with prior or coexisting renal TB as well [2]. In patients having bilateral enlarged adrenal glands shown on images, the presence of renal TB imaging findings might suggest the diagnosis of adrenal TB [2]. Otherwise, adrenal metastasis and primary adrenal tumors are the differential diagnoses.
8.3 Adrenal Extramedullary Hematopoiesis
Case 5

Fig. 8.6

Fig. 8.7
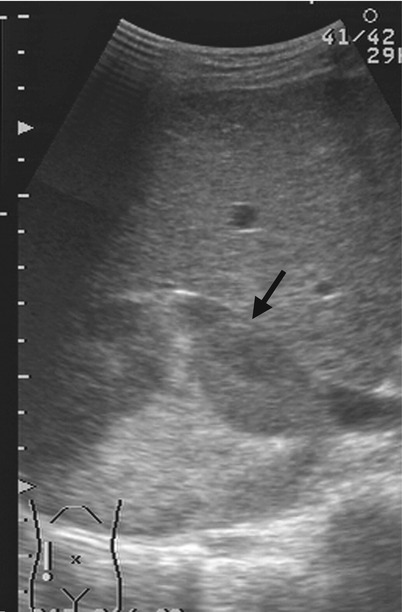
Fig. 8.8
Magnetic resonance imaging (MRI), computed tomography (CT), and ultrasound (US) show right adrenal and paraspinal extramedullary hematopoiesis (EMH) in a patient with β-thalassemia. Unenhanced axial T1-weighted image (T1WI) (Fig. 8.6a), unenhanced axial T2-weighted image (T2WI) (Fig. 8.6b), and enhanced axial T1 fat-suppressed (T1FS) image (Fig. 8.6c) show a right adrenal mass (arrows) with homogeneous low signal intensity on T1-weighted image, heterogeneous high signal intensity on T2-weighted image and heterogeneous enhancement on enhanced T1 fat-suppressed image. Histological examination of the right adrenal mass biopsy reveals extramedullary hematopoiesis (EMH). Follow-up CT images at 10 years later show the right adrenal EMH as a well-defined solid mass (arrows) with mild heterogeneous densities on unenhanced (Fig. 8.7a) and enhanced (Fig. 8.7b) axial images. There is paraspinal EMH presenting as bilateral paraspinal nodules (arrowheads) on enhanced coronal (Fig. 8.7c) and axial (Fig. 8.7d) CT images. Follow-up ultrasound at 13 years later (Fig. 8.8) shows heterogeneous echogenicity of the right adrenal EMH (arrow).
Key Diagnostic Features
Extramedullary hematopoiesis (EMH) usually occurs in patients with β-thalassemia or other hemoglobinopathies [3]. Adrenal EMH is extremely rare [4]. Adrenal EMH has been reported as homogeneous hypoechoic mass on ultrasound [4], which is different from the current case shown. On computed tomography (CT), adrenal EMH appear as a homogeneous or heterogeneous enhancing mass with focal lower density areas on computed tomography (CT) [3, 4]. In patients with related hemoglobinopathies of EMH, adrenal EMH should be listed in differential diagnosis of an adrenal mass. Histological examination of the adrenal mass could help establish the diagnosis of adrenal EMH and avoid unnecessary adrenal mass resection.
8.4 Adrenal Hemorrhage
Case 6

Fig. 8.9
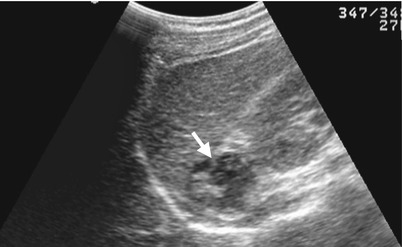
Fig. 8.10

Fig. 8.11
Unenhanced computed tomography (CT) and follow-up ultrasound show a right adrenal hemorrhage of a 17-year-old male patient who suffered from blunt abdominal trauma. Unenhanced axial CT image at the left renal upper pole level (Fig. 8.9a) illustrates acute hematoma (arrow) of the right adrenal gland measured as 60 Hounsfield units (HU). Unenhanced axial CT image at the left renal midportion (Fig. 8.9b) shows right retroperitoneal hematoma at the right posterior pararenal area (arrow) and surrounding the right kidney. Follow-up right renal ultrasound 1 month later (Fig. 8.10) shows decreased size of the right adrenal hematoma with mixed echogenicity (arrow). Follow-up right renal ultrasound 4 months later (Fig. 8.11) shows further reduction of the right adrenal hematoma into a small nodule (arrow). The high density of the adrenal lesion on unenhanced CT and its decreasing sizes over time on serial follow-up ultrasound support the diagnosis of right adrenal hemorrhage.
Key Diagnostic Features
Adrenal hemorrhage could be diagnosed by its typical imaging characteristics or follow-up images in the presence of related histories, especially of acute hematoma stage. Acute hematoma of adrenal gland shows typical high density ranging from 50 to 90 Hounsfield units on unenhanced computed tomography (CT) [5]. On ultrasound, acute hematoma of the adrenal gland usually shows higher echogenicity than the liver parenchyma [5]. On magnetic resonance imaging (MRI), acute hematoma usually shows high or intermediate signal intensity on T1-weighted images [5]. The size of adrenal hemorrhage usually decreased over time [5]. The density of adrenal hematoma decreases gradually and becomes water density on unenhanced CT when it has been liquefied. A liquefied hematoma appears anechoic on ultrasound [5] and low signal intensity on T1-weighted images and high signal intensity on T2-weighted images on MRI. Another important imaging feature of adrenal hemorrhage on CT and MRI is the absence of enhancement of the hematoma itself unless there is active bleeding or hemorrhage in a preexisting adrenal tumor. Adrenal hemorrhage usually occurs in trauma patients, patients undertaking anticoagulation therapy, patients with sepsis or hypotension, or newborns suffering from birth trauma, hypoxia, or coagulopathy [5]. Ultrasound is a useful follow-up imaging tool for validation of the diagnosis of adrenal hemorrhage in newborns by demonstrating size reduction and liquefaction [5]. By using these imaging characteristics, adrenal hemorrhage could usually be diagnosed with confidence, and follow-up imaging helps in solving some cases of adrenal hemorrhage diagnosed with uncertainty.
8.5 Adrenal Cyst
Case 7
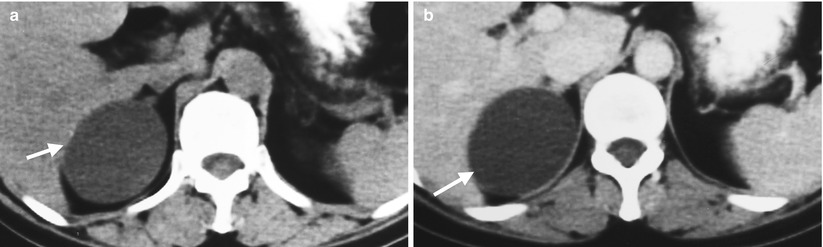
Fig. 8.12
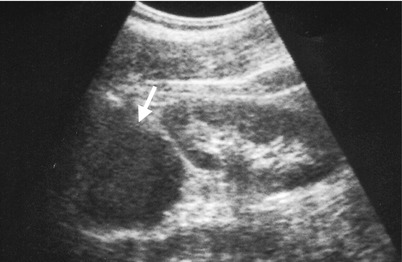
Fig. 8.13
Unenhanced computed tomography (CT) and ultrasound show a right adrenal pseudocyst. Unenhanced (Fig. 8.12a) and enhanced (Fig. 8.12b) axial CT images at the right adrenal area show a water density lesion (arrows) of the right adrenal gland, suggestive of right adrenal cyst. Right renal ultrasound (Fig. 8.13) 2 years later after CT imaging shows an anechoic mass (arrow) at the right suprarenal area, compatible with adrenal cyst. This right suprarenal cystic lesion has been resected later with histological evidence of right adrenal pseudocyst by hemorrhage.
Case 8
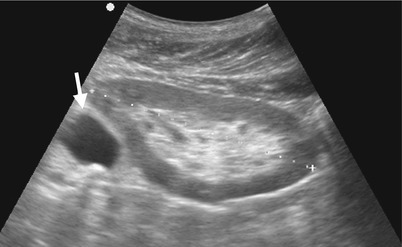
Fig. 8.14
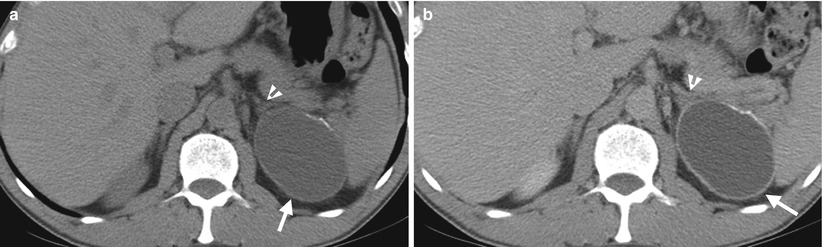
Fig. 8.15
Ultrasound and computed tomography (CT) images show a left adrenal pseudocyst. Left renal ultrasound (Fig. 8.14) shows a cyst (arrow) at the left suprarenal area. Unenhanced (Fig. 8.15a) and enhanced (Fig. 8.15b) axial CT images show a cyst (arrows) with thin calcifications at the wall of the left adrenal gland (arrowheads). Histological examination of surgical specimen of this lesion reveals adrenal pseudocyst.
Case 9
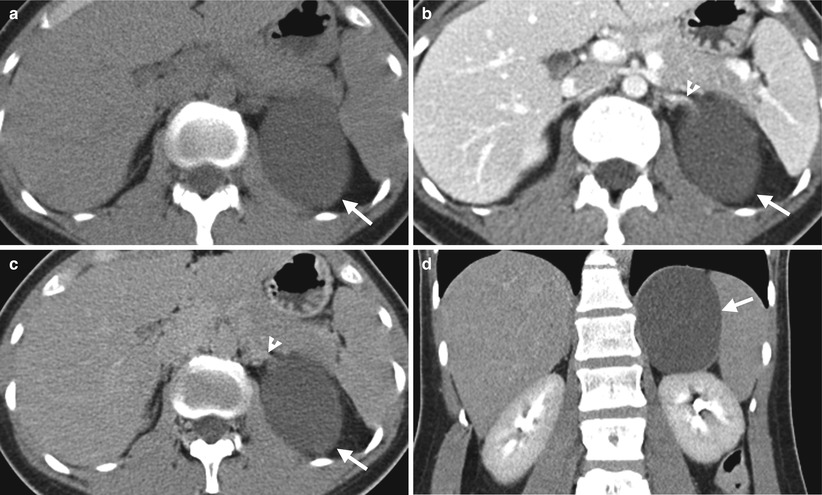
Fig. 8.16
Computed tomography (CT) illustrates imaging characteristics of a left adrenal endothelial cyst. Unenhanced axial (Fig. 8.16a), enhanced axial corticomedullary phase (Fig. 8.16b), enhanced axial excretory phase (Fig. 8.16c), and enhanced coronal excretory phase (Fig. 8.16d) images show a cyst (arrows) of the left adrenal gland (arrowhead), which has been proved as an endothelial cyst by histological examination of surgical specimen.
Case 10
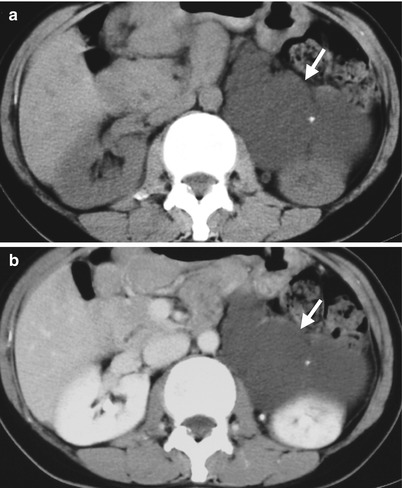
Fig. 8.17
Case 11
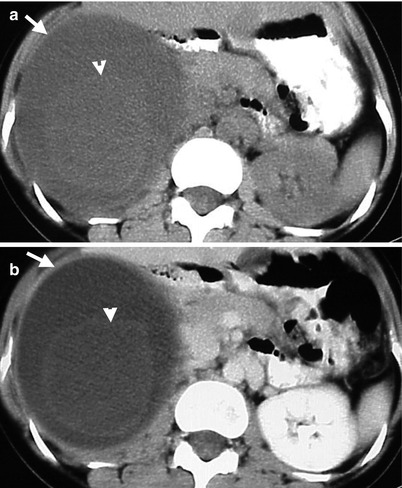
Fig. 8.18
Computed tomography (CT) illustrates imaging findings of a right adrenal pseudocyst. Unenhanced (Fig. 8.18a) and enhanced axial (Fig. 8.18b) CT images show a right adrenal cystic lesion (arrows) with central non-enhancing soft tissue part (arrowheads), which has been proved as pseudocyst after surgery.
Key Diagnostic Features
Adrenal cysts could be easily diagnosed on images if they present with typical imaging characteristics as unilocular or multilocular cysts with or without thin calcifications [6]. There are four histological subtypes of adrenal cysts: endothelial cysts, pseudocysts, epithelial cysts, and parasitic cysts [6]. Among the four subtypes, endothelial cysts and pseudocysts are more common [6]. Adrenal pseudocysts may present as a hemorrhagic cyst with layering appearance because they usually come from hemorrhage of the adrenal gland [6]. Adrenal pseudocysts may have atypical imaging features with soft tissue density on computed tomography. However, no contrast enhancement of the soft tissue part in the lesion may suggest its nature as a pseudocyst rather than a true neoplasm [6].
Main Differential Diagnoses
1.
Retroperitoneal lymphangioma
Retroperitoneal lymphangioma at the suprarenal location could mimic an adrenal cyst because both show similar unilocular or multilocular cystic appearance. If a normal adrenal gland is recognized and clearly not contiguous with the cystic lesion on images, a retroperitoneal lymphangioma is more favored.
8.6 Adrenal Hyperplasia
Case 12
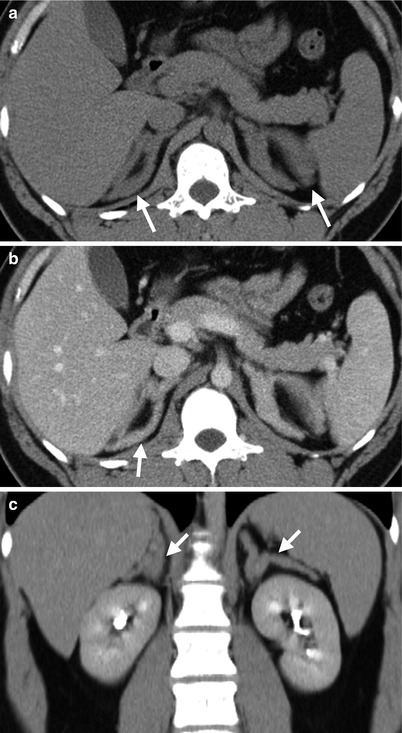
Fig. 8.19
Computed tomography (CT) shows bilateral adrenal hyperplasia. Unenhanced axial (Fig. 8.19a), enhanced axial (Fig. 8.19b), and enhanced coronal (Fig. 8.19c) CT images show enlargement of bilateral adrenal glands (arrows) with preservation of adreniform shape. The densities of bilateral enlarged adrenal glands are homogeneous. There is absence of nodules in the bilateral adrenal glands.
Case 13
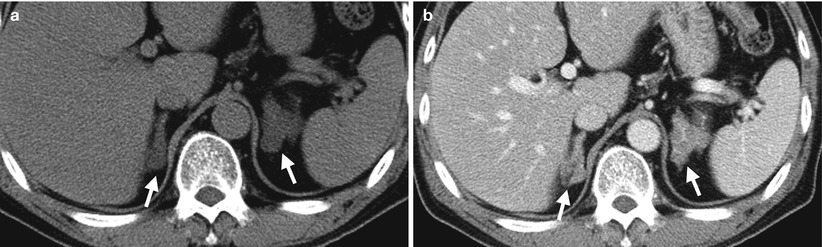
Fig. 8.20
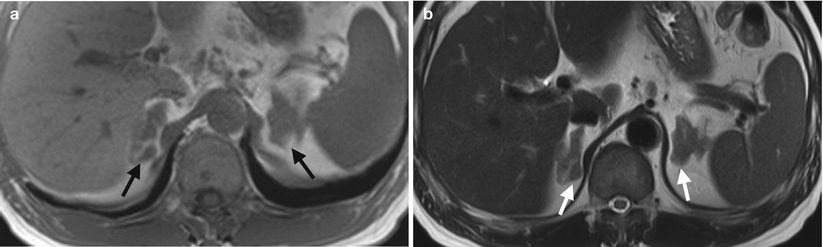
Fig. 8.21
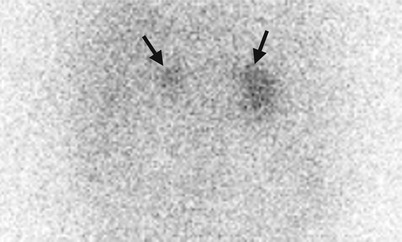
Fig. 8.22
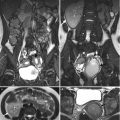
Computed tomography (CT), magnetic resonance imaging (MRI), and adrenal scintigraphy using iodine-131-6-β-iodomethylnorchoesterol (NP-59 scan) illustrate imaging findings of bilateral adrenal hyperplasia. Unenhanced (Fig. 8.20a) and enhanced (Fig. 8.20b) axial adrenal CT images show obvious enlargement of bilateral adrenal glands (arrows). The mean limb width of the right adrenal gland is 8 mm and the left is 13 mm. There are multiple small nodules noted in both adrenal glands which have lower densities than adjacent adrenal parenchyma. Unenhanced axial T1-weighted (Fig. 8.21a) and T2-weighted (Fig. 8.21b) images on MRI show similar enlargements of both adrenal glands (arrows). Both adrenal glands appear as homogeneous lower signal intensity to liver parenchyma on T1-weighted images and homogeneous isointensity to the liver on T2-weighted images. NP-59 scan (Fig. 8.22) shows increased uptakes of bilateral adrenal glands (arrows). Bilateral adrenal hyperplasia is impressed.
Case 14

Fig. 8.23

Fig. 8.24
Computed tomography and magnetic resonance imaging (MRI) show bilateral adrenal hyperplasia associated with a pituitary microadenoma. Enhanced axial (Fig. 8.23a) and coronal (Fig. 8.23b) CT images show conspicuous enlargement of bilateral adrenal glands (arrows) with multiple nodules of variable sizes ranging from 13 to 46 mm. Pituitary gland dynamic enhanced MRI image (Fig. 8.24) shows a 4-mm adenoma (arrow) depicted in the pituitary gland, consistent with pituitary microadenoma.
Key Diagnostic Features
Adrenal hyperplasia typically involves bilateral adrenal glands [5]. Bilateral adrenal hyperplasia most commonly appears as bilateral adrenal enlargements with smooth contours and maintenance of adrenal shape similar to normal ones [5]. The densities on CT and signal intensities on MRI of bilateral adrenal gland hyperplasia are similar to that of normal adrenal glands. Occasionally, bilateral adrenal hyperplasia may show micronodular or macronodular appearances in addition to adrenal gland enlargement [5]. These micro- or macronodules may show a density similar to or slightly lower than the adjacent adrenal parenchyma on unenhanced CT, which become more conspicuous by lower density contrast to normal adrenal parenchyma on enhanced CT. Bilateral adrenal hyperplasia could be seen in patients with Cushing’s syndrome, primary hyperaldosteronism, or adrenogenital syndrome [5]. The majority (80–85 %) of Cushing’s syndrome are adrenocorticotropic hormone (ACTH)-dependent, which usually results from pituitary lesions [7]. For patients with primary aldosteronism, mean adrenal limb width more than 5 mm with or without nodules has been reported as 100 % specificity for diagnosing bilateral adrenal hyperplasia and more than 3 mm as 100 % sensitivity [8]. However, adrenal venous sampling has been recommended for mean adrenal limb width between 3 and 5 mm for differentiating bilateral adrenal hyperplasia from aldosterone-producing adenomas (APA) in patients with primary aldosteronism [8]. Bilateral adrenal hyperplasia typically shows symmetric (i.e., bilateral) increased uptake in adrenal scintigraphy [9].
Main Differential Diagnoses
1.


Multiple adrenal adenomas in bilateral adrenal glands
Multiple adrenal adenomas could be confused with bilateral adrenal hyperplasia appearing with nodular appearance on images. Nonetheless, coexisting increased widths of bilateral adrenal limbs usually favor the diagnosis of bilateral adrenal hyperplasia in patients presenting with primary aldosteronism [9]. For patients with indeterminate situations of mean adrenal limb width between 3 and 5 mm, adrenal venous sampling is useful for their differentiation [9]. For patients presenting with hypercortisolism, symmetric increased uptake on adrenal scintigraphy usually favors the diagnosis of bilateral adrenal hyperplasia. On the other hand, multiple nodules of bilateral adrenal glands on CT found in a patient with normal function of cortisol, aldosterone, and catecholamine suggest the diagnosis of incidentally detected adrenal adenomas.
Related posts:
Stay updated, free articles. Join our Telegram channel
Full access? Get Clinical Tree
