Aortic Stenosis
INTRODUCTION
With the exception of coronary artery bypass grafting procedures, aortic valve replacement (AVR) for critical aortic stenosis (AS) is the most common indication for cardiac surgery in patients past the age of 65 years. The newly approved transcutaneous aortic valve replacement (TAVR) by either transfemoral or a combined surgical catheter–based technique, assisted by three-dimensional (3D) transesophageal echocardiography, will increase the number of patients who are candidates for valve replacement. The overwhelming majority of patients in this age group have atherosclerotic degenerative changes of a tricuspid valve as their pathophysiologic substrate. In contrast, most patients undergoing AVR for AS in the 35- to 55-year-old age groups have a bicuspid aortic valve (AV), which typically calcifies early and may be associated with dilation of the ascending aorta. AV involvement by rheumatic disease occurs much less frequently than in the preantibiotic era, typically causes commissural fusion, and is almost invariably associated with mitral valve (MV) disease.
In general, critical AS is diagnosed preoperatively. Symptoms of hemodynamically significant AS indicating a clinical need for AVR are congestive heart failure (often starting as exertional dyspnea), syncope, and angina. Provided other potential causes of these symptoms have been excluded, their presence is of paramount clinical significance because failure to operate at the onset of symptoms is associated with a poor prognosis. This is so even if the estimated valve areas are less than “critical.” Calculated AV areas are estimates based on assumptions that apply hydraulic principles to a physiologic system and on gradient measurements dependent, to an important degree, on the cardiac output (CO) at the time of measurement.
The rate of progression of stenosis can be fairly rapid and tends to be linear for a given individual, but it is not predictable based on the initial echocardiographic findings (1,2). The issue of whether to replace a noncritically stenotic valve prophylactically during other cardiac surgery is increasingly important. Current clinical guidelines support AVR at the time of primary coronary artery bypass surgery in patients with at least moderate AS, even if asymptomatic, in view of the generally progressive nature of this disorder (3). Accordingly, the intraoperative echocardiographer must be adept with the techniques used to assess the severity of AS (Table 12.1).
PATHOPHYSIOLOGY
AS presents a slowly progressive increase in afterload on the ventricle developing over the course of years as the degree of stenosis progresses. The resulting increase in wall stress (force/unit area) induces a variable degree of a concentric hypertrophic response that tends to normalize wall stress. Ultimately this compensatory mechanism fails and typical symptoms develop. The hypertrophied chamber becomes less compliant because of both the stiffness of hypertrophied muscle and concomitant collagen deposition. This results in diastolic dysfunction and increasing preload dependence of the ventricle. Atrial contraction (the “a” kick) can increase from the normal of 3 to 4 mm Hg to levels as high as 30 to 40 mm Hg to stretch the hypertrophied ventricle before each contraction. Loss of atrial contraction by the development of atrial fibrillation can result in the development of acute pulmonary edema. The need for a relatively high preload (filling pressures) in these noncompliant ventricles is an important key to effective postoperative management.
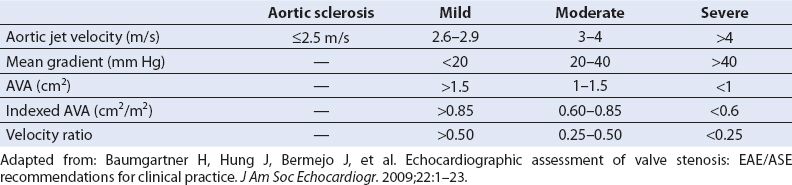
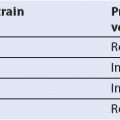
Table 12.1 Grading Severity of Aortic Stenosis
AS can cause angina in the absence of significant epicardial coronary artery disease. Prevailing theory as to the mechanism of this has been that the tissue turgor of the hypertrophic wall compromises coronary flow reserve by restricting the dilatory capacity of penetrating coronary vessels. Recent data have shown that AV pressure gradients, left ventricular (LV) mass, female sex, LV filling pressure (septal E/e′), and myocardial fibrosis have univariate association with reduced myocardial perfusion reserve. Of these, LV mass index (a determinant of O2 demand) and late gadolinium enhancement on MRI (a marker of fibrosis) appear to be the most important (4). Cardiac catheterization is therefore required to exclude critical coronary artery disease (which coexists in approximately 50% of cases) in patients both with and without angina as silent coronary disease is potentiated by the physical limitation on activity caused by the stenosis. Syncope is a consequence of the inability to increase CO in response to the peripheral vasodilation associated with exercise, to arrhythmia, or to acute heart failure. Pulmonary congestion results from the increasingly high preload (left atrial pressure) required for adequate function in a noncompliant ventricle with diastolic dysfunction and the shortening of the diastolic filling period by exercise-induced tachycardia.
ECHOCARDIOGRAPHIC EVALUATION OF THE AORTIC VALVE
The AV can be evaluated by M-mode, two-dimensional (2D), Doppler, and 3D echocardiographic techniques. The primary approaches utilize 2D imaging and both pulsed wave Doppler (PWD) and continuous wave Doppler (CWD) to assess valve morphology and severity of disease. TEE 2D echocardiographic imaging of the AV is generally superior to TTE imaging because of the improved resolution of the higher frequency TEE probe. Three-dimensional imaging shares the limits inherent to all ultrasound techniques determined by the interrelation of sector size, frame rate, and depth on image resolution. In some patients the AV may be better visualized from the 3D TTE approach rather than 3D TEE because the valve is a more anterior structure. The reduced temporal resolution of 3D imaging frequently results in dropout of the thin leaflets of a normal AV (Videos 12.1, 12.2). With the thickening and calcification of the leaflets seen with the development of valvular stenosis, 3D imaging is often better but may also be impaired by the associated acoustic shadowing. Preliminary data suggest that optimal images in 3D are obtained in a minority of patients, but when obtainable add valuable additional information. Both types of TEE imaging are best obtained from the ME SAX and LAX views. The ultimate role of 3D TEE in the assessment of AS remains under investigation but reference is made to preliminary observations in the following discussions. Guidelines for the approach to the assessment of AS have recently been published (5). The following discussion follows the recommended priority of methods for evaluation outlined therein.
Quantitative Doppler Assessment of Aortic Stenosis
The severity of AS is assessed quantitatively with Doppler echocardiography in two ways: Measuring the gradient across the valve with the modified Bernoulli equation and estimating the AV area with the continuity equation. Both techniques require that the ultrasound beam be as parallel to the transvalvular blood flow as possible.
Transesophageal Echocardiographic Doppler Views for Assessing Aortic Stenosis
In AS, aligning the TEE transducer parallel to the left ventricular outflow tract (LVOT) and AV can be challenging. The deep transgastric (TG) and TG LAX views are commonly used depending on which one offers the optimal window for interrogation parallel to the stenotic jet. Advancing the probe from a TG short-axis view with continued anteflexion may allow acquisition of the deep TG long-axis view from near the LV apex. Occasionally, counterclockwise rotation of the probe and varying the angle of interrogation over a wide range may facilitate this. The TG long-axis view is obtained with the probe at the midpapillary level or slightly above and the imaging plane angle of interrogation increased to 120 to 140 degrees where the LVOT, AV, and ascending aorta come into view. Both techniques offer an excellent approach to AV flow dynamics; however, the patient’s anatomy will dictate which view provides the best interrogation of transvalvular blood flow. For this reason it is advised that both views be sought out and the highest velocities obtained are used in calculations of AS. In a small minority of individuals, the ME LAX view (at 120 degrees) allows the best alignment to the transaortic flow.
A note of caution is necessary in a discussion of Doppler imaging and the angle of incidence. Some echocardiographic systems provide a means to correct the angle of interrogation visually by multiplying the Doppler shift velocity by the cosine of the incident angle of the beam to the aortic flow as manually input by the echocardiographer. It is generally accepted that this is not a reliable method since the interaction of beam and blood flow occurs in three dimensions and 2D imaging is unable to provide the true angle of incidence to the jet accurately. With turbulent jets, as in AS, judging the alignment with flow is particularly difficult. Such jets may be very eccentrically directed to the 2D plane visualized, so that apparent “correction” by looking at a color flow map of the jet can be very imprecise. Obtaining the highest velocity smooth envelope is a better way to confirm accuracy. Feathered velocities at the tip of the velocity envelope are artifactual and should not be included in the analysis. Orientation by sound of the Doppler signal to the purest tone also may help in defining the optimal orientation of the interrogating beam in parallel to flow. Ideally the beam should align to within 0 to 15 degrees of the actual jet.
Doppler Determination of the Aortic Valve Gradient: The Modified Bernoulli Equation
The modified Bernoulli equation is used to calculate transaortic valve pressure gradients (Table 12.2). The modified Bernoulli equation states that the maximal pressure gradient equals four times the square of the peak jet velocity and allows calculation of the peak instantaneous gradient across any orifice. Thus, if the peak blood flow velocity across the AV is 4 m/s, the calculated peak gradient = 4 × 42 = 64 mm Hg. The mean gradient is calculated by averaging the instantaneous gradients over time. This function is accomplished by tracing the aortic flow velocity profile and using the analysis program of the ultrasound machine (Fig. 12.1). The mean velocity cannot be used to estimate the mean gradient in the Bernoulli equation. Averaged instantaneous gradients must be averaged (by the trace function). A less accurate alternative mean gradient can be calculated from the peak velocity as 2.4(Vmax)2. The mean gradient, in particular, correlates well with invasively determined gradients and is most often used in evaluating the severity of AS. It is imperative that a true peak velocity be obtained for this estimate to be valid. A well-defined velocity curve with a smooth envelope is generally a valid one.
The peak gradient can be influenced by the flow volume on the ventricular side of the valve plane. Remember that the simplified Bernoulli equation ignores the impact of the LVOT blood flow velocity. However, the Bernoulli equation must factor in the LVOT blood flow velocity when it exceeds 1.5 m/s, as commonly occurs in associated aortic insufficiency and other high output states, to avoid overestimation of the pressure gradient (Table 12.2). For example, if the outflow tract velocity is 1.7 m/s and the peak transvalvular velocity is 4 m/s, the actual gradient is 4 × (42 – 1.72) = 4 × (16 – 2.89) = 52.4 mm Hg, instead of the 64 mm Hg predicted by the simplified Bernoulli equation.
Table 12.2 Equations for Aortic Transvalvular Gradients
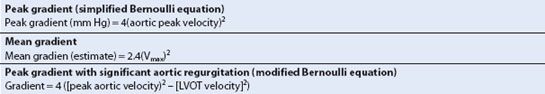
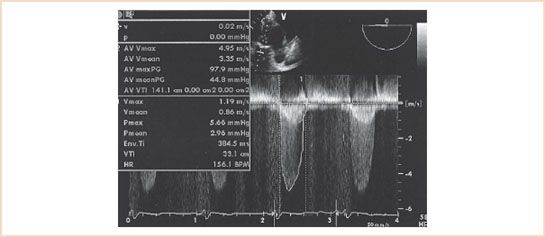
FIGURE 12.1 Deep transgastric view with parallel continuous wave Doppler beam alignment in a patient with severe aortic stenosis. Aortic stenosis tracing is labeled 2 (outer envelope), with a maximal aortic valve velocity of 4.95 m/s and a Bernoulli equation–derived peak aortic valve gradient of 97.9 mm Hg. Aortic valve time–velocity integral (TVI) is 141.1 cm. Tracing 1 is of the left ventricular outflow tract (LVOT) velocity. LVOT maximal velocity is 1.19 m/s and LVOT TVI is 33.1 cm.
Discrepancies often occur between catheterization and echocardiographic pressure gradients in AS. The peak echocardiographic gradient measures the peak instantaneous gradient between the LV and aorta. This is generally higher than the peak-to-peak gradient (between the peak LV pressure and the generally later peak aortic pressure) routinely entered on cardiac catheterization reports (Fig. 12.2). In addition, the phenomenon of pressure recovery (PR), the recovery of pressure energy from the kinetic energy of acceleration through the narrowed orifice that occurs distal to the stenotic valve, can cause an elevation in the estimated transvalvular gradient by Doppler as compared to measurements by catheterization. In general this only becomes a factor in patients with small aortas (sinotubular junction ≤3 cm). (See below.)
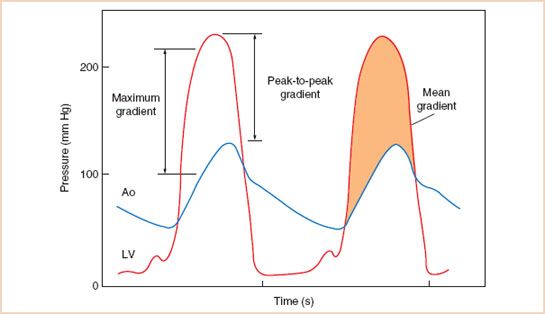
FIGURE 12.2 Example of left ventricular (LV) and aortic (Ao) pressures measured with fluid-filled catheters in a patient with severe aortic stenosis. The maximal instantaneous gradient is greater than the peak-to-peak gradient. The shaded area indicates the mean gradient. (From Otto CM. Textbook of Clinical Echocardiography. 2nd ed. Philadelphia, PA: WB Saunders; 2000:238, with permission.)
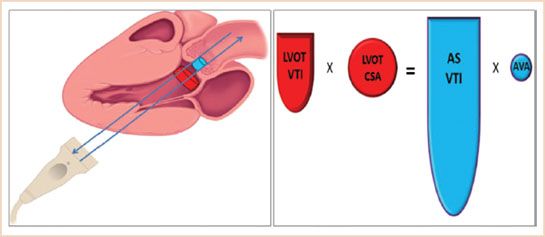
FIGURE 12.3 Demonstrates the concept of parallel Doppler beam alignment and the concept of “what goes in has to come out.” Hence LVOTVTI × LVOTCSA = ASVTI × Aorta Valve Area (AVA).
Hemodynamically significant AS is generally associated with a mean gradient of 40 mm Hg or more or a maximal velocity of 4 m/s or more (Table 12.1). The exception is in patients with a low ejection fraction who may not be able to generate a high gradient. In these patients, peak gradients as low as 20 to 30 mm Hg may be associated with critical stenosis, and the continuity equation and planimetry as well as a dobutamine challenge should be considered to further evaluate the significance of AS. Systemic hypertension during the assessment also impacts both on the apparent gradient and the left ventricular ejection fraction (LVEF) and must also be considered in evaluating the validity of the assessment of the gradient. (See below.)
Doppler Estimation of the Aortic Valve Area: The Continuity Equation (Fig. 12.3)
The continuity equation states that the volume of blood that enters the stenotic aortic orifice is equal to the volume of blood that exits it. If we can calculate the volume of flow entering a stenotic AV through the LVOT and measure the velocity at which it exits the stenotic valve, then the equation can be rearranged to solve for the area of the stenotic valve (Table 12.3). The valve area derived from the equation is the effective area, as opposed to the anatomic area derived from planimetry of the valve. The effective area has been clinically validated even though it is slightly smaller than the anatomic area as the primary predictor of clinical outcome (5). The area of the normal AV is between 3 and 4 cm2 (Fig. 12.4, Videos 12.3, 12.4). Guidelines viewing the disease as a continuum based on hemodynamic and natural history data, define severe AS as a valve area <1 cm2, and a mean gradient >40 mm Hg or peak jet velocity >4 m/s (3) (Table 12.1).
Table 12.3 Calculation of Aortic Valve Area with the Continuity Equation

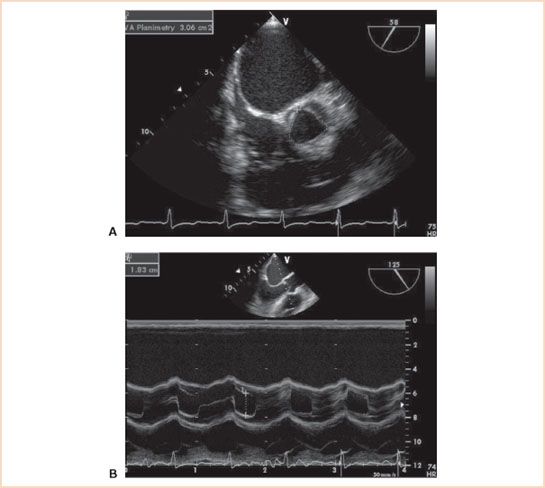
FIGURE 12.4 A: Midesophageal aortic valve short-axis view of a normal aortic valve with a planimetric area of 3.06 cm2. B: Two-dimensional M-mode (motion mode) midesophageal aortic valve long-axis view demonstrating cusp separation of 18 mm in the same patient.
One first calculates the cross-sectional area of the LVOT. In the ME AV LAX view, the LVOT annular diameter, an initial estimate, is obtained by measuring the inner dimension (endocardium to endocardium) of the LVOT at the insertion point of the AV leaflets in midsystole with the electronic calipers (Fig. 12.5B). However, measurement of the outflow tract ideally should be where the optimal outflow tract velocity profile is obtained in the apical view (see below). This is generally either at, or within a centimeter of, the aortic leaflet insertions into the valve annulus. The diameter of the LVOT is generally 2 ± 0.2 cm and varies somewhat in proportion to body size. Inaccuracies in measurement of the outflow tract can account for much of the error in this technique because the radius is squared in the continuity equation. The most common discrepancies occur during the imaging of elderly women, who often have a smaller outflow tract (and body surface area) than average, and large men, who often have a larger outflow tract (and body surface area). If we assume that the LVOT is a circle, one calculates its area as πr2 (or π[D/2]2). Observations in small numbers of patients assessing the size of the LVOT by CT angiography and TTE 3D echo (6–8), show that it is often not circular but ovoid and that its true size is best determined by planimetry using these techniques. Using the assumption it is round by 2D echo can result in up to a 15% underestimation of LVOT area. The more accurate measurement is important when sizing percutaneous transvalvular aortic prostheses as undersizing often causes paraprosthetic aortic regurgitation. However, the circular assumption has held up well for clinical assessment of severity and the need for more accurate measurement will require additional corroboration.
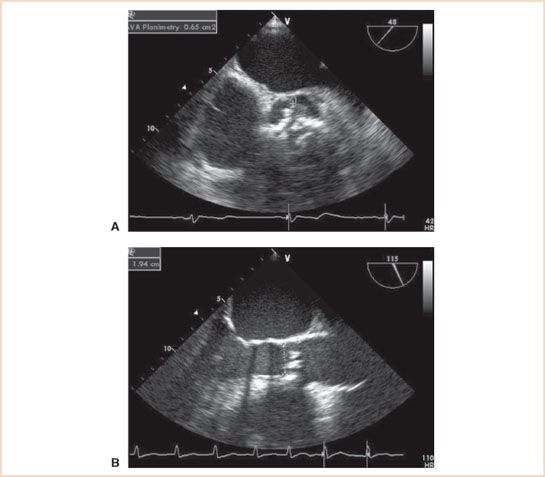
FIGURE 12.5 A: Midesophageal aortic valve short-axis view demonstrating aortic stenosis and a tricuspid aortic valve with heavy calcification. Aortic valve area by planimetry is 0.65 cm2. B: Midesophageal aortic valve long-axis view in midsystole with measurement of the left ventricular outflow tract (LVOT) diameter (1.94 cm). The diameter is measured from the inner surfaces (endocardium to endocardium) of the LVOT at the insertion points of the aortic cusps. The continuity equation–derived aortic valve area is 0.70 cm2. Continuous wave Doppler values are from Figure 12.1.
Secondly, the LVOT time–velocity integral (TVI) is then determined by either of the two methods. PWD can be used, with the sample volume just proximal to the AV cusps within the LVOT (Fig. 12.6). The sample volume is gradually moved toward the AV until a smooth LVOT velocity profile is obtained at the level of the outflow tract where the annular dimension was obtained. If this is slightly below the aortic leaflet insertion point, the LVOT dimension should be remeasured at the same place. The internal calculation package available on all echocardiographic machines traces the LVOT velocity, allowing calculation of the LVOT TVI. PWD is essential for this flow measurement because it must be made at the precise level at which the outflow tract was measured due to the acceleration of blood flow from LV into the stenotic AV orifice. A second alternative method, which is less well validated, uses CWD interrogation through the AV. If the alignment is correct, a more intense lower velocity inner envelope representing the lower velocity LVOT flow is imaged within the higher velocity aortic jet envelope and can be traced as previously described to calculate the LVOT TVI (Fig. 12.1). However, this envelope peak can be erroneously high because the subaortic jet accelerates into the stenotic orifice to form a proximal isovelocity surface area as it narrows to fit into the orifice (see MR Chapter 8). This can raise the apparent peak velocity to a level higher that it would be at the annular level and result in an overestimation of the valve area. The “double envelope” configuration defines proper alignment with the jet and facilitates PWD confirmation of the velocity at the annular level. As such, it may help to identify an optimal window for interrogation of the actual LVOT velocity with PWD.
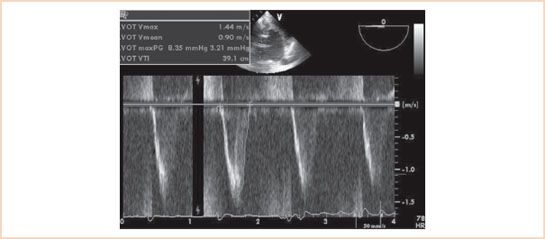
FIGURE 12.6 Deep transgastric view of the aortic valve with pulsed wave Doppler assessment of the left ventricular outflow tract (LVOT) flow velocity. The LVOT time–velocity integral is assessed to be 39.1 cm. Note correlation with inner envelope technique valve area of 33.1 cm (same patient as in Fig. 12.1).
Related posts:
Stay updated, free articles. Join our Telegram channel

Full access? Get Clinical Tree


