Diagnosis of Myocardial Ischemia
ANATOMY AND PATHOPHYSIOLOGY OF THE MYOCARDIAL BLOOD SUPPLY
Coronary Anatomy
The myocardium has its own independent blood supply and drainage (Fig. 4.1). Two coronary arteries originate from the aortic root: The left main coronary artery from above the left coronary cusp of the aortic valve and the right coronary artery (RCA) from above the right coronary cusp of the aortic valve.
The left main coronary artery bifurcates at around 10 mm into the left anterior descending (LAD) and the left circumflex (LCX) coronary arteries. The LAD runs along the anterior interventricular sulcus passing the ventricular apex to reach the posterior interventricular sulcus. On its way to the apex, it gives rise to the diagonal branches and septal arteries. It thereby supplies the left ventricular (LV) anterior wall, the apex, and the anterior part of the interventricular septum.
The LCX runs along the left atrioventricular sulcus and gives rise to a large marginal branch and the posterolateral branches supplying the lateral wall. In patients with left dominant coronary distribution, the distal LCX extends as a posterolateral branch to supply part of the inferior LV wall.
The RCA runs along the right atrioventricular sulcus, where its middle section gives off the right ventricular (RV) acute marginal branches. These acute marginal branches supply the RV free wall and the conduction system including the sinus and atrioventricular node. The RCA bifurcates into the posterior descending artery and the right posterolateral branch. Their supply territory is the inferolateral RV wall, the inferior part of the interventricular septum, and the inferior wall of the LV.
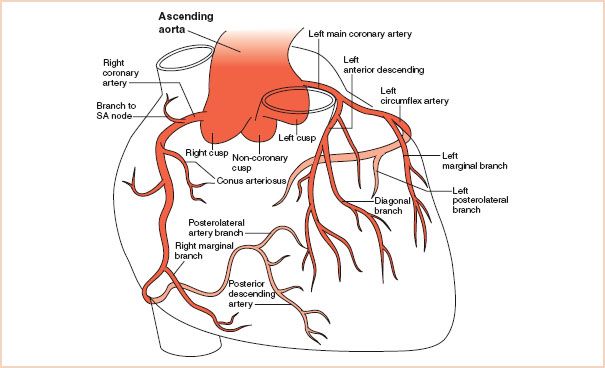
FIGURE 4.1 Anatomy of the coronary arteries of the heart.
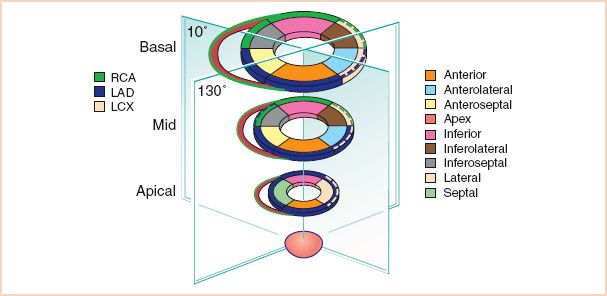
FIGURE 4.2 The 17-segment model of the left ventricle (inner ring) as demonstrated in the transgastric short axis views. The outer ring shows the common (solid line) and variant (dash line) coronary artery distributions. RCA, right coronary artery; LAD, left anterior descending artery; LCX, left circumflex artery.
Variations in Coronary Anatomy and Main Distribution Types
There are three major variations of coronary distribution. These distribution types affect the posterior descending artery and posterolateral branch which supply the inferior septum and inferior wall of the LV (Figs. 4.1–Figs. 4.5). The right dominant coronary distribution type is the most common (80% to 85%), where supply originates from the RCA. In left dominant systems supply is via the LCX artery. A balanced or co-dominant type is present in about 5% of individuals, where the posterior descending artery and posterolateral branch receive supply from both the RCA and from the LCX. Recent imaging studies, however, have altered traditional concepts of coronary perfusion zones as well as reveal the significant individual variation in coronary supply to the myocardial segments. For example, the apical segments are now understood in the majority of cases to be supplied by the LAD with the LCX and RCA seen in a minority of individuals. The greatest overlap in coronary artery distribution occurs in the inferolateral region corresponding either to RCA or LCX territories, as well as the inferoseptal region that may be supplied by the LAD artery, RCA, or even a left-dominant LCX artery. Figure 4.2 incorporates these recent findings and emphasizes the large amount of myocardium supplied by the LAD artery and potential for substantial infarct size with LAD occlusion (1). The coronary distribution can be defined by cardiac catheterization and this information is valuable when communicating regional wall contraction abnormalities (RWCAs) to the surgeon.
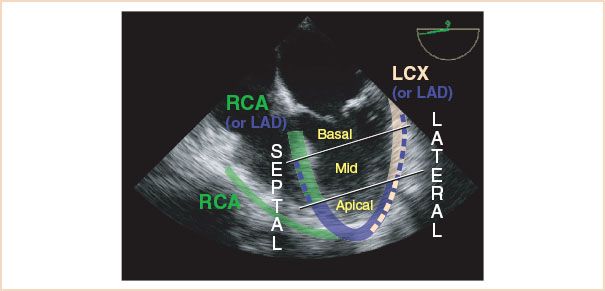
FIGURE 4.3 Segmental anatomy of the left ventricle in the midesophageal 4 chamber view and corresponding coronary perfusion (common solid color, variant dashed color). LAD, left anterior descending; LCX, left circumflex; RCA, right coronary arteries.
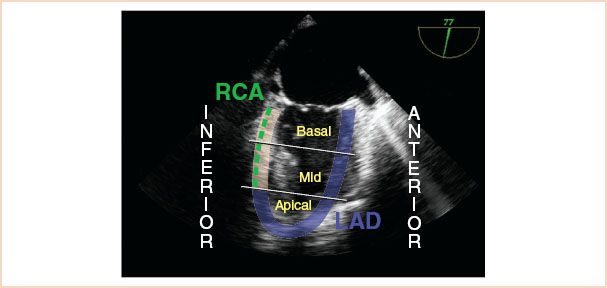
FIGURE 4.4 Segmental anatomy of the left ventricle in the midesophageal 2 chamber view and corresponding coronary perfusion. LAD, left anterior descending; RCA, right coronary arteries.
Echocardiographic Assessment of Coronary Arteries
Two-dimensional Visualization of Coronary Artery Anatomy
Coronary ostia: From the midesophageal (ME) AV SAX view, the coronary ostia can be visualized by a small degree of anteflexion or withdrawal of the probe (Fig. 4.6, Video 4.1A+B) (2). The left coronary ostium and the full length of the left main coronary artery to its bifurcation into the LAD and LCX are visible in the middle of the left coronary cusp at the 1- to 2-o’clock positions (Video 4.2) (2). The right coronary ostium is visible in the middle of the right coronary cusp at the 6- to 7-o’clock positions.
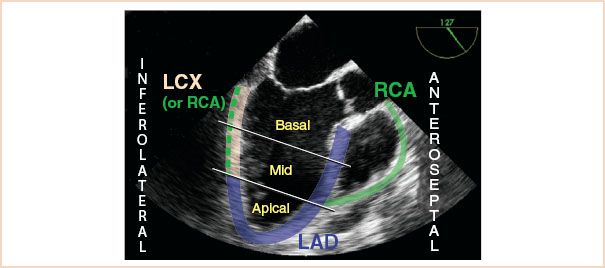
FIGURE 4.5 Segmental anatomy of the left ventricle in the midesophageal long axis view and corresponding coronary perfusion (common solid color, variant dashed color). LAD, left anterior descending; LCX, left circumflex; RCA, right coronary arteries.
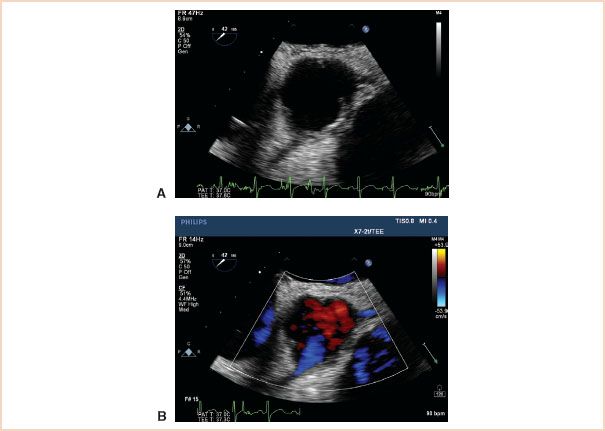
FIGURE 4.6 The left and the right coronary ostia in the two-dimensional aortic short-axis view (A) and with added color flow Doppler (B). The left coronary ostium is visible in the middle of the left coronary cusp at the 1- to 2-o’clock positions. The right coronary ostium is visible in the middle of the right coronary cusp at the 6-o’clock position (see Video 4.1A+B).
Left coronary artery: The LAD is visualized by further rotation to ~120 to 130 degrees and a slight turn of the probe to the left (Video 4.3). To follow the LCX from the left main bifurcation ME AV SAX view, the probe is turned leftward and advanced slightly while following the LCX on its way around the atrioventricular groove (Fig. 4.7, Video 4.4) (3).
Right coronary artery: The proximal RCA can also be imaged from the ME AV SAX view supported by slight anteflexion (Fig. 4.6, Video 4.1A+B) (2). In addition, the ostium and proximal parts of the RCA can be imaged in a modified ME AV LAX view at 120 to 160 degrees (Fig. 4.8, Video 4.5).
Doppler Evaluation of Coronary Artery Blood Flow
For color flow Doppler assessment of coronary blood flow, it is recommended to initially set the Nyquist limit to 50 cm/s for examination of the left coronary artery and to 20 cm/s for the RCA (4). Further reduction in the Nyquist limit is often required to obtain an adequate signal (5). The angle of incidence has to be taken into account when interpreting the results, as the angle may continuously change for neighboring sections of the same vessel due to the curved course of the coronary arteries. Normal coronary arterial blood flow shows a biphasic, laminar pattern with a short systolic wave of slower velocity and a longer diastolic wave of higher velocity with a deceleration slope. This can be measured using pulse wave Doppler (Fig. 4.9). Reported normal mean peak coronary flow velocities are in the range of 30 to 35 cm/s during systole and 70 to 75 cm/s during diastole for the left coronary artery, and approximately 25 cm/s during systole and 40 cm/s during diastole for the RCA (6). Visualization of the coronary ostia and arteries, and of intracoronary flow may be of importance in situations with acute new segmental wall motion abnormalities, for example, during separation from cardiopulmonary bypass (CPB) after mitral valve surgery (5,7), in patients with aortic dissection (8), or during transcatheter aortic valve implantation (9).
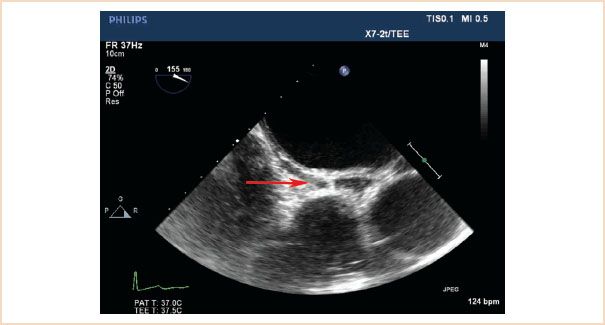
FIGURE 4.7 The left circumflex coronary artery (arrow) in long axis (see Video 4.4).
Detection of Coronary Artery Pathology
Although echocardiographic diagnosis of coronary artery stenosis is not a daily practice, it can be clinically valuable for assessing proximal vessel disease when coronary angiography is not practical (i.e., during emergent cardiac surgery) (4,10). Indicators are increased echo density, suggesting calcification of the vascular intima, and turbulent color Doppler flow signals. The following velocities have been published as threshold for hemodynamically relevant stenosis (>50%): Left main coronary artery >140 cm/s, LAD >90 cm/s, LCX >110 cm/s (11). The percentage reduction in vessel diameter or diastolic velocity–time integral at the site of stenosis compared to the normal segment proximal to the stenosis correlates well with the degree of stenosis diagnosed by coronary angiography.
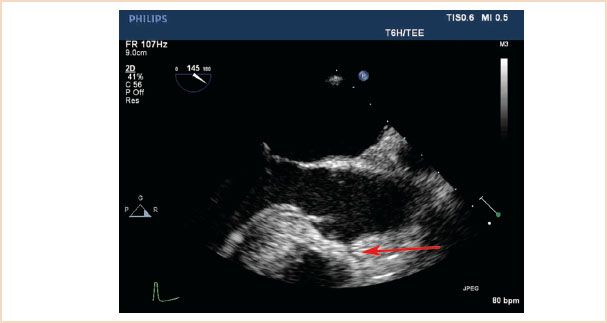
FIGURE 4.8 The right coronary ostium and proximal RCA (arrow) in a modified ME AV LAX view (see Video 4.5).
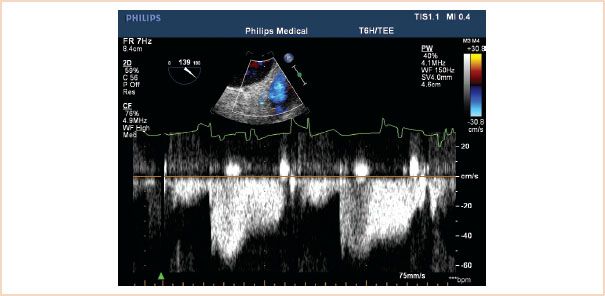
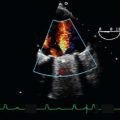
FIGURE 4.9 Pulsed wave Doppler recording of coronary flow. Normal coronary arterial blood flow shows a biphasic, laminar pattern with a short systolic wave of slower velocity and a longer diastolic wave of higher velocity.
PHYSIOLOGIC BASIS FOR THE DETECTION OF ISCHEMIA
Segmental endocardial motion and myocardial thickening are the foundations for echocardiographic detection of myocardial ischemia. As first observed by Tennant and Wiggers in 1937, occlusion of a coronary artery results in severe regional wall motion abnormality (RWMA) in the corresponding myocardium (12). Decades later, Pandian et al. established the value of echocardiography for detecting ischemic RWWAs (13,14). Since then, multiple human studies have shown that RWCA (i.e., reductions in systolic wall motion and/or thickening) detected by echocardiography are an earlier and more sensitive indicator of ischemia than electrocardiography (ECG) (15–21).
The progression in wall dysfunction from hypokinesia to dyskinesia correlates to the progression in degree of perfusion abnormalities which has been established in dog studies. Reductions in systolic wall thickening reflect subendocardial ischemia, while akinesia reflects ischemia sparing the subepicardial myocardial layer only, and dyskinesia plus acute wall thinning are seen in the setting of transmural ischemia (22). An echocardiographic dog study has found that segmental contraction abnormalities are induced only when myocardial perfusion is less than 25% of control (14). Although human data on the possible quantitative relationship between myocardial perfusion and segmental wall contraction are missing, from a clinical point of view acute changes in segmental function are highly indicative of acute ischemia.
Prolonged reduction or cessation of coronary flow leads to infarction. By echocardiography, acutely infarcted myocardium may look similar to acutely ischemic myocardium. In contrast, scar tissue presents echocardiographically as a thin, dense, and permanently akinetic or dyskinetic wall.
Although reduced or absent wall thickening may be the most sensitive indicator of ischemia, reduced endocardial motion may be the more conspicuous echocardiographic sign of severe ischemia. However, adjacent nonischemic regions may pull the endocardium of an ischemic area inward; this points out the importance of also considering wall thickening that will still indicate ischemia. Quite typically, unaffected, nonischemic regions develop exaggerated inward movement (termed compensatory hyperkinesis) that partially offsets the adverse effects of akinesis or dyskinesis in other regions on cardiac stroke volume. This is the principal reason why hemodynamic instability is a late and ominous sign of ischemia and usually only occurs with very severe regional or global ischemia.
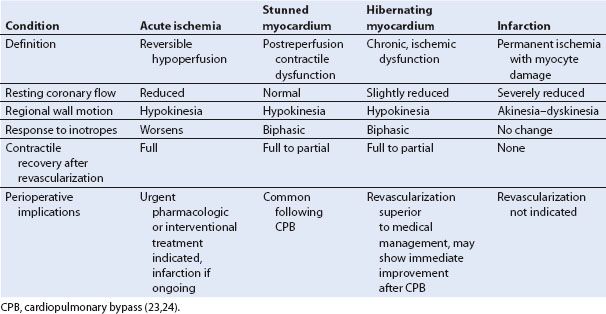
TABLE 4.1 Characteristics, Echocardiographic Findings, and Clinical Implications of Myocardial Ischemia
Clinical Syndromes of Myocardial Ischemia
The echocardiographer must be cognizant of the various presentations of ischemic tissue, including myocardial stunning and hibernation, which complicate the echocardiographic assessment of myocardial viability. Acute ischemia results from severe reductions in coronary blood flow and is associated reductions in wall thickening and endocardial inward motion (14). Stunned myocardium occurs following an acute episode of ischemia when a potentially reversible RWCA transiently persists despite full restoration of blood flow. Hibernation is a chronic ischemic condition where RWCAs persist in viable myocardium with marginal resting blood flow. LV function may improve markedly and mortality may be reduced following successful coronary revascularization. The time course of recovery is variable.
The echocardiographic appearance of stunning and hibernation during resting conditions is similar to acutely ischemic myocardium (Table 4.1) (25,26). Echocardiography and other imaging techniques can be used in combination with clinical algorithms for differentiation of myocardial ischemia, hibernation, stunning, and nonviable, infarcted tissue (27,28). Dobutamine stress echocardiography is used for the detection of viable hibernating myocardium. Viable myocardium shows improved regional contractile function (inotropic reserve) in response to low dose dobutamine administration. For patients with ischemic heart disease, dobutamine stress echocardiography predicts the likelihood of left ventricular functional recovery following revascularization. In addition, in patients with left ventricular dysfunction, caused by myocardial infarction, dobutamine stress echocardiography is useful for evaluating the presence of hibernating myocardium due to a residual stenosis that warrants intervention. Patients with left ventricular dysfunction who demonstrate myocardial viability with dobutamine stress echocardiography have a better survival with revascularization than with medical therapy (29). A key message is that an RWCA is not always caused by acute ischemia but may reflect stunning, hibernation, and/or nonviable infarcted tissue.
ECHOCARDIOGRAPHIC ASSESSMENT OF ISCHEMIA
Anatomic Localization of Ischemia: The 17-segment Model
The 17-segment model of LV topographical anatomy (30) (Fig. 4.2) provides a common nomenclature across imaging specialties to define the LV segmental anatomy. Using the 17-segment model in the setting of perioperative TEE has the advantage of applying the same topographical concept for describing regional function of the LV as in transthoracic echocardiography, cardiovascular magnetic resonance imaging, nuclear cardiology, and cardiac computed tomography (30). It also serves as the basis for correlating the location of RWCA with coronary perfusion.
Echocardiographic Imaging of the 17 Myocardial Segments
The 17-segment model divides the LV along its longitudinal axis into three levels plus the apical cap (Fig. 4.2). The basal and mid (midpapillary) levels are subdivided into six segments: The anteroseptal, anterior, anterolateral, inferolateral (formerly “posterior”), inferior, and inferoseptal segments. The apical level is subdivided into an anterior, lateral, inferior, and septal segment.
The three standard ME views (31) (ME four-chamber, ME two-chamber, and ME long-axis) (Figs. 4.3–Figs. 4.5) allow visualization of parts of all 17 segments. Although all the three views theoretically visualize the distant apical slice (segment 17), often the echo imaging plane transects the ventricle above the true apex and the TEE image is “foreshortened.” To obtain correct alignment of the imaging plane along the long axis of the LV, the echocardiographer should focus on obtaining the maximum long-axis dimension in each view. Favorable settings include a low ultrasound frequency (usually no higher than 6 MHz), because the apex is in the far field of the TEE image; a focal zone placed in the area of the apex; and optimized gain settings in that field.
The transgastric (TG) short-axis views (basal, mid, and apical) allow visualizing the entire radius of 16 segments excluding the apical cap. The TG basal and midpapillary short-axis views are unique in that myocardial territories perfused by all the three main coronary arteries are visualized (Fig. 4.2). Although ischemia monitoring in TG midpapillary short-axis view is popular, using this view alone is inadequate, because ischemia caused by stenosis in an artery more distal to this plane will be missed. Repeated assessment of multiple views is essential as limiting the examination to the TG midpapillary SAX view alone will miss the majority of RWCA (32). We advise comprehensive monitoring of all the 17 segments for ischemia utilizing both ME and TG imaging planes.
Coronary Perfusion of LV Segments
The coronary perfusion to the 17 LV segments is shown in Figures 4.2–4.5. Many segments have a consistent coronary artery perfusion. Recent imaging studies, however, have altered traditional concepts of coronary perfusion zones as well as reveal the significant individual variation in coronary supply to the myocardial segments. For example, the apical segments are now understood in the majority of cases to be supplied by the LAD with the LCX and RCA seen in a minority of individuals. The greatest overlap in coronary artery distribution occurs in the inferolateral region corresponding either to RCA or LCX territories, as well as the inferoseptal region that may be supplied by the LAD artery, RCA, or even a left-dominant LCX artery. Figure 4.2 incorporates these recent findings and emphasizes the large amount of myocardium supplied by the LAD artery and potential for substantial infarct size with LAD occlusion (1). In those segments with physiologic variability in coronary supply, the culprit coronary artery of an RWCA can often be identified by examining neighboring segments whose coronary supply is known. For example, the combination of ischemia in the anterolateral and inferolateral walls is consistent with a left dominant or co-dominant LCX occlusive disease while the presence of anterolateral ischemia without inferolateral wall ischemia is specific for a non-dominant LCX occlusion.
Assessment and Grading of Regional Wall Contraction Abnormalities
To grade the severity of ischemia, it is important to analyze both systolic myocardial thickening and endocardial inward motion (“radial shortening”) (Table 4.2). The American Society of Echocardiography/Society of Cardiovascular Anesthesiologists (ASE/SCA) guidelines for TEE examination classify systolic ventricular contraction in five grades (31): Normal contractility, mild hypokinesis, severe hypokinesis, akinesis, and dyskinesis (Table 4.2). For systolic myocardial thickening, a 50% increase is regarded as normal, but given substantial intersegment and intersubject variability, a value of 30% thickening has been defined as the lower normal limit (33). Similarly, systolic radial shortening has been defined as normal if it exceeds 30%.
TABLE 4.2 Five-grade Scale of Segmental Wall Contraction Abnormalities
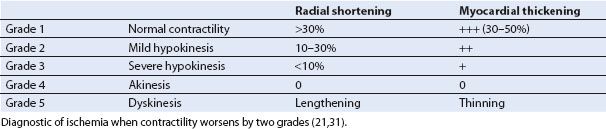
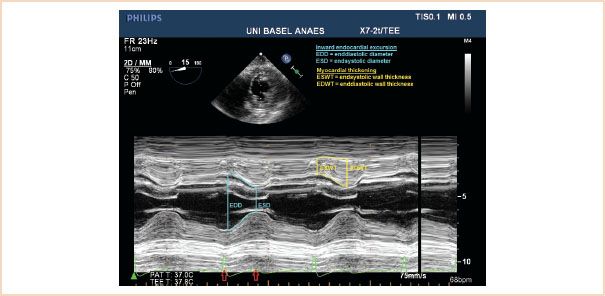
FIGURE 4.10 Normal LV M-mode (motion mode) reading. Normal inward endocardial excursion and wall thickening are illustrated on an M-mode image through the inferior (top) and anterior (bottom) walls in the transgastric short-axis view (top inset). Systole starts at the onset of the QRS complex and ends near the end of the T wave (arrows). M-mode echocardiographic imaging coupled with the electrocardiogram can on occasion provide helpful information regarding the timing of wall motion.
Related posts:
Stay updated, free articles. Join our Telegram channel

Full access? Get Clinical Tree


