Mitral Valve Stenosis
THE 19TH CENTURY PHYSICIAN JEAN Nicholas Corvisart established the diagnostic value of percussion in the physical diagnosis of cardiac disorders. He described the diastolic thrill of mitral stenosis (MS) as “a peculiar rushing like water, difficult to be described, sensible to the hand applied over the precordial region, a rushing which proceeds apparently from the embarrassment which the blood undergoes in passing through an opening which is no longer proportioned to the quantity of fluid which it ought to discharge” (1). As early as 1898, D. W. Samways discussed the potential for performing cardiac surgery in the most severe cases of MS in an article entitled “Cardiac Peristalsis: Its Nature and Effects,” published in The Lancet (2). In the modern era of heart disease, cardiac catheterization has provided hemodynamic information and assessed the severity of MS. Popovic et al. (3) investigated time-related trends in the use of preoperative invasive hemodynamic measurements in 1,985 patients with isolated valvular stenosis. During an 8-year study period, cardiac catheterization before valve surgery remained a common practice; however, it was performed primarily to ascertain coronary anatomy. The need for invasive hemodynamic measurements acquired during catheterization dramatically decreased, superseded by noninvasive hemodynamic measurements obtained with echocardiography (3). Currently, two-dimensional (2D) and Doppler echocardiography have supplanted cardiac catheterization in providing a complete evaluation of patients with MS (4).
MITRAL VALVE ANATOMY
Morphologically, the mitral valve (MV) apparatus is composed of the left atrial wall, mitral annulus, anterior and posterior MV leaflets, chordal tendons, anterolateral and posteromedial papillary muscles, and left ventricular myocardium (5,6). The valvular tissue can be divided into two commissural regions, the anterolateral commissure and the posteromedial commissure, and two leaflet areas, the anterior and posterior MV leaflets. The anterior mitral leaflet is somewhat triangular in shape, with an attachment to approximately one-third of the circumference of the mitral annulus. It is attached to the fibrous skeleton of the heart, as are the left coronary cusp and half of the noncoronary cusp of the aortic valve. The attachment of the posterior mitral leaflet to the mitral annulus is lengthier than that of the anterior mitral leaflet. Clefts along the free margin of the posterior leaflet allow the identification of individual scallops (5). Although the anterior mitral leaflet base-to-margin dimension is longer than that of the posterior mitral leaflet, and although the basal attachments are different for each leaflet, the two leaflets are nearly identical in overall surface area. Chordal tendons from each papillary muscle attach to both of the MV leaflets. On average, 120 chordal tendons attach to the undersurface of the MV leaflets. The chordal tendons subdivide as they project from the papillary muscles toward the MV leaflets. The spaces between the chordae serve as secondary orifices between the left atrium (LA) and left ventricle (LV) (6).
The normal MV orifice area is approximately 4 to 6 cm2. An orifice area in the range of 2 cm2 causes a minimal elevation in the transvalvular pressure gradient, whereas a valve area of less than 1.4 cm2 is associated with a significant transvalvular pressure gradient and the clinical presentation of MS (7–9).
ETIOLOGY OF MITRAL STENOSIS
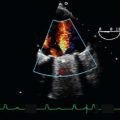
The causes of MS include the following: Rheumatic heart disease, LA myxoma, severe mitral annular calcification, thrombus formation, parachute MV deformity, congenital MS, supravalvular mitral ring, and cor triatriatum (6,10). Figures 9.1 and 9.2 depict a large LA myxoma obstructing mitral inflow.
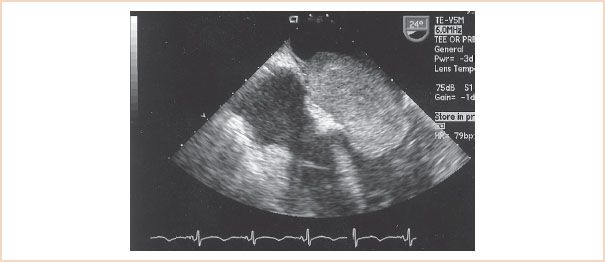
FIGURE 9.1 A transesophageal echocardiographic midesophageal four-chamber image displays a 3- × 6-cm left atrial myxoma causing symptomatic mitral stenosis. The atrial myxoma is visualized prolapsed through the mitral valve into the left ventricular cavity during diastole.
The most common cause of MS in adult patients is still rheumatic heart disease (3,6,9). Pathologic features of rheumatic MS include fusion of the commissures; contracture, scarring, and diffuse thickening of the leaflet tissue and subvalvular apparatus; and calcium deposition within the mitral leaflets. This process results in a diminished size of the effective valvular orifice, in addition to valve rigidity as a consequence of the leaflet fibrosis and calcification. As the valve area becomes more restricted, increases in the transvalvular pressure gradient and LA pressure may lead to pulmonary hypertension with tricuspid regurgitation and right ventricular dysfunction (6,8–10).
TRANSESOPHAGEAL ECHOCARDIOGRAPHIC EVALUATION OF MITRAL STENOSIS
A discussion of the complete diagnostic evaluation follows, and the chapter concludes with a concise summary of the recommended approach to an accurate diagnosis of MS.
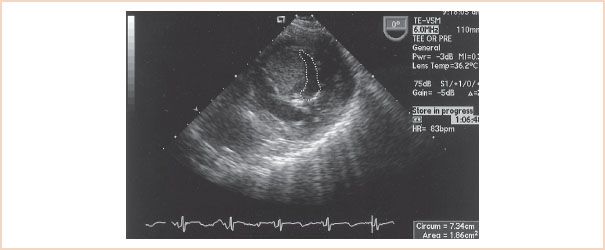
FIGURE 9.2 An atrial myxoma displayed from a transgastric basal short-axis imaging plane occupies a large portion of the mitral orifice. The mitral valve orifice measures 1.86 cm2 in diastole.
Two-dimensional Echocardiography
The anatomy of MS can be defined more clearly from multiple imaging planes of 2D transesophageal echocardiography (TEE) than by any other diagnostic modality. On the basis of the pathophysiologic features of rheumatic MS, key features that must be identified echocardiographically include the following: Degree of leaflet thickening, amount of calcium deposition, extent of subvalvular involvement, decrement in leaflet mobility, and overall changes in chamber dimensions and function (11). Related issues, such as involvement of other valve structures and pulmonary hypertension, can also be assessed.
Mitral leaflet tissue can display varying degrees of thickening and calcium deposition that cause the MV leaflets to appear “enhanced,” or echo-bright. The “shadow” cast by calcium may obstruct the view of the distal anatomy; one of the strengths of TEE in this circumstance is the ability to view the structures from another plane, so that the operator can see beyond the “shadow.” The standard midesophageal (ME) views (four-chamber, commissural, two-chamber, and long-axis) assist in evaluating the extent of disease. The chordal tendons can display varying degrees of thickening and contracture. The transgastric (TG) long-axis imaging plane provides the best information with regard to the extent of subvalvular involvement in the rheumatic process. The characteristic 2D echocardiographic findings associated with rheumatic MS are represented in Figure 9.3 and Videos 9.1 to 9.3. Rheumatic heart disease results in varying degrees of restricted mitral leaflet motion. In 2D TEE, restricted leaflet motion is characterized by decreased leaflet excursion and by diastolic “doming” of the anterior mitral leaflet. The appearance of “doming” is the result of fusion of the anterior and posterior leaflets along the medial and lateral commissures. The leaflets are restricted or abnormally stenotic at the tips. The maximal amplitude of motion occurs in the mobile midsection, giving the anterior mitral leaflet an arched appearance, convex toward the LV outflow tract in diastole (12,13). Figure 9.3 and Video 9.1 demonstrate the characteristic “doming” or “hockey stick” deformity of the anterior mitral leaflet in diastole.
Echocardiographic Scoring System
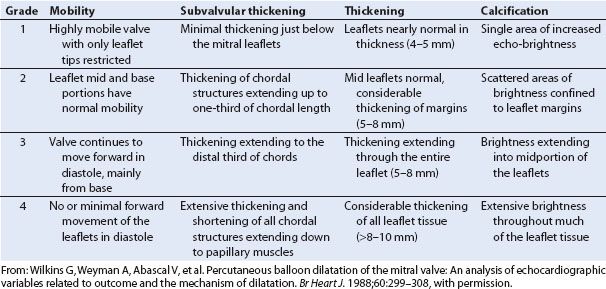
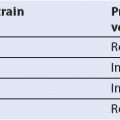
In 1988, Wilkins et al. (11) developed an echocardiographic scoring system to assess MV morphology and its relationship to the success of percutaneous balloon dilation of the MV. Each of the four components of the scoring system is graded on a scale of 0 to 4, such that total scores range from 0 to 16. The four components of the scoring system assess the MV for the pathologic changes characteristically associated with rheumatic heart disease: Reduced leaflet mobility, leaflet thickening, subvalvular thickening, and calcification. These investigators reported that a high echocardiographic score (>11), which is representative of advanced leaflet deformity, was associated with a suboptimal outcome after balloon dilation of the MV. A low echocardiographic score (<9) was associated with an optimal outcome (11). Table 9.1 presents the scoring system and describes what each grade on the scale represents for each of the four components. Although this scoring system was developed for patients undergoing mitral balloon dilation, it can serve as a useful guide during the TEE examination of patients with rheumatic MS.
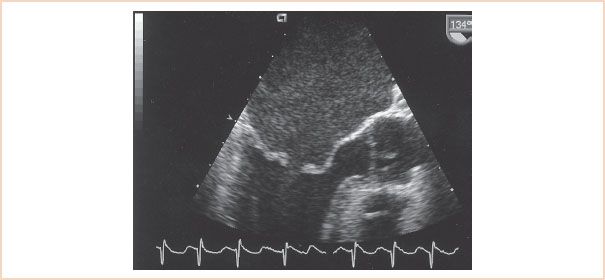
FIGURE 9.3 A midesophageal AV long-axis view of rheumatic mitral stenosis displays the characteristic diastolic “doming” of the anterior mitral leaflet in diastole and an enlarged left atrium. The mitral leaflets are thickened, particularly at their margins, and appear echo-bright secondary to calcium deposition.
TABLE 9.1 Echocardiographic Scoring System
Standard chamber dimensions can be altered depending on the duration and degree of MS. Typically, an increase in the LA area is associated with chronic volume and pressure overload. Because of the low-flow state, LA spontaneous echo contrast or thrombus formation may be present. Daniel et al. (14) characterized LA spontaneous echo contrast as “dynamic clouds of echoes curling up slowly in a circular or spiral shape within the left atrium.” They found that LA spontaneous echo contrast is useful in identifying those patients with MS who are at increased risk for thromboembolic events. TEE is more sensitive than transthoracic echocardiography in detecting LA spontaneous echo contrast. Since LA spontaneous echo contrast indicates blood stasis and may be a warning of thrombus formation, it is critical to scan the LA completely to exclude thrombus formation (14,15). Figure 9.4 displays an ME view of the LA with a thrombus in the LA appendage.
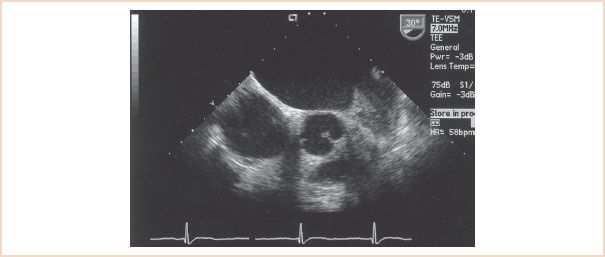
FIGURE 9.4 A left atrial appendage thrombus is visualized from a short-axis imaging plane of the left atrium.
Diastolic properties of the LV are also affected in rheumatic MS. In patients with severe isolated rheumatic MS, Liu et al. (16) demonstrated reduced LV diastolic compliance. The reduction in compliance appeared to be related to a functional restriction resulting from chordal tethering to a rigid valve apparatus, a finding that was immediately reversed after balloon mitral valvuloplasty. LV systolic performance in patients with severe isolated MS was nearly identical to that in age-matched controls. Chronic elevation in LA pressure can cause structural alterations in the pulmonary vasculature, leading to pulmonary hypertension and ultimately right-sided heart failure (8,9). TEE evaluation of the right side of the heart may demonstrate varying degrees of right ventricular dysfunction and tricuspid regurgitation. A comprehensive 2D and Doppler TEE examination of the heart should be performed to exclude these associated findings and other valvular pathology.
Physiologic Assessments
Determination of the Pressure Gradient
Normal flow velocity across the MV is less than 1.3 m/s. The pressure drop across a stenotic valve can be calculated from the instantaneous flow velocity by means of the simplified Bernoulli equation (17,18):

where v represents the instantaneous velocity.
The equation is modified from the original in that the terms that account for viscous friction and flow acceleration have been eliminated. Since the velocity distal to the obstruction is significantly greater than the velocity proximal to the obstruction, the proximal velocity term can be ignored (17,18). Continuous wave Doppler interrogation of the inflow velocities across the valve is performed with the use of the ME four-chamber, two-chamber, or long-axis view. Following manual tracing of the diastolic spectral profile, the echocardiographic machine software provides a mean gradient in millimeters of mercury. Figure 9.5 displays a mean gradient measurement across the MV in a patient with MS obtained with continuous wave Doppler and the ME four-chamber view. It is important to note that an increase in forward flow through the mitral orifice, such as occurs in severe mitral valvular regurgitation, can result in a high transmitral gradient although the valve is only mildly stenotic. One therefore must be aware that the degree of MS can be overestimated in the face of significant mitral regurgitation (4). Pressure gradients are underestimated if the angle between the sampling beam and the flow vector is large (>20 degrees) (17,19). Visualizing the inflow jet with color Doppler and aligning the sample beam with the color inflow can help minimize this problem (19). In general, a mean gradient of more than 10 mm Hg across a stenotic valve is considered to indicate severe stenosis (20) (Table 9.2).
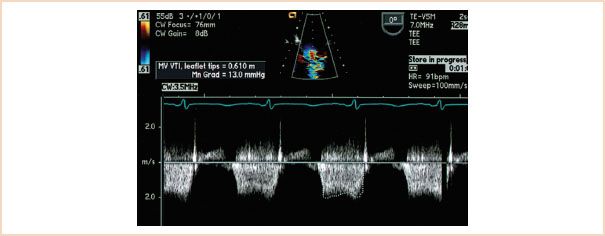
FIGURE 9.5 A diastolic spectral profile of mitral inflow has been obtained with continuous wave Doppler in this patient with mitral stenosis. The profile has been traced out, and a mean pressure gradient of 13 mm Hg has been calculated with the software available within the machine. Note that the inflow velocities are close to 2 m/s.
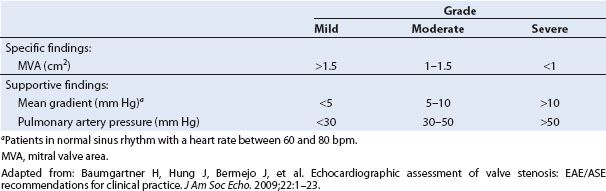
TABLE 9.2 Grading Severity of Mitral Stenosis
Calculations of Valve Area
The severity of MS is also estimated by determining the reduction in MV area. This can be done with the use of 2D and Doppler echocardiographic techniques.
Planimetry Valve Area
Planimetry is a conceptually simple 2D technique used to calculate the MV area. It involves directly visualizing the MV orifice in diastole from a TG basal short-axis imaging plane and tracing the orifice margins to acquire a valve area measurement in square centimeters (Fig. 9.6). The results obtained with this technique have been shown to correlate well with valve area measurements acquired invasively (3,12,21). Figure 9.6 demonstrates the use of planimetry in calculating the MV area from the TG basal short-axis imaging plane in a patient with rheumatic MS. A number of operator “pitfalls” should be recognized when this technique is used to optimize its accuracy. Instrumentation factors are critical in obtaining adequate images for planimetry. For example, if the receiver gain settings are too low, the edges of the valve may be obscured, resulting in “echo dropout,” and the valve area will be overestimated (12). The opposite occurs when the gain settings are set too high, with resultant image saturation and a falsely narrowed valve orifice (22). Inadequate imaging plane orientation is another important measurement error with this technique. The stenotic MV looks like a funnel in diastole, the narrowest part being the commissural tip of the valve. It is critical to scan the MV orifice superiorly to inferiorly to acquire the smallest orifice area. Measuring too superiorly, in the body of the leaflets, can overestimate the valve area (21–23). In patients who have undergone mitral valvuloplasty, the valve area may be underestimated because of the inability to measure the extent of the commissural fractures with planimetry.
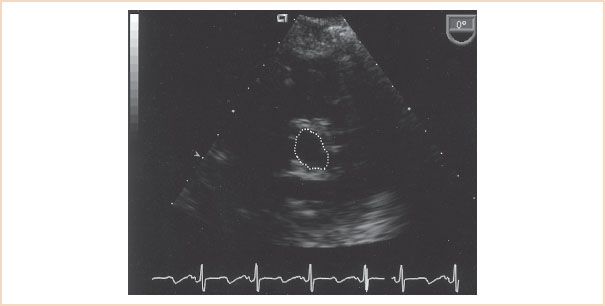
FIGURE 9.6 The mitral valve orifice assumes a “fish mouth” appearance in a transgastric basal short-axis imaging plane in a patient with rheumatic mitral stenosis. Tracing of the orifice margins of the mitral valve during diastole resulted in a mitral valve area measurement of 1.25 cm2.
Related posts:
Stay updated, free articles. Join our Telegram channel

Full access? Get Clinical Tree


