, Gustav Andreisek2 and Erika J. Ulbrich2
(1)
Phoenix Diagnostic Clinic, Cluj-Napoca, Romania
(2)
Institute of Diagnostic and Interventional Radiology, University Hospital Zürich, Zürich, Switzerland
6.1 Anatomy and Normal MRI Appearance
The knee articular cartilage is a hyaline cartilage composed of water (65–80 %), collagen (10–20 %, with type II collagen representing 90–95 % of the network), proteoglycans (10–20 %), and chondrocytes (1–5 %) [1]. Morphologically there are four cartilage zones with different composition, structure, and function. The superficial zone is the thinnest zone of the cartilage (10–20 % from the cartilage thickness) and is covered by synovial fluid. It is mainly composed of collagen fibers oriented parallel to the articular surface and provides shear strength. The transitional zone is the thickest zone (40–60 % from the cartilage thickness) and contains randomly oriented fibers, and its role is to distribute stress uniformly [2]. The deep or the radial zone (30 % of the cartilage thickness) contains the largest diameter of collagen fiber. The fibers are oriented perpendicularly to the articular surface, and its role is to anchor the cartilage to the subchondral bone [2]. The calcified cartilage zone (5 % of the cartilage thickness), the deepest zone of the cartilage, is a mineralized thin area and represents a shock absorber along the subchondral bone [1].
Hyaline cartilage lacks vascular, neural, and lymphatic networks, as well as local progenitor cells [3]. The sustenance of the cartilage is provided by diffusion from the synovial fluid, by vessels from the synovial membrane, and by vessels of the subchondral bone that are penetrating the calcified cartilage zone. The cartilage and the subchondral bone represent a functional unit with interconnected functions with the subchondral bone providing nourishment and vascularization to the cartilage [4]. The subchondral bone also protects the hyaline cartilage against damages caused by excessive loads [4].
The cartilage thickness depends on the anatomic location, the height, and the weight of the patient. The mean cartilage thickness on histological sections of the knee ranges from 1.65 to 2.98 mm [5] with the mean percentage difference between cartilage thickness in magnetic resonance imaging and direct measurement from histological sections about 10 % [6].
Currently, a vast amount of different MR sequences that enable qualitative, semiquantitative, or quantitative assessment of articular cartilage are available. These techniques can be classified into morphological and compositional techniques [7] (Table 6.1). Despite many promising studies and scientific reports, most of the compositional techniques do not play a role in the clinical routine. The clinical routine is still dominated by morphologic assessment of articular cartilage (Fig. 6.1). Thus, regardless the clinical context (traumatic, inflammatory, or degenerative), the MR knee protocol should include at least one morphologic, high-resolution, cartilage-sensitive MR sequence (Figs. 6.1 and 6.2).
Evaluation | MRI sequences | Type of information |
|---|---|---|
Morphological | 2-Dimensional T2 fast spin echo (2D T2 FSE) | Qualitative morphological information: |
2-Dimensional proton-density (2D PD) FSE | Cartilage signal intensity | |
3-Dimensional fast spin echo (3D FSE) | Cartilage thickness | |
3-Dimensional fast spin-echo sampling perfection with application-optimized contrast using different flip-angle evolutions (3D FSE SPACE) | Subchondral lesions characterization | |
3-Dimensional T1 spoiled gradient-echo (3D SPGR and FLASH) | Quantitative morphological information: | |
3-Dimensional dual echo steady state (DESS) | Cartilage volume (VC) | |
3-Dimensional balanced steady-state free precession pulse sequences (WS-bSSFP) | Area of cartilage surface (AC) | |
Cartilage thickness (ThC) | ||
Area of subchondral bone (tAB) | ||
3-Dimensional driven equilibrium Fourier transform (DEFT) | The denuded area (dAB) | |
Compositional (mainly used in clinical research for early osteoarthritis detection and cartilage repair) | T1 mapping (2-dimensional or 3-dimensional) | Detects regional variation of collagen network and glycosaminoglycan content |
T2 mapping | Reflects the collagen component of the extracellular matrix (collagen concentration and fibers orientation); water content | |
T2 mapping | Quantitative information on collagen fibers integrity and changes in bound water | |
Delayed gadolinium-enhanced MRI of cartilage (dGEMRIC) | Glycosaminoglycans depletion | |
Sodium imaging | Glycosaminoglycans depletion | |
Diffusion weighted | Collagen network and glycosaminoglycans content; more sensitive than T2 mapping and might also provide information on the nutrition of the repair tissue |
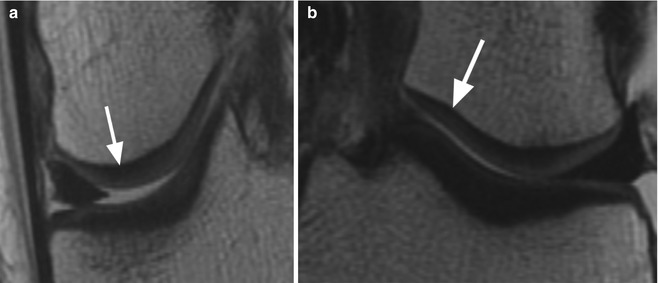
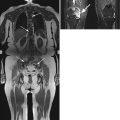
Fig. 6.1
Normal cartilage. Coronal proton-density (PD) FSE images (a, b) show the normal cartilage appearance in the medial compartment (arrow in a) and lateral compartment (arrow in b). This standard 2-dimensional (2D) MR sequence FSE enables the morphological evaluation of the cartilage in clinical routine practice
Fig. 6.2
Normal cartilage thickness and normal cartilage signal intensity on axial proton-density (PD) FSE fat-suppressed image (arrow)
The qualitative evaluation or the morphological evaluation of the cartilage is performed by using different MR sequences that includes all standard 2-dimensional (2D) MR sequences (2D fast spin-echo sequences) (Figs. 6.1 and 6.2) as well as 3-dimensional (3D) MR sequences [7] (Table 6.1). The morphological evaluation provides information about the structural integrity of the cartilage that refers to thickness and signal intensity, the diffuse or focal cartilage loss, and the subchondral bone changes. The advantages of the so-called “conventional” 2-dimensional (2D) MR sequences result from their relatively short acquisition time and from the practical fact that they are extensively used in the routine clinical MR knee protocol being able to provide in the same time accurate information about all the other structures (e.g., meniscus, ligaments and tendons, bone).
Morphological evaluation may be also used for scoring cartilage damage by using semiquantitative criteria especially in clinical research (assessment of ostearthritis) [8]. WORMS (whole-organ MR imaging score) [16], KOSS (knee osteoarthritis scoring system) [17], and BLOKS (Boston-Leeds osteoarthritis knee score) [18] are such semiquantitative measurements in which the cartilage damage is assessed concomitant with other structures of the knee (e.g., menisci, subchondral bone, osteophytes, and synovial membrane) [8].
Most of the compositional MRI techniques are relatively new developed MR sequences which include various T2- and T2-mapping techniques, delayed gadolinium-enhanced magnetic resonance imaging of cartilage (dGEMRIC), sodium or natrium imaging, diffusion-weighted imaging, and diffusion tensor imaging, as well as magnetization transfer imaging techniques [7–12] (Table 6.1). The semiquantitative and quantitative measurements used in compositional techniques are used for obtaining information regarding the hydration of the cartilage, the glycosamine content, and the orientation of the collagen fibrils (Table 6.1). These MR techniques often need a long scan time, special equipment, and advanced and time-consuming post-processing. Thus, these are mainly used in clinical research especially in monitoring the effects of cartilage-preserving therapies, but not for clinical routine.
6.2 MRI Pathological Findings
The pathological changes of the cartilage and the subchondral bone may be classified based on the etiology in nontraumatic or traumatic lesions. The traumatic lesions may involve only the articular cartilage, only the subchondral bone, or both the articular cartilage and the subchondral bone (Table 6.2).
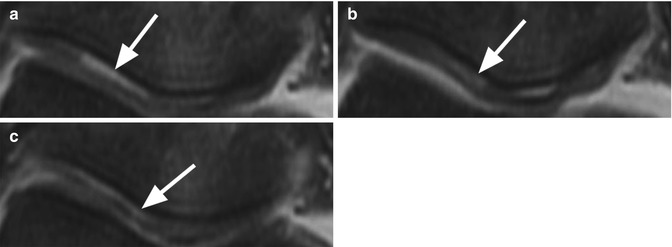
Table 6.2
Osteochondral lesions
Type of lesion | Articular cartilage involvement | Subchondral bone involvement |
|---|---|---|
Degenerative | Thinning (due to dehydration and mechanical stress)/denudation | Attrition |
Edema | ||
Subchondral cyst | ||
Inflammatory | Thinning (due to erosions from inflamed synovium)/denudation | Edema |
Subchondral erosions | ||
Osteonecrosis (idiopathic or secondary) | Often involved | Focal defect |
Flattening of the surface | ||
Traumatic lesions | ||
Cartilage fracture | Focal lesion with abrupt margins | No involvement or subchondral edema |
Linear lesion at the base of the cartilage | No involvement | |
Osteochondritis dissecans (idiopathic or secondary) | Cartilage and bone involvement: subchondral fracture extending through the cartilage | |
Bone bruises | May be affected | Diffuse edema (no fracture line) |
Subchondral fracture | With/without involvement | Subchondral linear fracture |
Surrounding bone edema | ||
Fig. 6.3
Cartilage delamination in a 31 year old volleyball player after acute knee distortion. Three consecutive axial proton-density (PD) FSE fat-suppressed images (a–c) show a typical linear high-signal-intensity change at the base of the patellar cartilage (arrows)
6.2.1 Nontraumatic Cartilage Changes and Subsequently Subchondral Lesions
The cartilage of the knee is involved in osteoarthritis of the joint as well as in inflammatory diseases and may be accompanied by subchondral changes (edema, cysts, erosions). The damaged cartilage is routinely assessed qualitatively based on the thickness changes and signal-intensity alteration. Although cartilage thinning and denudation of subchondral bone are changes that characterize both degenerative and inflammatory diseases, the pathogenesis of these changes is different. Deterioration of the articular cartilage in degenerative disease is the result of dehydration and repetitive microtrauma of the cartilage, while in inflammatory arthritis, the alteration of the cartilage thickness is the result of proliferation of the vascular connective tissue of the synovial membrane (pannus) and the effect of the inflammatory mediators (immunoglobulins, enzymes).
The degenerative changes within the articular cartilage can be divided into an initial phase of superficial degeneration that continues with the phase of basal degeneration [19]. The earliest feature of degeneration starts with discontinuities of the most superficial zone of the cartilage tangential at the articular surface (superficial degeneration), and these changes are not visible on routine MR sequences. Basal degeneration develops in the deep layers of cartilage and manifests as areas of focal softening and swelling attributed to edema and abnormal matrix-protein substances followed by fibrillation, fragmentation that may ultimately denude areas of subchondral bone (Fig. 6.4) [4, 20]. The first basal degeneration changes, also often referred to as chondromalacia, may be seen on MR images as areas of low or high signal intensity (Fig. 6.4) as a result of localized edema without alterations in cartilage thickness and without cartilage surface irregularities [20]. The clinical significance of these MR findings has not been clearly demonstrated, and moreover, the alteration of the signal intensity within cartilage cannot only be seen in the initial phases of degeneration but also in trauma, as cartilage contusion may have the same MRI appearance (Fig. 6.5).
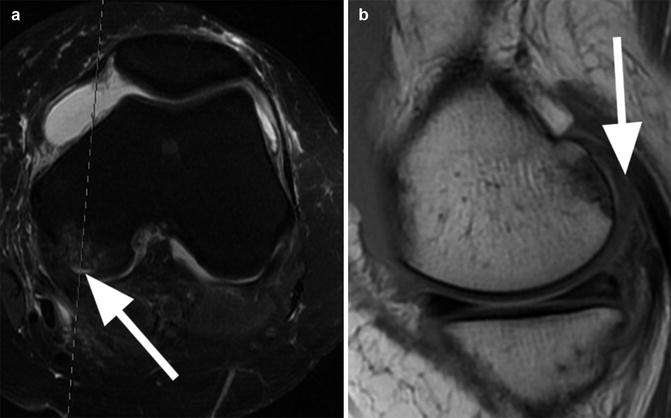
Fig. 6.4
Initial phase of cartilage degeneration. Coronal proton-density (PD) FSE image shows cartilage thinning accompanied by irregularities and high-signal changes at the surface of the cartilage (arrow)
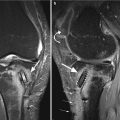
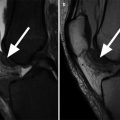
Fig. 6.5
Cartilage delamination in a 26 year old male. Axial proton-density (PD) FSE fat-suppressed image (a) shows a high-signal-intensity linear lesion at the base of the cartilage of the medial femoral condyle (arrow) with subchondral edema. Sagittal proton-density (PD) FSE image (b) at the level of the lesion shows a normal cartilage thickness (arrow). Similar cartilage and subchondral changes may be also seen in the initial phases of degeneration
Regardless the mechanism, degenerative or inflammatory, the MRI report should describe the cartilage thinning or denudation (location and dimension of the affected area) and the presence or absence of subchondral changes. On MR images, thinning of the cartilage is seen as a decreased of normal thickness accompanied by irregularities and high-signal changes at the surface of the cartilage (Fig. 6.4). Cartilage thinning is usually easy to appreciate when present unilaterally (only the medial femoral condyle and/or tibia is affected) but sometimes difficult when present bilaterally because radiologists tend to take the contralateral side for comparison. However, bilateral cartilage thinning is often a sign of severe osteoarthritis of the knee or severe inflammation, and often all articular cartilage surfaces including the patellar are involved. Thus, evaluation of cartilage thinning should be considered not only as a search for focal or localized lesions, but one should take a step back and take a “global” view on all cartilage surfaces altogether.
The same rule applies to denuded areas of subchondral bone which are defined as areas where the subchondral bone is not covered by articular cartilage (Fig. 6.6) [21]. Despite the fact that a full cartilage loss seems to be easy to detect, in our clinical practice, we have seen that beginners/first-year residents struggle with this diagnosis especially when the loss is present in the medial and lateral compartment of the femorotibial joint. Difficulties for diagnosis may arise from the fact that when the cartilage is completely lost, beginners tend to misinterpret susceptibility artifacts arising from the subchondral bone which is then exposed directly to the joint fluid. Interestingly, they usually have less diagnostic problems with the patellar cartilage likely because this cartilage is much thicker and complete loss or thinning is therefore better to appreciate.
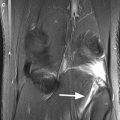
Fig. 6.6
Denuded areas on both femoral condyles. Coronal proton-density (PD) FSE fat-suppressed image shows bilateral femoral areas where the subchondral bone is not covered by articular cartilage (arrows). Note the absence of the subchondral changes
The specific subchondral changes that appear in degenerative and inflammatory diseases have a different pathogenesis that can be explained through the interconnection between the cartilage and the subchondral bone. In osteoarthritis, the overloading and the vascular obstruction within the subchondral bone leads to subchondral sclerosis, bone marrow edema and bleeding, and subchondral cysts. In the region of subchondral edema, in osteoarthritis the most common pathological changes are necrosis, fibrosis, and trabecular abnormalities [22]. The etiology of subchondral cysts is unknown. Some authors [23] suggest that the intra-articular pressure leads to intrusion of joint fluid into the subchondral bone. Another theory suggests that the bony contusion of two opposing articular surfaces results in subchondral bone necrosis followed by the cyst formation [24]. Pathologically, the subchondral cysts are cavitary lesion with an epithelial lining that is fluid filled [25]. In inflammatory diseases such as rheumatoid arthritis, subchondral edema has special significance. Histologically, it has been shown that edema is the result of osteitis, in which the bone marrow beneath the joint is invaded by an inflammatory and vascular lymphoplasmacytic infiltrate [26]. The inflamed synovium that invades the subchondral bone produces erosions that are defined as cavitary lesions filled with granulation tissue.
On MR imaging, the subchondral edema appears as ill-defined areas of low signal intensity on T1-weighted images and high signal intensity on T2-weighted images (Fig. 6.7). Some confusion exists in the literature about the nomenclature of cysts and erosions. The use of the terms like “cysts” or “erosions” on radiography can be a misnomer because the radiologist is unable to determine whether a radiolucent lesion is a fluid-filled lesion or is filled with solid material [27]. On MR imaging, both lesions are defined as relatively well-defined foci of altered signal intensity which appear hypointense on T1-weighted images and hyperintense on T2-weighted images (Fig. 6.8). Contrast-enhanced T1-weighted images may differentiate fluid-filled cysts from pannus-filled erosions. The latter enhances greatly on gadolinium-enhanced T1-weighted images immediately after contrast administration, while the cysts may enhance only at peripheral margins [28]. However, care needs to be taken when delayed contrast-enhanced MR imaging (e.g., in indirect MR arthrography) is used since it shows contrast diffusion in fluid-filled spaces causing the bright signal of cystic fluid on T1-weighted sequences similar to erosions [28].
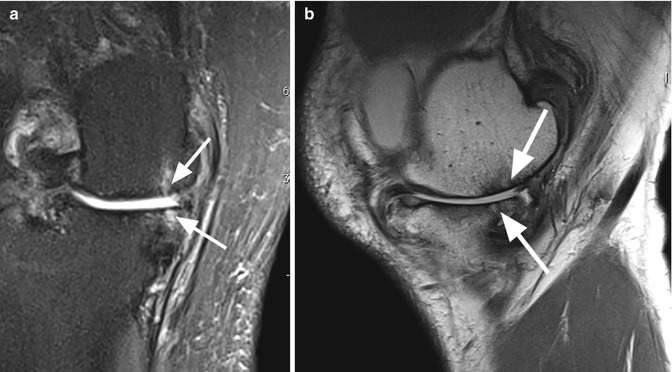
Fig. 6.7
Subchondral tibial and femoral edema in a 62 year old female with advanced medial osteoarthritis. Coronal proton-density (PD) FSE fat-suppressed image shows diffuse high-signal-intensity edema of the subchondral bone (large arrows) in the areas of bone denudation (small arrow). Note the medial meniscal extrusion (curved arrow)
Fig. 6.8
Subchondral cysts in a 74 year old male with osteoarthritis. Coronal proton-density (PD) FSE fat-suppressed image (a) and sagittal proton-density (PD) FSE image (b) show small cystic lesions (arrows) of the subchondral tibial and femoral bone in the medial compartment
The subchondral bone attrition and the formation of osteophytes are other subchondral changes that may appear in osteoarthritis. Bone attrition is the flattening or depression of the bony surface, and it seems that it is the result of subchondral microfractures and remodeling (Figs. 6.9 and 6.10) [29]. Osteophytes are hypertrophic ossifications that are the result of mechanical instability of the joint, proliferative response caused by adjacent synovial membrane, and tissue response from mechanical stress at the insertion of the capsule [30]. Although the osteophytes occur typically at marginal locations, they may occur also in central location within the articular cartilage [31, 32]. On MR imaging, the osteophytes are identified as abnormal marginal or central ossifications with similar signal intensity as the subchondral bone (Figs. 6.10 and 6.11). The central osteophytes are better depicted and evaluated on MR imaging than on radiographs [32].
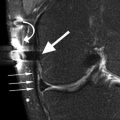
Fig. 6.9
Bone attrition. Sagittal proton-density (PD) FSE image shows depression of the bony surface on both, femoral condyle (large arrow) and posterior tibial plateau (small arrows). These changes are the result of subchondral microfractures and remodeling
Fig. 6.10
Osteophytes and bone attrition. Coronal proton-density (PD) FSE image shows a lateral femoral osteophyte (large arrow) and complete denuded bone areas of the medial femoral condyle and medial tibial plateau with femoral and tibial bone attrition (small arrows)
Fig. 6.11
Intracartilaginous osteophyte. Axial proton-density (PD) FSE fat-suppressed image shows an intracartilaginous osteophyte of the medial patellar facet which involves the entire thickness of the cartilage (large arrow). Note also the peripheral small osteophyte (small arrow)
6.2.2 Osteonecrosis of the Subchondral Bone
Spontaneous idiopathic osteonecrosis of the knee (SONK/Morbus Ahlback) affects middle-aged and elderly adults and is more frequently seen in women than in men with the medial side of the joint most commonly affected than the lateral side. The lesion usually results from circulatory impairment of the subchondral bone leading to ischemia. The etiology remains unclear, but the localized vascular insufficiency may explain subchondral osteonecrosis due to disruption of the nutrition supply to the cartilage above [33]. Spontaneous osteonecrosis of the knee has been also described as a complication after arthroscopic repair of the meniscal tears, and the lesion may be a late sequela of meniscal injury in association with cartilage defects and arthroscopic surgery [34].
Secondary osteonecrosis is caused by a number of well-recognized predisposing factors for osteonecrosis (e.g., systemic lupus erythematosus, steroid use, pancreatitis, alcoholism, HIV infection and renal transplants) or may be secondary to an old trauma [35].
MR imaging is the most accurate imaging technique for detecting osteonecrosis. The most specific MR imaging sign is the double-line sign at the periphery of osteonecrosis. The sign represents a reactive interface between necrotic bone and normal bone marrow and consists by an outer hypointense rim representing sclerotic bone and an inner rim and hyperintense on T2-weighted images, representing hypervascular granulation tissue (Fig. 6.12) [36]. This sign is more commonly seen in patients with secondary osteonecrosis compared to patients with idiopathic osteonecrosis in which the double-line sign can be absent (Fig. 6.13) [35]. However, there might be exceptions to this rule of thumb, and knowledge of the patient’s history is necessary in these cases. Thus, whenever osteonecrosis is present, the patient’s charts should be reviewed for predisposing factors. There is also a subcortical focal area of low-signal on both T1- and T2-weighted images representing the necrotic bone with deformity and flattening of the articular surface (Fig. 6.12). Lesions may be surrounded by bone marrow edema.
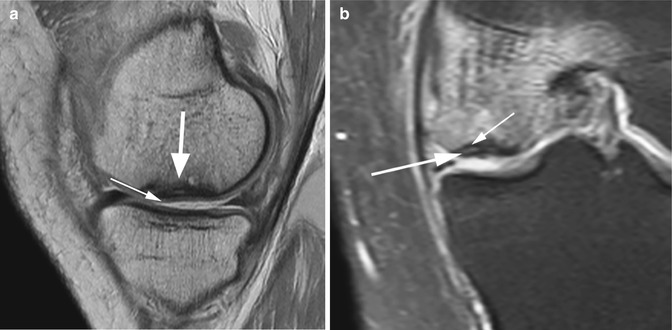
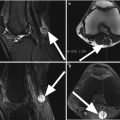
Fig. 6.12


Avascular osteonecrosis (SONK) of the medial femoral condyle in a 43 year old male (SONK). Sagittal proton-density (PD) FSE image (a) and coronal proton-density (PD) FSE fat-suppressed image (b) show a subcortical area of low signal intensity (large arrow in a) with depression of the subchondral bone. The cartilage thickness is almost normal (small arrow in a). The double-line sign at the periphery of osteonecrosis is demonstrated in the coronal plane (b): a hyperintense inner rim (large arrow in b) representing hypervascular granulation tissue and an outer hypointense rim representing sclerotic bone (small arrow in b)
Related posts:
Stay updated, free articles. Join our Telegram channel
Full access? Get Clinical Tree
