, Gustav Andreisek2 and Erika J. Ulbrich2
(1)
Phoenix Diagnostic Clinic, Cluj-Napoca, Romania
(2)
Institute of Diagnostic and Interventional Radiology, University Hospital Zürich, Zürich, Switzerland
11.1 Anatomy and Normal MRI Appearance
The performance of MR imaging regarding the evaluation of bone structures varies from the poorly detailed information regarding the cortical bone to its unique capability of bone marrow assessment. Although some MR sequences (also called “black-bone” MRI) based on a partial flip angle technique or new ultrashort echo (UTE) techniques have been used for providing images of the cortical bone, computed tomography (CT) remains the imaging method of choice for cortical bone evaluation in the clinical routine (Fig. 11.1) [1].
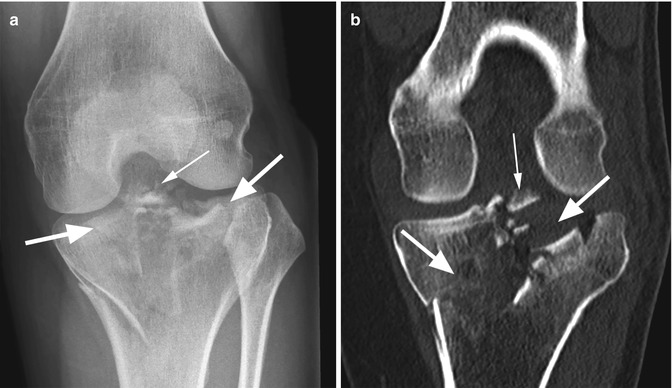
Fig. 11.1
Complex fracture of the tibial plateau (type Schatzker V). Radiography (a) and coronal reconstructed CT image (b) show a complex fracture of the tibial plateau which implies both the medial and lateral tibial plateau (large arrows in a, b). Note the small intra-articular fragments (small arrow in a, b)
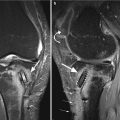
MR imaging is the only practical imaging technique and the most sensitive technique that enables direct visualization of the bone marrow (Fig. 11.2) [2], despite recent developments in CT using dual-energy acquisitions. The bone marrow contains yellow and red marrow with different percentages of fat and water (80 % fat in yellow marrow and 40 % fat in red marrow) [3]. The cellular component is complex and is comprised of stem cells as well as supportive cellular environment [4]. On T1-weighted images, the normal bone marrow displays an intermediate-signal-intensity appearance higher than the skeletal muscles. Decreased signal intensity on T1-weighted images (lower signal intensity than muscles) may be diffuse or focal and is the result of replacement of fatty marrow with cellular tissue or edema (Fig. 11.3) [4]. The fat-suppressed T2-weighted images are particularly useful in increasing the conspicuity of the high-signal-intensity lesions from the adjacent normal bone marrow, which has low signal intensity due to fat suppression. The MRI appearance of the femur, tibia, and patella as well as fabella depends on the bone marrow distribution and the presence of the synchondroses and ossification centers. Knowing the ossification centers and their age of fusion is useful in avoiding misinterpretations of particular fractures or avulsion fractures (Table 11.1).
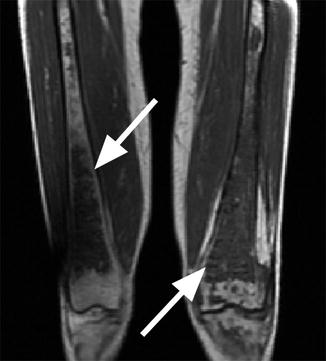
Fig. 11.2
Leukemia in a 27 year old female. Sagittal proton-density (PD) image demonstrates the diffuse abnormality of the bone marrow which is low signal intensity with the exception of the superior part of the patella which has a normal MR imaging appearance (arrow)
Fig. 11.3
Gaucher’s disease. Coronal T1-weighted image shows bilateral femoral low-signal-intensity bone marrow replacement and bone infarction (arrows) indicating severe involvement
11.2 MRI Pathological Findings
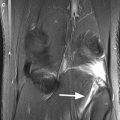
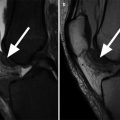
MR imaging is very sensitive in diagnosing the entire spectrum of bone pathology including bone marrow diseases, fractures, and tumors. The role of MR imaging in the evaluation of patients with radiographically recognized traumatic fractures of the distal end of the femur or proximal part of the tibia is, however, equivocal and is limited to the cases in which a complete assessment of the associated soft tissue lesions is necessary (Fig. 11.4). Radiography and CT are the most used imaging methods for diagnosis, classification, and management of bone fractures. On the other hand, MR imaging plays a crucial role and is superior to other imaging techniques in the diagnosis of subtle bone marrow changes (bone marrow edema; bone contusions; occult, pathologic, insufficiency and stress fractures; synchondrosis lesions; avulsion fractures).
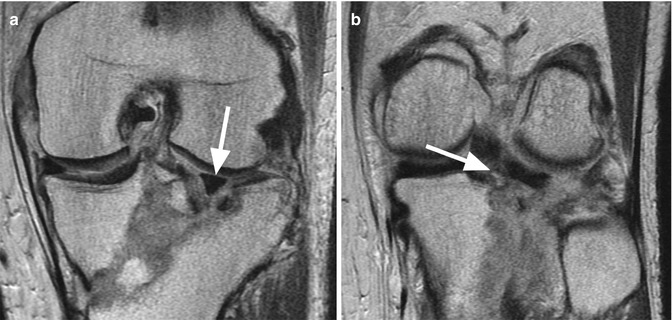
Fig. 11.4
Complex tibial fracture in a 43 year old male. Coronal proton-density (PD) images (a, b) show a completely dislocated lateral meniscus (arrow in a) and bony avulsion of the posterior root of the lateral meniscus (arrow in b)
11.2.1 Transient Bone Marrow Edema
Diffuse bone marrow edema is present in different pathological conditions including osteoporosis, fractures, osteonecrosis, and tumors. The MR imaging appearance is nonspecific in the absence of additional bone changes such as line fractures or cortical defects. Transient bone marrow edema is a syndrome that refers to any patient with reversible bone marrow edema on MR images [7]. The most frequently affected bones are the femoral head and neck and the distal femur where the bone marrow edema involves commonly the medial condyle. Usually, the patients do not remember a traumatic event. The etiology is unclear, but transient osteoporosis, neuromuscular dysfunctions, and transient ischemia are the probable causes for the presence of pain and edema [7]. However, some authors prefer the term of transient bone marrow edema to be used only in patients in whom osteopenia is not demonstrated on radiographs [7]. Clinically, the patients complain of pain, and the MR imaging shows a diffuse high-signal-intensity edema on T2-weighted images without any additional bone pathological changes (Fig. 11.5). A small amount of synovial fluid may be present. The diagnosis is based on the clinical findings, the absence of the previous trauma, the evolution of the pain, and the observation in MR imaging that the edema disappears spontaneously after a while.
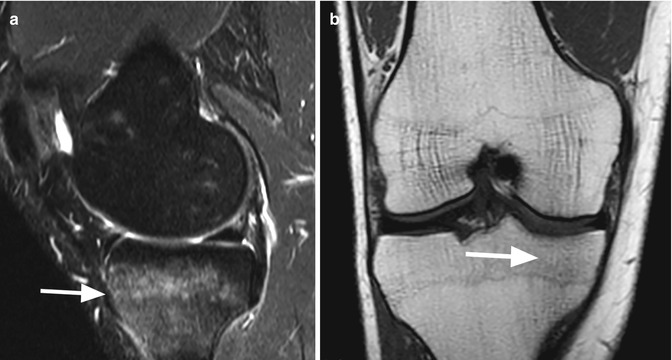
Fig. 11.5
Transient bone marrow edema in a 39 year old male with pain and no history of trauma. Sagittal T2-weighted image (a) and coronal T1-weighted image (b) show a diffuse edema of the lateral tibial plateau without any other pathological changes (arrows)
11.2.2 Disuse Osteopenia and Epiphyseal Growth Arrest Lines
Disuse osteopenia is a diffuse bone marrow change that appears after immobilization probably due to bone resorbtion and compromised architecture [8–10]. The changes are best seen on T2-weighted fat-suppressed images and may have different patterns from a generalized and diffuse high signal intensity relative to the hyaline cartilage lesions to a more “spotty” distribution of the lesions (Fig. 11.6) [8, 11]. The peak of the signal intensity changes is between 10 and 25 weeks after injury with the abnormalities disappearing after 65 weeks [11]. To recognize these changes is clinically important since the original bone strength is decreased during the presence of the bone marrow changes and there is an increased risk of fractures [12]. Although, on radiography, the disuse changes may mimic more aggressive pathologies as bone necrosis, multiple myeloma, or other malignant lesions, on MR imaging, the diagnosis is straightforward especially when correlated with the patient’s history.
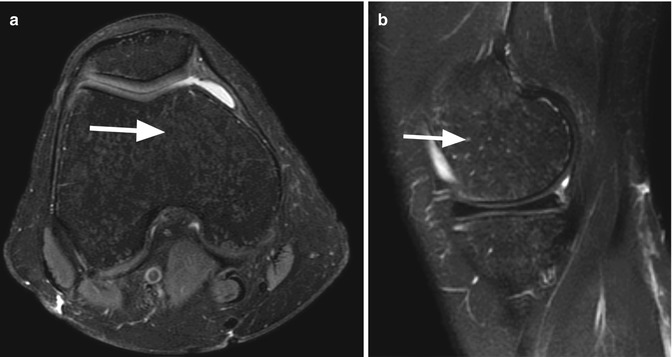
Fig. 11.6
Disuse osteopenia in a 30 year old female after immobilization. Axial proton-density (PD) fat-suppressed image (a) and sagittal T2-weighted fat-suppressed image (b) show small high-signal-intensity lesions of the bone marrow with a “spotty” distribution (arrows)
The epiphyseal growth arrest lines represent low-signal-intensity linear changes of the subchondral bone and long bone metaphyses [13–15] (Fig. 11.7). They may be caused by immobilization during childhood, infection, or malnutrition [13–15]. MR imaging enables a better visualization of this bone-within-bone appearance compared to radiography [15].
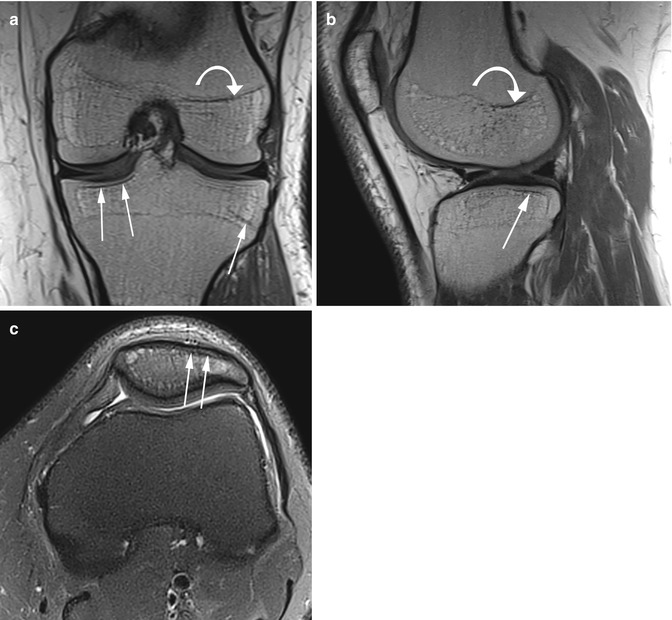
Fig. 11.7
Epiphyseal growth arrest lines in a 31 year old male after immobilization when he was 5 years old. Coronal T1-weighted image (a), sagittal proton-density (PD) image (b), and axial proton-density (PD) fat-suppressed image (c) show low-signal-intensity lines of bone parallel with the subchondral bone of the femur and patella (arrows in a–c). Note also the presence of metaphyseal femoral growth arrest line (curved arrow in a, b)
11.2.3 Avascular Necrosis and Bone Marrow Infarction
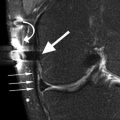
The necrosis that involves the subchondral bone usually is referred to as avascular osteonecrosis, whereas necrosis of metaphyseal regions is referred to as bone infarction [16]. Spontaneous avascular osteonecrosis of the knee (SONK) is the second most common localization for osteonecrosis after the hip and affects mainly the medial condyle of elderly women over 55 years (Fig. 11.8) [17, 18]. Necrosis may be primary or secondary due to a variety of factors such as trauma (e.g., osteochondral fractures), systemic steroid therapy, alcoholism, or after arthroscopy. The secondary form of necrosis affects younger patients and may be bilateral [17]. In the early stage of osteonecrosis, MR imaging may show only presence of diffuse bone marrow edema within the medial condyle. In later stages, MR imaging demonstrates a serpiginous low-signal-intensity line in the medial condyle. The subchondral fragment may have similar signal intensity to the bone marrow or may display a hypointense signal on both T2-weighted and T1-weighted images with bone depression (Fig. 11.8).
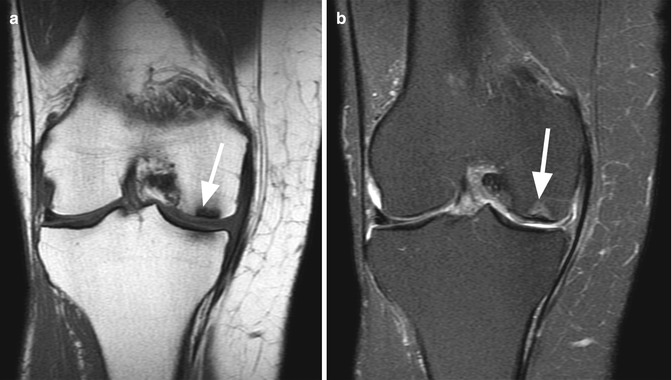
Fig. 11.8
Avascular osteonecrosis of an osteochondral fragment in a 76 year old woman. Coronal T1-weighted image (a) and coronal proton-density (PD) fat-suppressed image (b) show a subchondral fragment of low signal intensity on both sequences with surrounding edema (arrows)
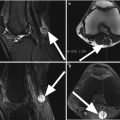
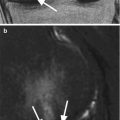
Bone marrow infarction is usually asymptomatic and occurs predominantly in fatty marrow within metaphysis and diaphysis because of poor blood supply in comparison with the hematopoietic marrow which has a higher blood supply. The risk factors for bone infarction are sickle-cell disease, Gaucher’s disease, Hodgkin lymphoma, HIV infection, renal transplantation, myeloproliferative disorders, and chemotherapeutic and corticosteroid therapy (Figs. 11.3 and 11.9) [16, 18–21]. On T2-weighted images, the lesion is heterogeneously hyperintense and usually surrounded by an outer rim of low signal intensity with an inner rim of high signal intensity (“the double-line sign”) (Fig. 11.10) [16]. The outer rim is thought to represent sclerotic bone and the inner rim vascularized granulation tissue [16]. Very rarely, cyst formation in infarcted bones occurs [22].
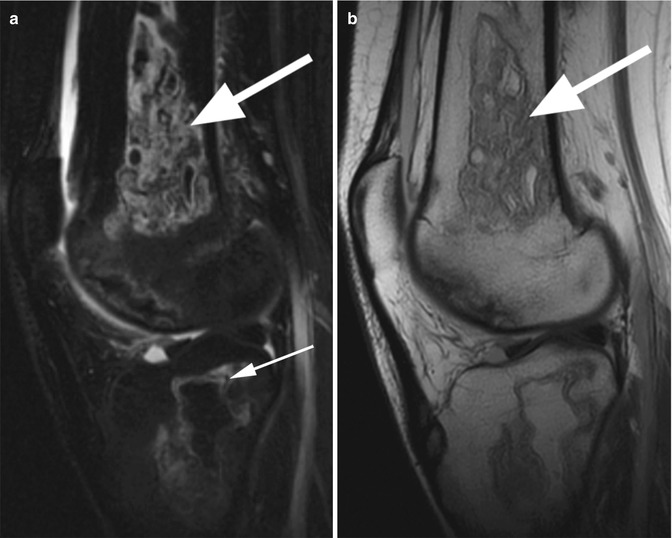
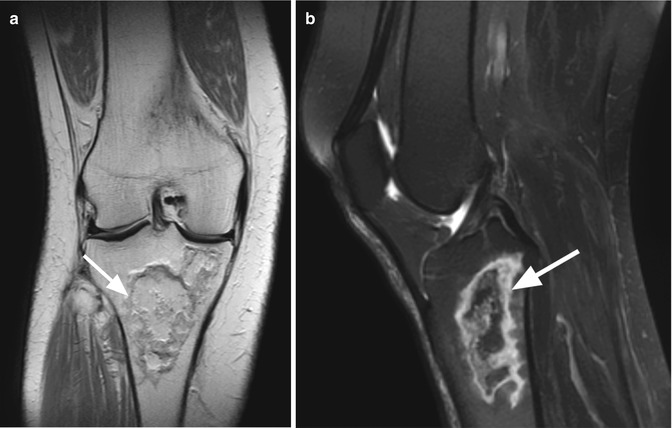
Fig. 11.9
Bone marrow infarction in an 18 year old female with leukemia. Sagittal T2-weighted fat-suppressed image (a) and sagittal proton-density (PD) image (b) show heterogeneous hyperintense bone infarction of the femoral metaphysis (large arrow in a, b) and tibial plateau. Note the “the double-line sign” represented by an outer rim of low signal intensity with an inner rim of high signal intensity (small arrow in a)
Fig. 11.10
Bone marrow infarction in a 65 year old female. Coronal proton-density (PD) image (a) and sagittal T2-weighted fat-suppressed image (b) show an area of bone marrow necrosis of the tibial metaphysis with an outer rim of sclerotic bone (arrows)
11.2.4 Subchondral Bone Contusions (Bone Bruises)
The bone bruises or bone contusions are the result of direct or indirect trauma to the knee and are seen on MR images as subchondral, focal, ill-defined lesions of high signal intensity on T2-weighted images and low signal intensity on T1-weighted images. Usually, the adjacent bone contour is unaffected or may be discretely deepened. Pathologically, in the areas of contusions, edema, trabecular microfractures, and hemorrhage are present. In most of the cases, the bone bruises are secondary signs that accompany more severe lesions of the knee structures. Bone contusions may be single or multiple and are detected in 14–80 % of the patients with knee injuries [23]. The lateral tibial condyle is the most frequently involved area that is diagnosed on MR imaging (Fig. 11.11). When the bone contusions occur on both surfaces of the femoral and tibial articular surfaces, they are known as kissing contusions [24]. There are different injury patterns, and knowing the distribution of the lesions brings important information regarding the mechanism of the knee injury (Table 11.2). Moreover, the location of the bone bruise is an important information and may focus the attention to injuries that could be expected based on specific contusion patterns (Table 11.2). The strongest correlation between bone and ligamentous injuries is the correlation between the anterior cruciate ligament tear and the posterolateral tibial contusion alone or together with lateral femoral contusion (Fig. 11.12) [25].
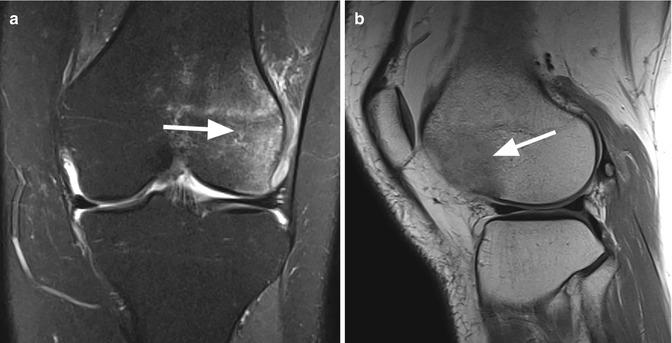
Fig. 11.11
Direct blow injury to the lateral femoral condyle in a 30 year old female. Coronal proton-density (PD) fat-suppressed image (a) and sagittal proton-density (PD) image (b) show a diffuse area of anterolateral femoral bone contusion (arrows)
Contusion pattern | Mechanism of injury | Expected injured structures |
|---|---|---|
Single contusion | ||
Patellar contusion (Fig. 11.13) | Hyperextension injurya | Cartilage contusions |
Direct blow to the patella | Cartilage fracture | |
Patellar dislocationb | Medial patellar retinaculum | |
Lateral tibial condyle | ||
Posterior | Pivot shift injuryc | Anterior cruciate ligament |
Clip injuryd | Lateral collateral ligament | |
Posterior cruciate ligament | ||
Lateral meniscus | ||
Central | Pivot injuryc | Posterior cruciate ligament |
Dashboard injurye | ||
Anterior | Dashboard injurye | Posterior cruciate ligament |
Medial tibial condyle (Fig. 11.14) | ||
Posterior | Pivot shift injuryc | Posterior cruciate ligament |
Clip injuryd | Lateral meniscus | |
Central | Clip injuryd | Lateral collateral ligament |
Anterior | Dashboard injurye | Lateral collateral ligament |
Lateral femoral condyle (Fig. 11.11) | ||
Posterior | Pivot injuryc | Posterior cruciate ligament |
Lateral patellar dislocationb | Medial retinaculum | |
Central | Pivot injuryc | Lateral collateral ligament |
Dashboard injurye | Medial retinaculum | |
Anterior | Lateral patellar dislocationb | Medial retinaculum |
Medial femoral condyle | ||
Posterior | Dashboard injurye | Rarely medial retinaculum |
Central | Dashboard injurye | Rarely medial retinaculum |
Hyperextensiona | ||
Anterior | Hyperextensiona | Lateral collateral ligament |
Kissing contusions | ||
Lateral femoral condyle and lateral tibial condyle (Fig. 11.12) | Pivot shift injuryc | Anterior cruciate ligament |
Medial collateral ligament | ||
Meniscal tears | ||
Anterior femoral condyle and anterior tibial condyle | Hyperextension injurya | Anterior cruciate ligament |
Posterior cruciate ligament | ||
Meniscal injury
Related posts:Stay updated, free articles. Join our Telegram channel
Full access? Get Clinical Tree
 Get Clinical Tree app for offline access

| ||