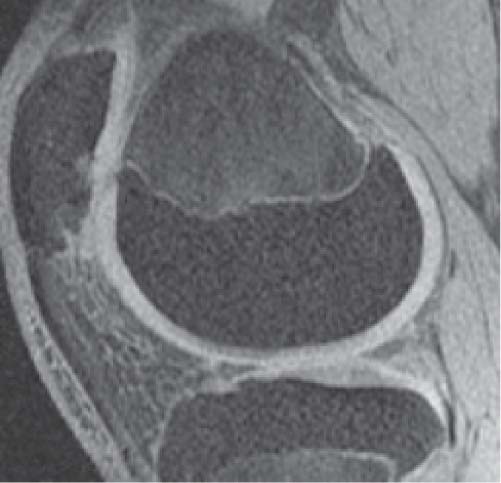
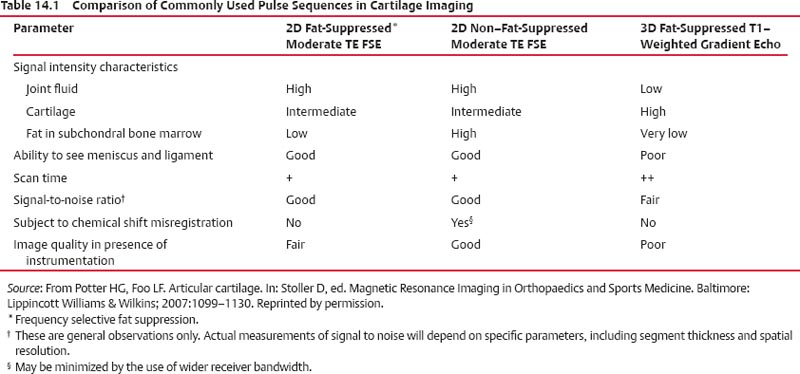
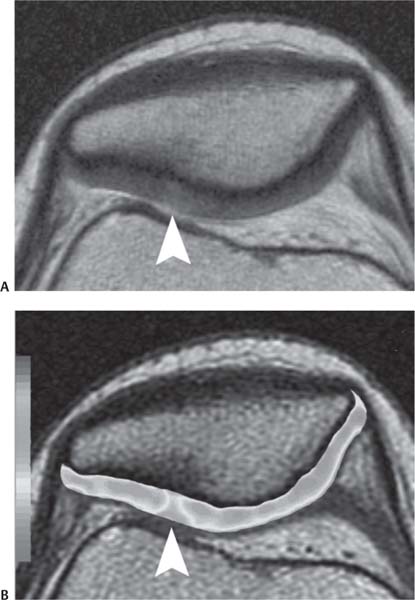
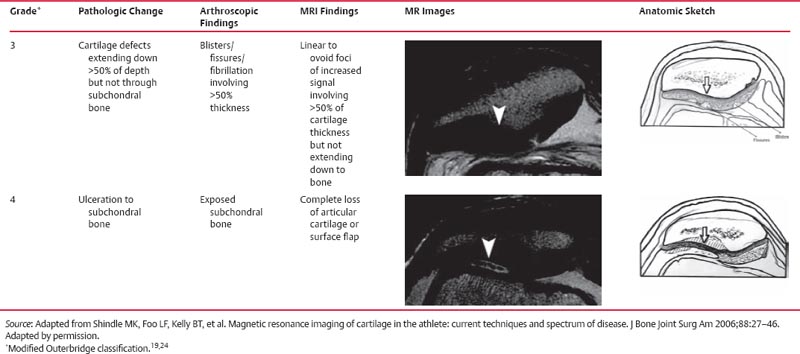
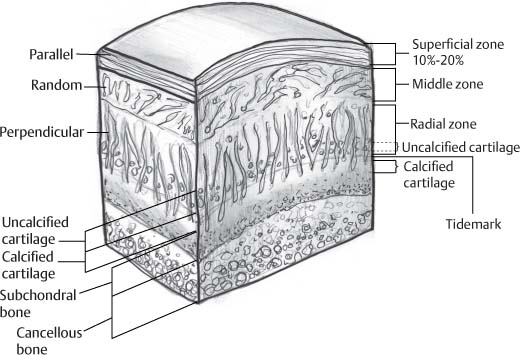
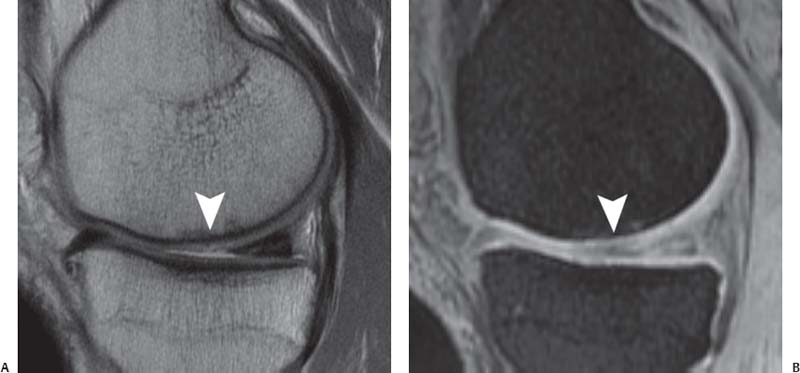
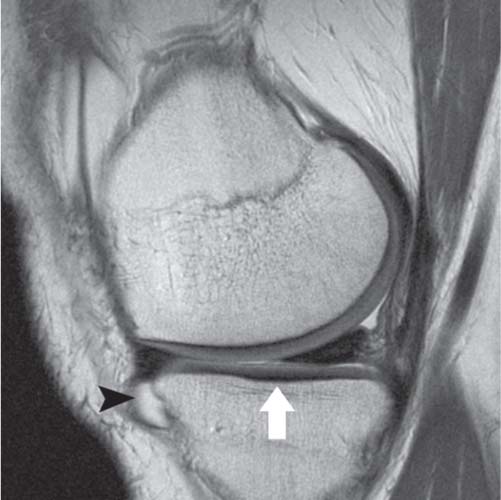
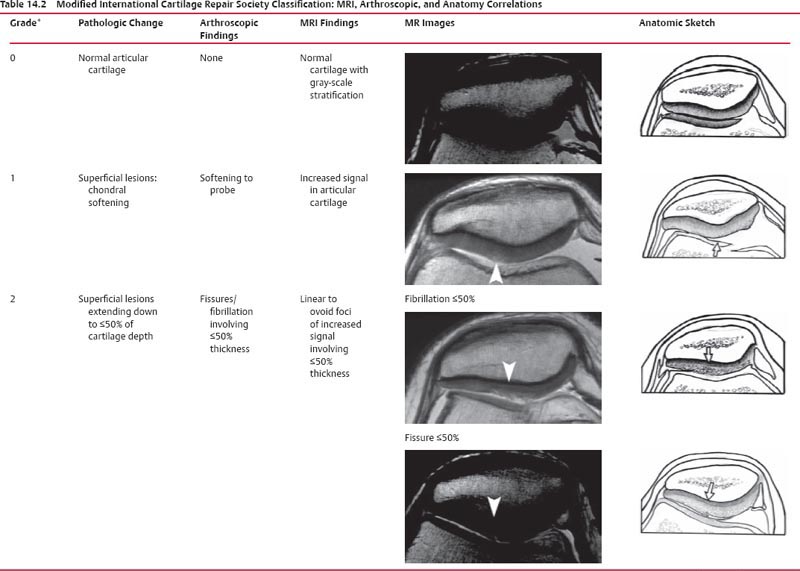
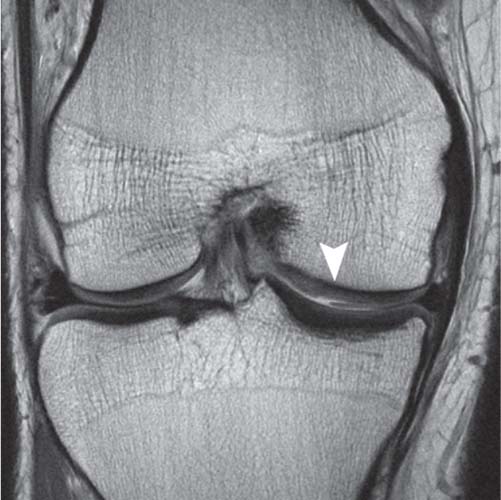
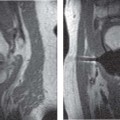
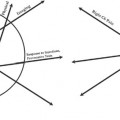
14 Articular Cartilage There have been considerable advances in the MRI of articular cartilage in recent years. Cartilage-sensitive pulse sequences should be included as a part of all joint-imaging protocols to provide a reproducible, noninvasive means of monitoring disease progression in inflammatory and degenerative arthritides, detecting traumatic cartilage injury, and evaluating surgically manipulated cartilage. Cartilage repair techniques such as autologous chondrocyte implantation, microfracture, and osteochondral autografting are being performed with increased frequency, and MRI offers a noninvasive method for evaluating the results of these procedures. To differentiate the MR appearance of normal and abnormal cartilage morphology, it is important to understand the structure of articular cartilage, which is the basis for the development of new imaging techniques. Articular cartilage, a metabolically active tissue, has viscoelastic properties and is composed of chondrocytes (approximately 1%) and an extracellular matrix that consists mainly of water (65% to 80%), proteoglycan, and collagen.1 Type II collagen is the most common type (95%), but other types have been identified (IV, VI, IX, X, and XI).1 Collagen provides the tensile strength of articular cartilage. The proteoglycans consist mainly of chondroitin and keratin sulfates, which provide compressive strength to the cartilage. Articular cartilage ranges in thickness from 2 to 5 mm, depending on the contact pressures that occur across a joint. Because of high peak pressures, the patellofemoral joint has the thickest articular cartilage in the body. Articular cartilage can be divided structurally and functionally into four zones (Fig. 14.1): • Superficial • Transitional or middle • Deep or radial • Calcified The superficial zone accounts for 10% to 20% of the total thickness of cartilage, has the highest collagen content of all of the zones, and has highly organized collagen fibers that are oriented parallel to the articular surface.2 This zone resists shear stress and has a low proteoglycan content. At clinically relevant field strengths, this zone is typically not distinguishable from the transitional zone. The middle or transitional zone accounts for 40% to 60% of the cartilage thickness, has collagen fibers that are randomly oriented, and has a higher compressive modulus than the superficial zone because the inhomogeneity of fiber orientation distributes the stress more uniformly across the loaded tissue.3 The deep or radial zone accounts for 30% of cartilage thickness and has highly organized collagen fibers that are oriented perpendicular to the cartilage surface. This zone also has the lowest water content and highest proteoglycan content. The collagen fibers have a radial orientation that crosses the tidemark, the interface between the articular cartilage and the calcified cartilage beneath it, which anchors the cartilage to the underlying bone.4 The calcified cartilage layer is the final zone. This zone is separated from the radial zone by the tidemark, which also represents a potential shear plane for articular cartilage defects.5 At clinically relevant field strengths, the tidemark cannot be differentiated from the subchondral plate. The water, proteoglycan, and collagen content all account for the MR signal characteristics. However, the bulk of the signal comes from the free water present and not from the water that is electrostatically bound to proteoglycan or from the water that is associated with collagen. Depending on the pulse sequence used, cartilage will have a bilaminar or trilaminar appearance secondary to the highly ordered structure of the collagen of the deeper radial zone, which yields a shorter T2 relaxation time and corresponding lower signal intensity. Understanding the normal signal characteristics and anatomy of articular cartilage is imperative for detecting abnormal cartilage morphology. Although MRI provides soft-tissue contrast that is superior to that of traditional imaging techniques, standardized conventional radiographs are also a valuable part of cartilage assessment. In particular, when planning for cartilage repair, standing hip-to-ankle films are important for preoperative planning to determine the following: Fig. 14.1 Artist’s depiction of cartilage zonal histology. • The mechanical axis of the limb, so that any preexisting deformity that may limit the clinical success of cartilage repair can be identified • Whether concomitant procedures (such as a high tibial osteotomy) should be performed The orthopedic surgeon should be aware that different pulse sequences are available for the evaluation of articular cartilage and should be included as a part of all joint-imaging protocols. Some institutions prefer using a T1-weighted 3D fat-suppressed gradient-echo sequence because it shows high contrast between the low signal intensity of the fat-suppressed bone and the high signal intensity of articular cartilage (Fig. 14.2). However, this sequence has several drawbacks: it requires a relatively long scan time, it is not suitable for meniscal or ligamentous evaluation, it is less sensitive to partial-thickness cartilage defects, and it undergoes image signal degradation in the presence of metal.6–8 For these reasons, the authors’ institution prefers an intermediate TE, 2D non–fat-suppressed FSE sequence that provides good differential contrast between the intermediate signal intensity of articular cartilage, the high signal intensity of synovial fluid, and the low signal intensity of fibrocartilage6,8 (Fig. 14.3). With proper technique, this sequence offers several advantages, including the following (Table 14.1): • It has a relatively short scan time. • It is effective in the presence of instrumentation. • It can detect partial-thickness chondral lesions. • It has very good differential contrast between the underlying bone, cartilage, ligaments, joint fluid, and menisci. This pulse sequence shows cartilage as a laminar gray scale appearance that corresponds to the different orientations of collagen within the cartilage zones: a relatively hypointense radial zone and a higher signal intensity transitional zone6 (Fig. 14.4). Contrast agents, either intraarticular or intravenous, have been advocated by some authors for the evaluation of articular cartilage.9–12 However, the use of such agents converts MRI into an invasive procedure and may be associated with longer imaging time and increased costs. As mentioned above, the bulk of the MR signal derives from the free-water content of the cartilage. Novel approaches have been developed to supplement traditional MRI techniques by targeting additional “bound” components of the extracellular matrix, specifically collagen or proteoglycan. For example, with osteoarthritis and after traumatic cartilage injuries, there is a loss of negatively charged glycosaminoglycan, and MRI techniques such as positively charged sodium (23Na) MRI,13 T1 ρ, or delayed gadolinium-enhanced MRI of cartilage have been developed to detect these changes.13–17 T2 mapping is an imaging technique that can be used to reflect the collagen component of the extracellular matrix. T2 relaxation time is a function of the free-water content of the tissue, and therefore it varies depending on the zone of articular cartilage.18 For example, in the middle zone, collagen orientation is relatively random and water is more mobile, corresponding to longer T2 values. In contrast, the deep zone has highly ordered collagen, and therefore T2 values are short because water is relatively immobilized (Fig. 14.5). Clinically, T2 mapping is important because of its ability to detect changes in cartilage structure before the substantial loss of cartilage thickness or the development of gross signal alterations in the cartilage gray scale. This early detection can help surgical decision-making by potentially optimizing the timing of operative procedures, such as meniscal transplantation or patellofemoral realignment. Fig. 14.2 A sagittal 3D fat-suppressed T1-weighted gradient-echo image of the knee, showing high contrast between hyperintense articular cartilage and hypointense bone. (From Shindle MK, Foo LF, Kelly BT, et al. Magnetic resonance imaging of cartilage in the athlete: current techniques and spectrum of disease. J Bone Joint Surg Am 2006;88:27–46. Reprinted by permission.) Fig. 14.3 Knee images. (A) A sagittal FSE sequence shows a focal partial-thickness cartilage defect overlying the medial femoral condyle (arrowhead). (B) A sagittal fat-suppressed T1–weighted gradient-echo sequence, in which the lesion is not as well appreciated. Obtaining this image took twice as long as the FSE image. (From Potter HG, Foo LF. Magnetic resonance imaging of articular cartilage: trauma, degeneration, and repair. Am J Sports Med 2006;34:661–677. Reprinted by permission.) Fig. 14.4 Sagittal FSE image of the knee in a 50-year-old patient that shows gray-scale stratification of the tibial plateau articular cartilage (arrow). Note the differential contrast for the high signal intensity joint fluid within the meniscosynovial recess (arrowhead), the intermediate signal intensity of hyaline cartilage, and the low signal intensity of meniscal fibrocartilage. (From Potter HG, Foo LF. Articular cartilage. In: Stoller D, ed. Magnetic Resonance Imaging in Orthopaedics and Sports Medicine. Baltimore: Lippincott Williams & Wilkins; 2007:1099–1130. Reprinted by permission.) Many scoring systems can be used to classify articular cartilage lesions.19–22 The most common is the Outerbridge system, which is an arthroscopic system that divides lesions into five grades22: • Grade 0: normal cartilage • Grade I: cartilage with softening and swelling • Grade II: a partial-thickness defect with fissures on the surface that do not reach subchondral bone or that are <1.5 cm in diameter • Grade III: fissuring to the level of subchondral bone in an area with a diameter of more than 1.5 cm • Grade IV: exposed subchondral bone This classification system was originally used to classify chondromalacia patellae but has been extrapolated to classify chondral lesions throughout the body with moderate accuracy.23 However, the limitation of this system is that it does not include a description of lesion depth for grade II or grade III lesions. The International Cartilage Repair Society has a validated standardization system for the evaluation of cartilage injury and repair, and it may be applied to MRI (Table 14.2).19,24 MRI after injury allows for noninvasive evaluation of cartilage and can detect clinically relevant lesions such as a cartilage shear injury or a displaced cartilage flap, which can mimic other injuries such as a displaced meniscal tear25 (Fig. 14.6). In the knee, articular cartilage injuries have been associated with poor clinical outcomes.26–28 Thus, MRI before surgical intervention can aid in diagnosis, help predict prognosis, and identify patients who may benefit from cartilage repair techniques.27 Fig. 14.5 Images of the knee in an avid marathon runner with anterior knee pain. (A) An axial FSE image shows focal increased signal (arrowhead) affecting normal-thickness cartilage in the lateral patella facet with subchondral sclerosis. (B) A corresponding quantitative T2 relaxation time map shows geographic loss of stratification and prolongation in T2 values (arrowhead) throughout the thickness of the cartilage at this site. (From Potter HG, Foo LF. Articular cartilage. In: Stoller D, ed. Magnetic Resonance Imaging in Orthopaedics and Sports Medicine. Baltimore: Lippincott Williams & Wilkins; 2007:1099–1130. Reprinted by permission.) Fig. 14.6 A coronal cartilage-sensitive image of the knee in a 31-year-old man with a clinically suspected meniscal tear shows a focal chondral flap (arrowhead) over the right medial femoral condyle. (From Potter HG, Foo LF. Magnetic resonance imaging of articular cartilage: trauma, degeneration, and repair. Am J Sports Med 2006;34:661–677. Reprinted by permission.) Chondral delamination can occur when shear stresses cause separation of the articular cartilage from the underlying subchondral bone at the tidemark29,30 (Fig. 14.7
 Overview of Articular Cartilage
 Specialized Pulse Sequences and Imaging Protocols
 Classification
 Clinical Cartilage Imaging
Knee
![]()
Stay updated, free articles. Join our Telegram channel

Full access? Get Clinical Tree


