Outline
An Unfortunate but Common Pitfall, 1093
Technical Considerations, 1095
Mirror Image Artifact, 1095
Pelvis, Gravid and Nongravid Uterus, 1098
The First Trimester, 1114
The Fetal Head and Neck, 1122
The Fetal Thorax, 1132
The Fetal Abdomen, 1135
Amniotic Fluid and Membranes, 1143
The Fetal Skeleton, 1146
Multiple Gestations, 1151
When I began my involvement with diagnostic sonography nearly 4 decades ago, this chapter would have been considered ludicrous. Virtually all of sonography was considered to be either an artifact or a pitfall. Clinicians did not take this modality seriously, and few critical decisions were ever based on the results of the ultrasound examination alone. With time, improvements in both technology and our understanding of normal and abnormal findings made this a useful clinical diagnostic modality. It did not take long for important clinical decisions to be based solely on the results of the ultrasound examination, including surgery, early delivery of the fetus, or even termination of the pregnancy. This evolution, although welcomed by many, has placed a large responsibility on the sonologist. The phrase “primum non nocere”—first do no harm—has never been more true.
This chapter is not an attempt to explain the physical principles of sonography or artifact production. It is also unlikely that such a chapter could ever be all-inclusive. I have attempted to find examples of pitfalls, the diagnostic dilemmas that have the potential to lead us to the wrong diagnosis. I have tried to cover both basic potential pitfalls and some of the more esoteric normal variants. Undoubtedly, some readers will find examples here that are so basic as to seem almost insulting. I apologize in advance and will only respond that this chapter is meant to appeal to a wide audience that includes beginners and seasoned experts. I also do not attempt to give an overly detailed explanation for each example but try to offer what is theorized currently.
If I am able to avoid one false positive diagnosis and prevent unnecessary surgery, termination of a pregnancy, or even 20 weeks of an emotional roller coaster for expectant parents, I have fulfilled my goal.
An Unfortunate But Common Pitfall
I begin this chapter as the subheading suggests, with a common but unfortunate pitfall.
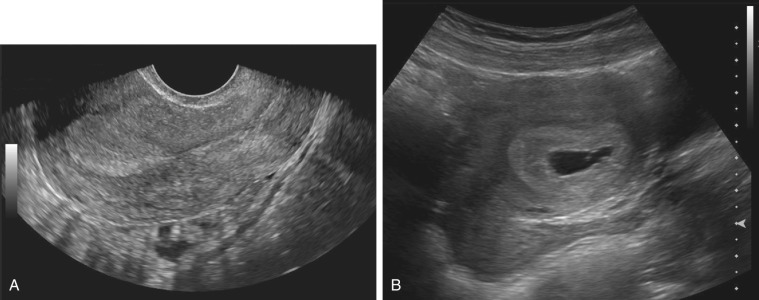
A 34-year-old woman presented to the emergency department complaining of mild pelvic pain with a known history of positive pregnancy test. A quantitative serum β-hCG (human chorionic gonadotropin) revealed a value of 3870 mIU/mL. (This value is nearly double most centers’ “discriminatory zone.”) A diagnostic ultrasound examination revealed no evidence of an intrauterine pregnancy (IUP) or adnexal masses. As a result, the patient was presumed to have an ectopic pregnancy (EP) and was treated with intramuscular methotrexate. A repeat sonogram obtained ![]() weeks later revealed a living IUP. The patient elected to terminate the pregnancy.
weeks later revealed a living IUP. The patient elected to terminate the pregnancy.
- 1.
In the early 1980s, Kadar and others attempted to determine the maternal serum hCG level above which a gestational sac should be consistently seen during sonograms in a patient with a normal IUP. The value was termed the “discriminatory zone.” It should be noted that the values initially reported were significantly higher prior to the advent of transvaginal sonography in use today. Although this upper limit value today is variable at differing institutions, it tends to be between 1500 and 2000 mIU/mL (first IUP).
- 2.
With the advent of high-resolution transvaginal sonography, early pregnancies can now often be identified within the uterus when gestational sacs are as small as 2 to 3 mm.
A noninvasive method of treating EPs with methotrexate became available in the early 1980s. As a result, some clinicians, then and now, treat the patient with methotrexate when both an “empty uterus” at the time of sonography and an elevated β-hCG level (above the discriminatory zone) are present, in an attempt to treat the EP. Unfortunately, some of these patients subsequently have been found to have IUPs, not EPs, on follow-up. It is quite clear that even marked elevations of β-hCG above the discriminatory zone are not always reliable in excluding an intrauterine pregnancy when a gestational sac is not seen at sonography. In these cases, follow-up, rather than immediate treatment, is indicated. Likewise, even in the best of hands and with excellent ultrasound equipment, at 4 to 5 weeks’ gestation an IUP may not be identified sonographically, though the patient may in fact have an IUP. The report should ideally read “An ectopic pregnancy, or a pregnancy too early to be seen within the uterus, cannot be excluded.”
In October 2012, the Society of Radiologists in Ultrasound convened a multispecialty consensus conference to establish criteria on early first trimester diagnosis of miscarriage and exclusion of a viable IUP when seen in the uterus, as well as to discuss diagnosing and ruling out a viable IUP in a woman with a pregnancy of unknown location. These criteria and an editorial discussion were published in the New England Journal of Medicine ( ; ). The takeaway points from this panel regarding this pitfall were as follows:
- •
A single hCG assessment, regardless of level, does not reliably determine a pregnancy’s location or viability (this is because hCG levels in women with nonviable IUPs, viable IUPs, and EP overlap substantially).
- •
A single hCG level less than 3000 mIU/mL should not elicit treatment for presumed EP because there is a substantial risk that administering methotrexate will damage a normal IUP.
- •
A single hCG level 3000 mIU/mL or higher in the absence of a sonographically visualized IUP indicates that a viable IUP is possible but unlikely. The most likely diagnosis is failed IUP, so if methotrexate is administered, it is more likely being given unnecessarily to a woman with a failed IUP than to one with an EP. At least one additional hCG level should be measured before initiating treatment for EP.
Technical Considerations
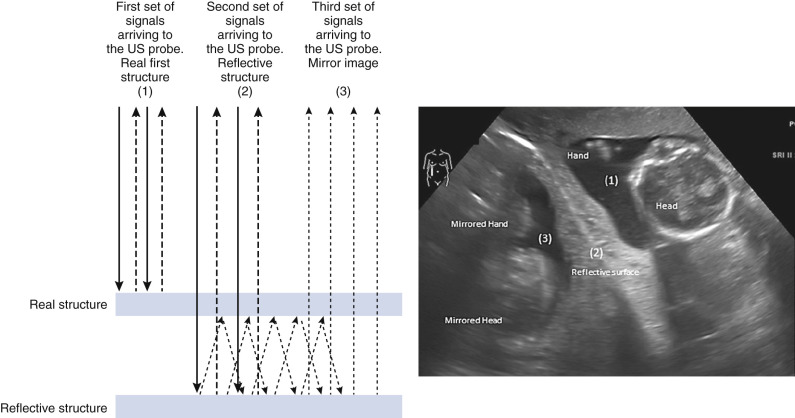
Mirror Image Artifact
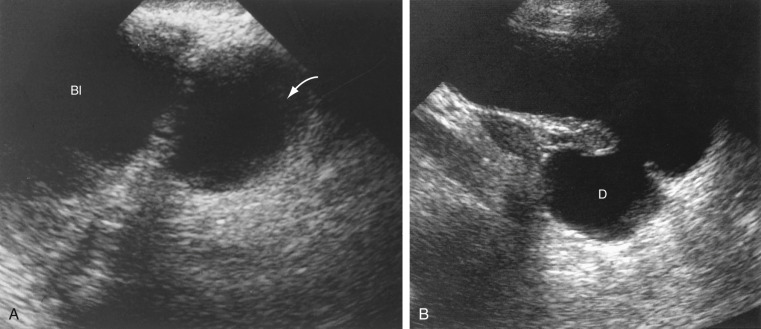
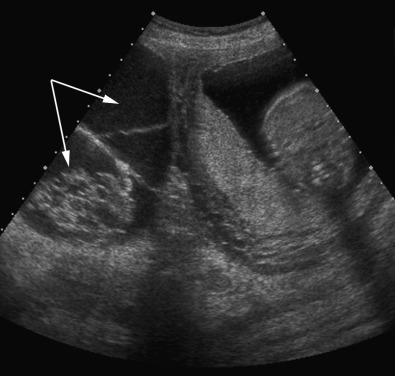
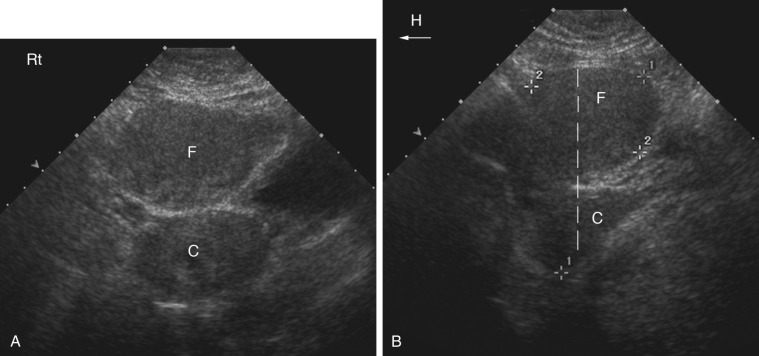
A mirror image artifact is created when the ultrasound beam is reflected from a strong reflector that is often obliquely oriented and redirects the echoes off a secondary reflector back to the transducer. The ultrasound computer assumes the sound traveled in a straight line. The mirrored image results in the copy appearing on the same image, though deeper because of the additional time for the mirrored image to return to the transducer. In conventional gray-scale imaging, as well as color Doppler imaging, the mirrored artifact will always be the deeper structure.
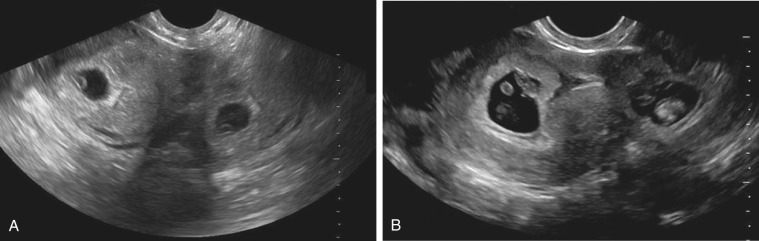
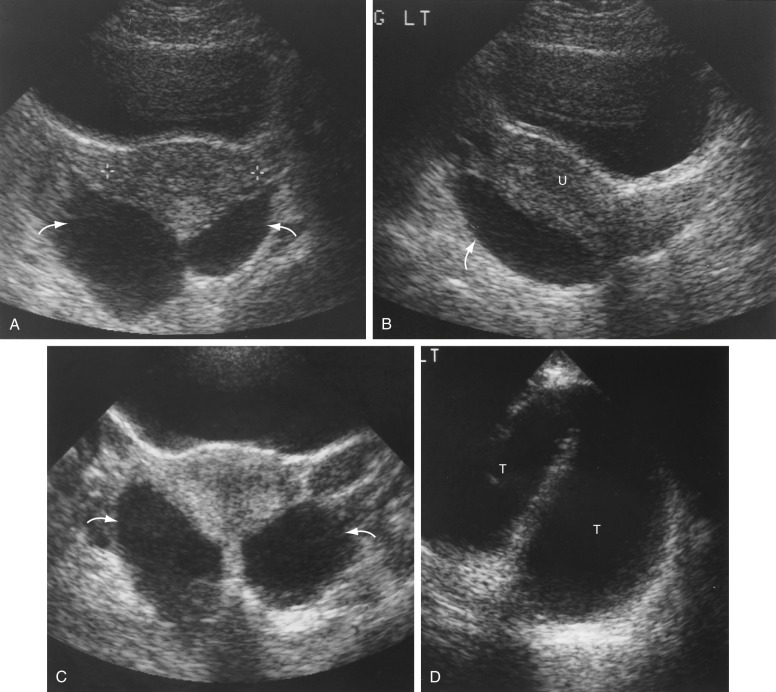
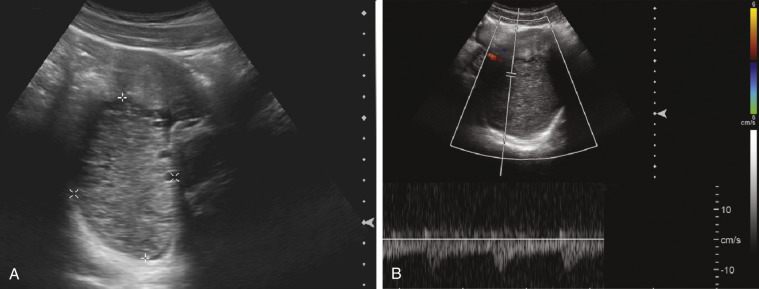
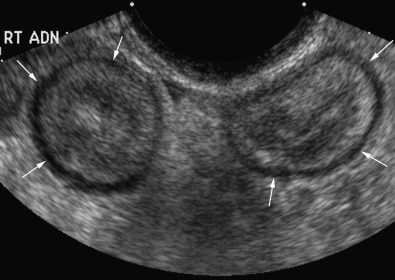
Pelvis, Gravid and Nongravid Uterus

Related posts:
 Ultrasound Evaluation of the Fetal Central Nervous System
 Obstetric Ultrasound Imaging and the Obese Patient
 Evaluation of Hydrops Fetalis
 Fetal Cardiac Measurements and Doppler Assessment
 Ultrasound and Magnetic Resonance Imaging in Urogynecology
 Gynecologic Sonography in the Pediatric and Adolescent Patient
Stay updated, free articles. Join our Telegram channel

Full access? Get Clinical Tree


