DOTATATE
DOTANOC
DOTATOC
Therapy cycles
185
9
59
83 male, 102 female
3 male, 6 female
35 male, 24 female
59.7 ± 10.6 years
64.4 ± 9.9 years
62.3 ± 10.0 years
27.5–79.7 years
47.9–77.5 years
41.2–81.7 years
Activity per cycle in GBq
5.7 ± 1.1
5.6 ± 1.5
7.3 ± 0.8
2.5–8.5
3.6–7.4
5.5–8.6
Table 2
Patients treated with DOTATATE and DOTATOC (group 2)
DOTATATE | DOTATOC | |
|---|---|---|
25 patients; 13 male, 12 female | 60.2 ± 9.1 years | 61.7 ± 9.1 years |
45.3–75.2 years | 45.6–75.5 | |
Activity per cycle (GBq) | 6.5 ± 1.1 | 7.3 ± 0.7 |
5.0–9.5 | 5.5–8.5 |
2.2 Radiopharmaceuticals
The radiopharmaceuticals were prepared in our GMP-certified radiopharmacy. 177Lu-labeling of DOTA peptides was performed according to the following procedure: A solution of 500 μg 2,5-dihydroxybenzoic acid and 20 μg of the corresponding DOTA peptide in 50 μL 0.4 M sodium acetate buffer (pH 5.5) was added to a solution of 1 GBq 177Lu in 30 μL 0.05 M HCl. The mixture was heated to 90°C for 30 min and then diluted with 0.9% saline solution followed by sterile filtration. Quality control was performed by RP-18 HPLC [solvent A: water; solvent B: acetonitrile (both with 0.1% TFA); gradient: 0–2 min 95% A, 20 min 95% B; flow rate: 1.2 mL/min; column: LiChrospher 100 RP 18 EC-5 μm 250 × 4 mm]. The radiochemical purity was always greater than 99%. Samples were taken for sterility and pyrogenicity testing.
2.3 Infusion and Renal Protection
For kidney protection, every patient was infused with 1500 mL of a renoprotective amino acid mixture of 5% lysine HCl and 10% l-arginine HCl. Infusion was started 30 min prior to administration of the therapeutic dose and continued for 4 h thereafter. This co-infusion of amino acids reduces renal exposure significantly (Jamar et al. 2003). The radiopharmaceutical was co-administered over 10–15 min by using a second infusion pump system. The activity to administer was individually chosen based on the uptake in the tumor lesions as shown by Ga-68 SSTR PET/CT (performed before each treatment cycle), kidney function (tubular extraction rate determined by Tc-99m MAG3 scintigraphy and glomerular filtration by Tc-99m DTPA clearance, and serum creatinine), hematological reserve, previous treatments, general status of the patient (Karnofsky Performance Scale), and experience reported by other groups (Kwekkeboom et al. 2005a).
2.4 Dosimetry
In this study, the dosimetric approach is based on the MIRD scheme, where the absorbed dose depends on two main parameters:
1.
Time-independent physical factors: so-called S-values, which were tabulated by the MIRD committee and include type, size of emitted energies, and geometric aspects (size, type, and structure of source and target regions);
2.
Time-dependent biokinetic factors: these describe the cumulated activity, uptake, and retention in the regions of interest, and include the physical half-life of the radionuclide and the biologic half-life of the radiopharmaceutical (expressed as residence time, which also depends on the half-life of the radionuclide and its distribution) (Siegel et al. 1999).
The dose estimation requires an accurate determination of the time-dependent activity of the source regions. Thus, the main objective of the dosimetry is correct evaluation of the distribution and kinetics of the administered radiopharmaceutical (Sgouros 2005; Stabin and Siegel 2003). For the dose estimations, we developed a convenient procedure which is based on the MIRD scheme and practicable in daily clinical routine (Wehrmann et al. 2007). In short, the kinetics of the radiopharmaceutical is determined on the basis of five planar whole-body scintigraphies in defined time order after administration of the radiopeptide (p.i.). After the first scan acquired immediately after infusion, further scans are obtained at 3, 20, 44, and 68 h p.i. The camera parameters were the following: MEDISO spirit DH-V dual-headed gamma camera, MeGP collimator, 15% energy window, peak at 208 keV, speed 15 cm/min. Scintigraphies were analyzed by the use of regions of interest (ROI). After geometric mean and background correction, time-dependent time–activity curves were obtained and fitted to mono- or biexponential functions (software ORIGIN PRO 8.1G). The residence time and cumulated activity as well as the uptake and effective half-life were then calculated, and the mean absorbed doses were estimated by using the OLINDA/EXM software (Stabin et al. 2005).
Finally, uptake values were calculated as fraction of administered activity (%IA), and effective half-lives, residence times, and mean absorbed organ and tumor doses were obtained for whole body, normal tissues, kidneys, spleen, and tumor lesions of all patients in the different groups. The ROIs for normal tissue and background were placed over those regions showing no tumor involvement. For interpatient comparison, they were scaled to 10% of the whole-body ROI. Estimation of mean absorbed tumor dose requires the lesions’ volume. These were obtained from the CT data of the pretherapy 68Ga-DOTA-SSTR PET/CT. Volumes of normal organs were assumed to have standard size as given by OLINDA/EXM.
Organs showing tumor involvement or overlaying with other source regions were not included for dosimetric analysis. For this reason, normal liver was excluded from the analysis in this study because nearly all patients had extensive liver metastases. Some patients had liver lesions superimposing on the right kidney, allowing only analysis of the left kidney. In these cases, it was assumed that the mean absorbed dose would be identical for both kidneys (which was also checked and confirmed by prior Tc-99m MAG3 scintigraphy proving that there was no significant difference in the differential renal function). Also, kinetics and mean absorbed dose of the spleen could not be estimated for all patients as several patients had undergone splenectomy.
2.5 Comparison and Statistics
Dosimetric parameters were determined for whole body, kidneys, spleen, and normal tissues/organs as well as for tumor lesions. Results are expressed as median values. To describe differences between the various radiolabeled peptides, the following parameters were chosen: uptake at 20 h p.i. (max. uptake for tumor lesions), half-life, residence time, and mean absorbed dose. Interpatient variability was estimated by comparing the three peptides in all patients. To describe significant differences among the peptides, nonparametric tests for independent samples were used. In group 2, statistically significant differences were evaluated by nonparametric signed-rank tests for paired samples. All statistical tests were performed using ORIGINPRO 8.1 G; p-values ≤0.05 were considered to be significant.
3 Results
3.1 Normal Organs
Dosimetry results are given in Table 3; corresponding uptake and time–activity curves are shown in Fig. 1.
Table 3
Dosimetric results of 253 patients in group 1 (median and range of variation); for kidneys, spleen, and tumor lesions only the second half-life was calculated because of the fit to a monoexponential function
DOTA- | Whole body | Normal tissue | Kidneys | Spleen | Tumor lesions | |
|---|---|---|---|---|---|---|
Uptake 20 h p.i. | TATE | 27.7 (14.1–58.7) | 1.8 (0.9–5.1) | 2.4 (0.9–6.7) | 1.7 (0.4–14.3) | 0.05 (0.001–0.8) |
NOC | 38.5 (22.6–70.1) | 2.7 (1.9–5.3) | 3.2 (2.2–3.6) | 1.6 (1.0–4.8) | 0.02 (0.004–0.3) | |
TOC | 19.5 (10.2–52.2) | 1.4 (0.7–3.6) | 1.6 (0.7–3.3) | 1.0 (0.3–4.6) | 0.04 (0.001–0.4) | |
First half-life (h) | TATE | 2.2 (0.9–6.8) | 2.2 (1.0–8.4) | – | – | – |
NOC | 3.0 (0.8–4.2) | 2.6 (1.6–3.9) | – | – | – | |
TOC | 2.7 (1.4–5.9) | 2.8 (1.7–8.6) | – | – | – | |
Second half-life (h) | TATE | 55.3 (33.1–94.5) | 46.6 (32.4–160.3) | 62.7 (36.0–160.3) | 67.5 (42.9–160.3) | 73.2 (31.1–160.3) |
NOC | 57.3 (40.2–69.1) | 43.4 (36.4–47.7) | 70.3 (49.7–94.1) | 79.3 (69.4–101.6) | 61.2 (40.5–139.8) | |
TOC | 51.1 (30.3–82.4) | 43.1 (20.1–160.3) | 63.4 (37.7–142.0) | 72.5 (45.8–160.3) | 79.0 (31.1–160.3) | |
Residence time (h) | TATE | 32.2 (17.7–78.6) | 2.2 (1.1–7.8) | 2.7 (1.0–8.3) | 2.1 (0.5–16.1) | 0.7 (0.02–54.7) |
NOC | 50.0 (22.8–73.0) | 2.9 (2.0–5.5) | 3.8 (2.0–4.6) | 2.3 (1.1–7.1) | 0.8 (0.01–34.0) | |
TOC | 23.3 (14.6–66.2) | 1.8 (1.2–4.4) | 1.9 (0.9–5.0) | 1.3 (0.3–5.9) | 0.4 (0.03–36.8) | |
Absorbed dose (mGy/MBq) | TATE | 0.05 (0.02–0.1) | – | 0.8 (0.3–2.6) | 1.1 (0.2–9.3) | 5.2 (0.1–89.6) |
NOC | 0.07 (0.04–0.1) | – | 1.1 (0.6–1.5) | 1.3 (0.7–3.4) | 2.0 (0.5–31.7) | |
TOC | 0.03 (0.02–0.08) | – | 0.6 (0.3–1.6) | 0.7 (0.2–2.8) | 4.9 (0.3–39.7) |
Fig. 1
Kinetics of normal organs and whole body in patients treated with different peptides (group 1)
3.1.1 Whole Body
Because the total whole-body counts from the first scan represent the total administered activity, whole-body kinetics start with an initial uptake of 100% for all three peptides. Initially, the curves show a rapid decline followed by a second, slower decline. Therefore, time–activity curves for whole body were fitted by a biexponential function. The highest initial whole-body (WB) uptake was observed for DOTANOC and the lowest for DOTATOC. At 20 h p.i., WB uptake was again highest for DOTANOC, followed by DOTATATE and DOTATOC, correlating with the first half-life, which was shorter for DOTATATE and DOTATOC as compared with DOTANOC. Similar results were calculated regarding the second half-life: DOTANOC exhibited the longest WB residence time, while DOTATOC had the fastest washout. The estimated whole-body dose was therefore highest with DOTANOC, followed by DOTATATE and DOTATOC. There were significant differences in all parameters, when comparing DOTATATE with DOTATOC (Table 4). Except for the second half-life, parameters were also significantly different between DOTATATE and DOTANOC. When comparing DOTANOC with DOTATOC, there were significant differences with respect to uptake, residence time, and mean absorbed dose. The following results were obtained in the 25 patients receiving DOTATATE and DOTATOC: 24 out of the 25 patients (96%) exhibited higher WB uptake for DOTATATE as compared with DOTATOC at 20 h p.i. First half-life was longer for DOTATOC in 22 patients (88%) whereas for DOTATATE second half-life was longer in 17 (68%), and residence time in 23 patients (92%). In 22 patients (88%) whole-body dose was slightly, but statistically significantly, higher when using DOTATATE as compared with DOTATOC. In group 3, i.e., patients treated with DOTATATE and DOTANOC, the following results were obtained: in two out of three patients, DOTANOC had higher uptake at 20 h p.i., and longer first half-life and residence time. One patient also showed longer second half-life and higher mean absorbed WB dose when using DOTANOC.
Table 4
 via Cation Exchange Cartridges: Versatile Options
 Experience in Peptide Receptor Radionuclide Therapy
 Bombesin Analogs for Receptor-Mediated Imaging
 Somatostatin Receptor Detection After Peptide Receptor Radionuclide Therapy with 177Lu- and 90Y-DOTATOC (Tandem PRRNT) in a Patient with a Metastatic Neuroendocrine Tumor
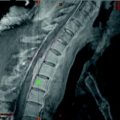 Rare Case of a Large Spinal Meningioma with Mediastinal Extension and Malignant Behavior Classified Histologically as Benign
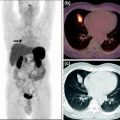 Role of 68Ga-Labeled Somatostatin Analogs in the Workup of Patients with NETs: AIIMS Experience


Significant differences between patients (group 1) treated with different peptides (indicated for respective pairs of peptides by •)
Related posts:
via Cation Exchange Cartridges: Versatile Options
Experience in Peptide Receptor Radionuclide Therapy
Bombesin Analogs for Receptor-Mediated Imaging
Somatostatin Receptor Detection After Peptide Receptor Radionuclide Therapy with 177Lu- and 90Y-DOTATOC (Tandem PRRNT) in a Patient with a Metastatic Neuroendocrine Tumor
Rare Case of a Large Spinal Meningioma with Mediastinal Extension and Malignant Behavior Classified Histologically as Benign
Role of 68Ga-Labeled Somatostatin Analogs in the Workup of Patients with NETs: AIIMS Experience
Stay updated, free articles. Join our Telegram channel
Full access? Get Clinical Tree
