9 Quantitative analysis of cardiac chamber geometry and ventricular function is an essential component of a complete cardiac evaluation. Many cardiac imaging studies—including echocardiography, nuclear scintigraphy, and cardiac magnetic resonance (MR) imaging—evaluate cardiac morphology and function. As part of a comprehensive cardiac imaging study, gated cardiac CT can provide an anatomically precise evaluation of chamber morphology and function, along with a detailed assessment of coronary anatomy and valves. With respect to chamber size, assessment of chamber enlargement is optimally performed with measurements indexed to body size.1 As cardiac CT is a relatively young technology, however, there are few published studies that quantify CT measurements for the assessment of cardiac morphology and function. Most of the criteria provided in this chapter are based on accepted echocardiographic standards.2 Is it appropriate to use echocardiographic standards when interpreting cardiac CT? Linear measurements of cardiac wall thickness and chamber size, as well as global measures of left ventricular (LV) function by electrocardiographically (ECG)-gated CT demonstrate a high correlation with echocardiography.3 However, several studies suggest that left atrial volume may be substantially underestimated by echocardiography compared with both CT4,5 and MR.6 Our own analysis suggests that volume measurements of the left atrium obtained during ECG-gated CT are approximately twice as large as the corresponding volumes calculated from transthoracic echocardiography with apical four-chamber and two-chamber measurements.7 Although the discrepancy can be explained in part by geometric assumptions used for echocardiographic calculations, much of the discrepancy persists when the same echocardio-graphic formulas are applied to CT data. Our findings therefore suggest that underestimation of left atrial volume by transthoracic echocardiography is related primarily to foreshortening of the left atrium and suboptimal definition of the back wall of the atrium when visualized from the cardiac apex. Based on our experience with cardiac CT and echocardiography, we believe that linear measurements of chamber size and wall thickness on CT correspond very well to conventional echocardiographic measurements obtained in the parasternal three-chamber view. There is no substantial foreshortening of anterior–posterior echocardiographic measurements in the parasternal view. CT measurements of ejection fraction also seem to correlate well with echocardiography.8 Although we provide additional echocardio-graphic standards for chamber area and volume in Table 9.1 that are generally calculated from apical views, the reader is cautioned that normative values for chamber area and volume on CT will be much larger than those defined by echocardiography. Further studies are needed to establish normative data for cardiac chamber volumes with ECG-gated CT and MR studies. To assess cardiac chamber morphology, size, and function, standard views that should be obtained include the four-chamber view, three-chamber view, two-chamber view, and short-axis projection. The three-chamber and five-chamber views are useful to assess the LV outflow tract (LVOT) and aortic valve. All of these views are typically created with a maximum intensity projection (MIP) technique with 2- to 5-mm slab MIPs. Normal values are available for chamber measurements obtained from these views (see Table 9.1). LV function should be reviewed in long axis (four-chamber view, three-chamber view, and two-chamber view) as well as short axis. Accurate calculation of LV volume and ejection fraction should be performed in two orthogonal long-axis planes or with short-axis views through the entire LV. The four-chamber view provides an overview of all four cardiac chambers and allows a side-by-side comparison of the right-sided and left-sided chambers (Fig. 9.1). To obtain a four-chamber MIP, the heart is rotated along its short axis so that both the mitral and tricuspid valves are visible. Once both valves are optimally imaged, the image is rotated into the long axis of the heart to extend the cardiac chambers and visualize the cardiac apex. The plane of this image is different from the standard axial image obtained on CT. A four-chamber view of the normal heart demonstrates that the cardiac apex is formed by the LV and that the right-sided chamber diameters are smaller than the corresponding left-sided chamber diameters. In the four-chamber projection, the lateral wall of the LV is observed as the free wall, whereas the interventricular septum separates the two ventricles. The interatrial septum and interventricular septum may be evaluated in this view by scrolling superiorly and inferiorly. Diastolic and systolic frames in the four-chamber projection demonstrate normal motion of the atrioventricular valves, as well as normal thickening and contraction of the ventricular walls.
Cardiac Morphology and Function
 Standard Imaging Views
 Four-Chamber View
| Women | Men |
|---|---|---|
LA dimension (systole) | 2.7–3.8 cm | 3.0–4.0 cm |
LA area | ≤20 cm3 | ≤20 cm3 |
LV dimension (diastole) | 3.9–5.3 cm | 4.2–5.9 cm |
LV volume | 56–104 cm3 | 67–155 cm3 |
LV volume/BSA | 35–75 mL/m3 | 35–75 mL/m3 |
Ejection fraction | ≥55% | ≥55% |
LV wall thickness (diastole) | 0.6–0.9 cm | 0.6–1.0 cm |
LV mass | 66–150 g | 96–200 g |
LV mass/BSA | 44–88 g/m3 | 50–102 g/m3 |
Abbreviations: BSA, body surface area; LA, left atrium; LV, left ventricle.
Source: Adapted from Neilan TG, Pradhan AD, King ME, Weyman AE. Derivation of a size-independent variable for scaling of cardiac dimensions in a normal paediatric population. Eur J Echocardiogr 2009;10(1):50–55.
 Three-Chamber View
The three-chamber view demonstrates the LV, left atrium, and aortic root in one image (Fig. 9.2). As discussed in Chapter 10, the three-chamber view is required to assess for mitral valve prolapse. It is also the standard view (from the parasternal window) for echocardiographic M-mode assessment of the size of the LV, left atrium, and aortic root. This view is most easily obtained by identifying the shared portion of the annulus between the aortic and mitral valves—the mitral–aortic intervalvular fibrosa—on an axial image. The intervalvular fibrosa is selected as a fixed center of rotation. The heart is rotated around this point such that both the aortic and mitral valves are visualized, and the LV is elongated to image the apex of the heart. The aorta and left atrium are demonstrated above the LV. The anteroseptal wall is ipsilateral to the aortic valve; the inferolateral wall (formerly known as the posterior wall) is ipsilateral to the left atrium.
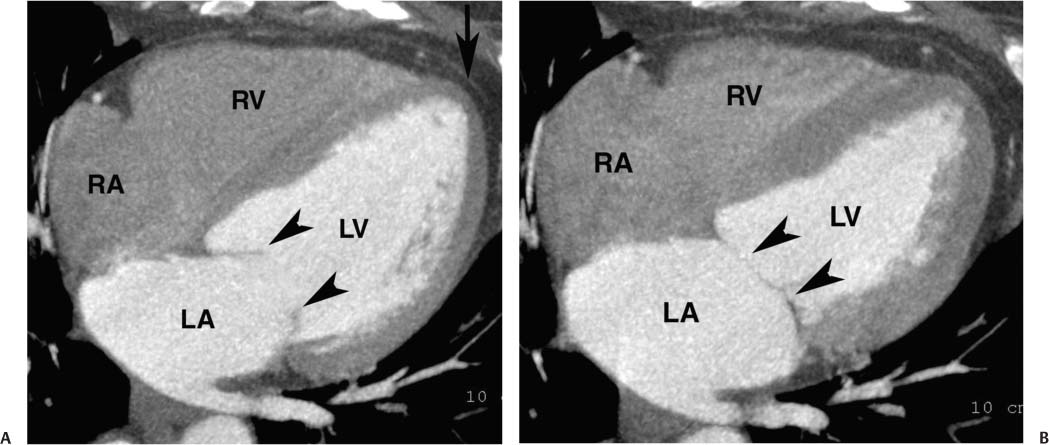
Fig. 9.1 Four-chamber view of the heart. (A) Four-chamber view in diastole. The four-chamber view is obtained in a plane that passes through both the mitral and tricuspid valves and demonstrates the cardiac apex. The open mitral valve (arrowheads) is identified between the left atrium (LA), and left ventricle (LV). The tricuspid valve is present between the right atrium (RA), and right ventricle (RV) but is not well visualized because a saline flush was used to clear contrast out of the right side of the heart. The cardiac apex is formed by the tip of the left ventricle (arrow). Although the RV volume is slightly greater than the LV volume, the width of the LV appears greater on the four-chamber view. (B) Four-chamber view in systole. The ventricles have contracted and appear smaller. The mitral valve is in a closed position (arrowheads). The atria appear larger at end systole because atrial filling occurs during systole.

Fig. 9.2 Three-chamber view. (A) End diastole. The left atrium (LA), left ventricle (LV), and proximal ascending aorta are visualized. This projection is obtained by setting a center of rotation on the mitral–aortic intervalvular fibrosa. The image is then rotated to demonstrate both valves and to elongate the LV. The size of the LV chamber is measured at the level of the chordal insertions on the mitral leaflets. (B) End systole. The LV has contracted. The LA is slightly larger during systole, but it is clearly within normal limits. The aortic and mitral valves are suboptimally visualized because of systolic heart motion. (C) End diastole in a second individual. Once again, the LV chamber size is measured just below the open mitral valve. The aortic valve is in a closed position. The aortic root is measured above the level of the aortic valve (bar). (D) End systole. The LV has now contracted, and the mitral valve is in the closed position. A calcification is identified in the posterior mitral annulus (arrowhead). Posterior mitral annular calcification is a common finding. LA size is measured in the three-chamber view at end systole at the level of the aortic root. The LV outflow tract (LVOT) is marked below the level of the aortic valve (bar). (E) Short-axis view of the LVOT with anteroposterior and transverse measurement (bars). The LVOT often has a mildly oval shape.
The LV diameter is measured on the three-chamber view at the level of the chordal attachments just below the tips of the mitral leaflets (Fig. 9.2). The aortic root is typically measured at the level of the sinuses of Valsalva, just above the aortic valve, although measurement of the diameter at the sinotubular junction may also be useful. The left atrium is measured along its minor axis (antero-posterior dimension), in a plane that is roughly parallel to the aortic root. This convention derives from M-mode data, although now measurements will frequently be performed on the two-dimensional image. The maximum diameters of the LV and the aortic root are measured at end diastole; the maximum diameter of the left atrium is measured at end systole. Normal values for the left atrium and ventricle are presented in Table 9.1. The expected aortic root diameter is slightly smaller than the left atrium diameter. Published equations are available that relate the precise limits of normal aortic root diameter to age and body surface area.9
The LVOT diameter is traditionally measured at midsystole in the (parasternal) three-chamber view, just below the plane of the aortic valve, at the level of the insertion points of the aortic valve leaflets (Fig. 9.2D). This measurement is used for echocardiographic calculation of aortic valve area with the continuity equation. Measurement errors in the echocardio-graphic assessment of LVOT diameter are a common cause of errors in calculation of aortic valve area, particularly because any measurement error is compounded by its squaring to obtain area. A more accurate estimate of the true LVOT area may be obtained with a two-dimensional CT cross-section of the LVOT. To visualize the LVOT in cross-section, an MIP is created in the short axis of the aortic valve and stepped caudally to demonstrate the short axis of the LVOT (Fig. 9.2E).
 Two-Chamber View
The two-chamber projection demonstrates only the left atrium and LV, with the mitral valve separating these two chambers (Fig. 9.3). The right-sided chambers and the aorta are not visible in this projection. Starting with a four-chamber or a three-chamber view, the two-chamber view is obtained by setting the center of rotation at the center of the mitral valve and rotating the image so that the right–sided chambers and aorta are no longer visible. As with the four-chamber and three-chamber views, the imaging plane is adjusted to maximize the length of the LV and to demonstrate the LV apex. The two-chamber projection demonstrates the inferior wall of the LV along the diaphragm. The anterior wall is opposite the inferior wall.
 Five-Chamber View
The four-chamber, three-chamber, and two-chamber views are obtained by rotating the imaging plane in the true long axis of the LV. Each of these views is rotated about 60 degrees from the adjacent view to provide a complete picture of the LV walls for assessment of function. The five-chamber projection is tilted away from the true long axis of the four-chamber view to provide an additional assessment of the LVOT and aortic valve (Fig. 9.4). The five-chamber view is obtained from the four-chamber view by setting the center of rotation on the cardiac apex and tilting the base of the heart in a cranial direction to demonstrate the aortic root. As with the four-chamber view, this view demonstrates the septum and the lateral walls of the LV, although the portion of the septum that is demonstrated is more anterior than that seen in the four-chamber view.
 Atrial Anatomy
The two atria serve as antechambers for blood entering into their respective ventricles. The left atrium is the most superior and the most posterior of all four cardiac chambers. Inflow from the left atrium to the LV is directed in an anterior–inferior–leftward direction through the mitral valve into the LV. The right atrium is anterior, to the right, and inferior relative to the left atrium. A thin septum separates the right and left atria. The tricuspid valve is located on the anterior or left aspect of the right atrium. The right ventricular inflow (tricuspid valve) and right ventricular outflow (infundibulum to pulmonic valve) form an arc anterior to the aortic valve, perpendicular to the long axis of aortic outflow; both the tricuspid and pulmonic valves are visible along this arc on a short-axis image through the aortic valve.
Atrial diastole, the time during which the two atria fill with blood, corresponds to ventricular systole. In normal sinus rhythm, the atria distend to their maximum volume during ventricular systole. Rapid ventricular filling in early diastole results from active relaxation of the ventricles, as well as elastic recoil from the force of systolic contraction. Additional ventricular filling in late diastole is related to active contraction of the atria (atrial systole). To obtain a consistent and accurate measurement of atrial size, atrial measurements should be obtained at end systole (Fig. 9.2).
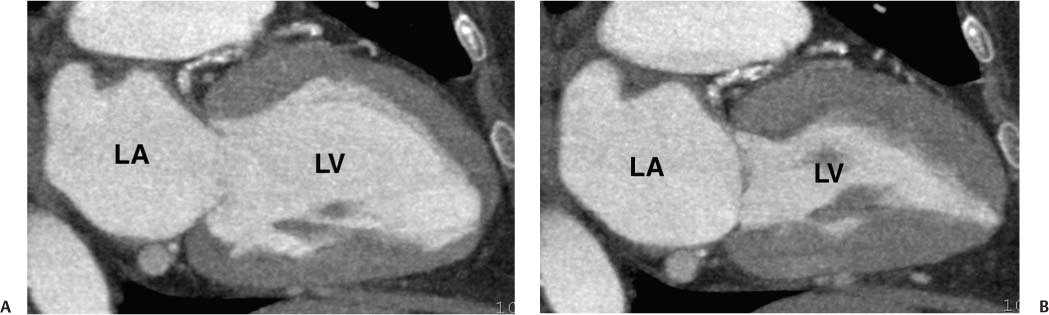
Fig. 9.3 Two-chamber view obtained by setting a center of rotation on the mitral valve and rotating the heart so that the right ventricle and aorta are no longer visible. As with the four-chamber and three-chamber views, rotation is performed to elongate the left ventricle (LV) and display the apex of the heart. (B) Two-chamber view in systole. The mitral valve is now closed. LA, left atrium.
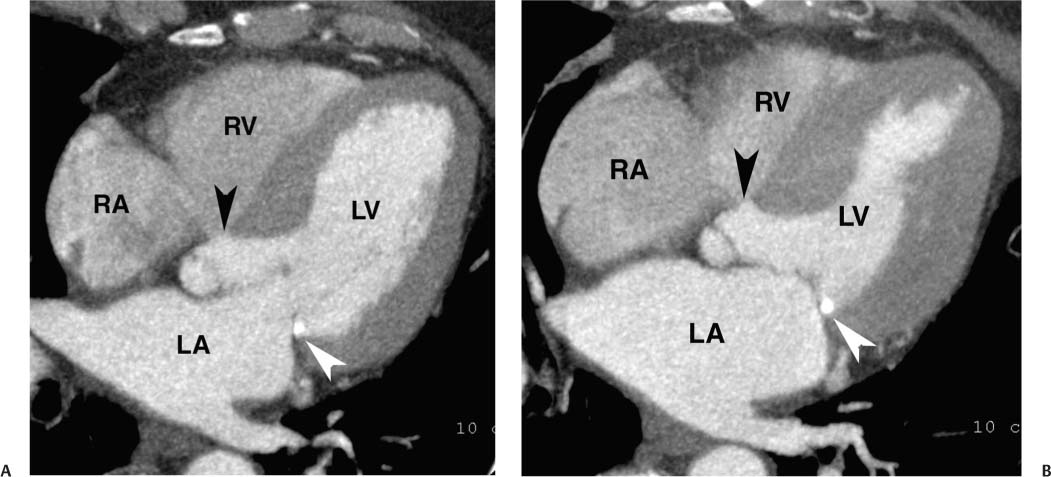
Fig. 9.4 (A) Five-chamber view in diastole. The four-chamber view is angled cranially to display the root of the aorta (black arrowhead) in addition to the four cardiac chambers. Posterior mitral annular calcification is identified (white arrowhead). (B) Five-chamber view in systole. RV, right ventricle; RA, right atrium; LA, left atrium; LV, left ventricle.
The right and left atria demonstrate narrow anterior extensions, the atrial appendages, which are visible on the surface of the heart (Figs. 9.5 and 9.6). The right atrial appendage is a relatively flat triangular structure that extends anteriorly over the right anterior surface of the heart. The anterior margin of this appendage often covers the proximal right coronary artery in the right atrioventricular (AV) groove. The left atrial appendage is a crescent-shaped structure that extends anteriorly from the left atrium, covering the left AV groove, and terminating over the junction of the left AV groove with the anterior inter-ventricular groove. The left atrial appendage often covers the left main coronary artery, as well as the origin of the circumflex and left anterior descending artery. The left atrial appendage may have a more complex configuration with accessory lobes. Both atrial appendages contain trabecular fibers known as pectinate muscles.
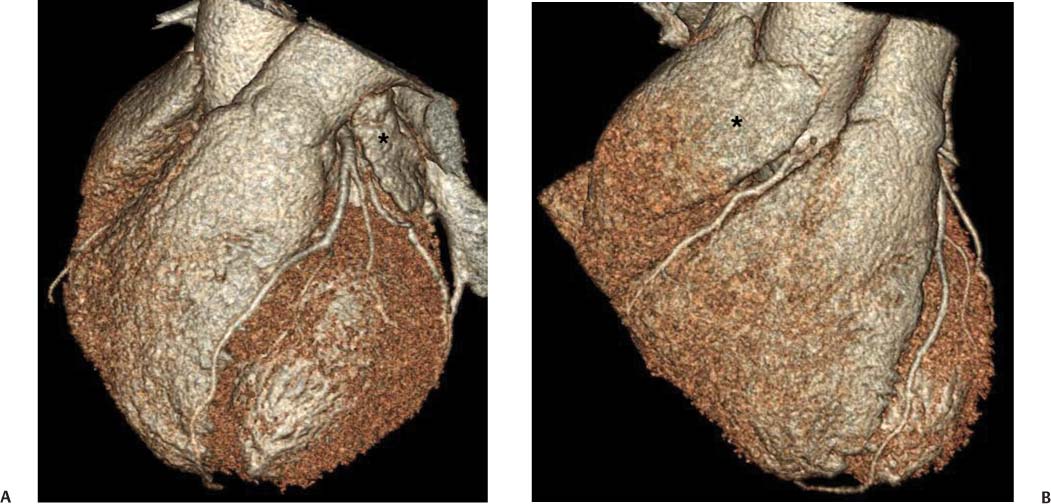
Fig. 9.5 Atrial appendages. (A) Surface-rendered image in the left anterior oblique projection demonstrates the left atrial appendage (*). The left atrial appendage often obscures the underlying proximal circumflex and left main coronary arteries. (B) Surface-rendered view in the anterior projection demonstrates the right atrial appendage (*). The right coronary artery is clearly visible in this case just below the atrial appendage.
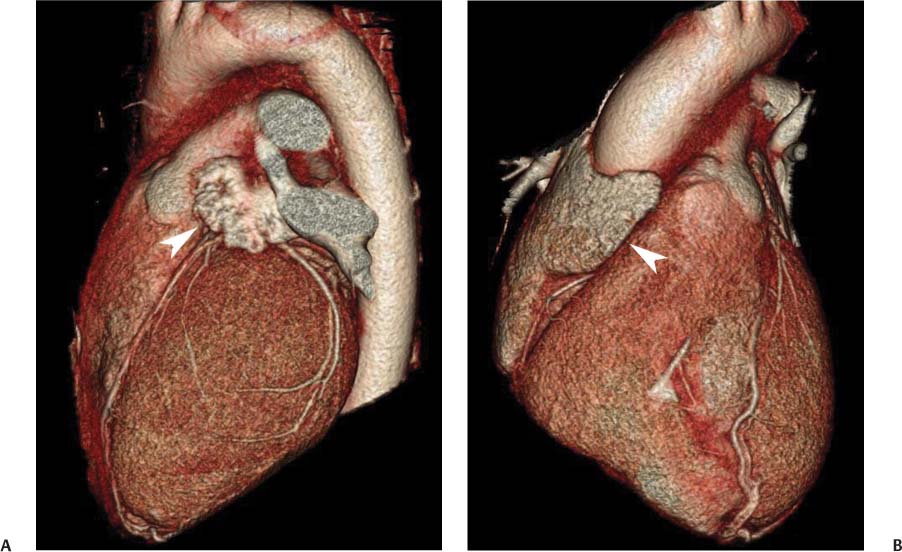
Fig. 9.6 Atrial appendages. (A) Left anterior oblique surface-rendered image demonstrates the left atrial appendage (arrowhead), which over-lies the origin of both the circumflex and left anterior descending arteries. (B) Anterior surface rendered projection demonstrates the right atrial appendage (arrowhead), which overlies the origin of the right coronary artery.
 Right Atrium
As the antechamber for the right ventricle, the right atrium receives inflow from the superior vena cava (SVC), the inferior vena cava (IVC), and the coronary sinus. The SVC enters the roof of the right atrium between the base of the right atrial appendage and the superior margin of the interatrial septum. The IVC enters the posterolateral portion of the floor of the right atrium along the inferior margin of the interatrial septum. The smooth-walled sinus venosus portion of the right atrium extends between the orifices of the SVC and IVC. The coronary sinus crosses the crux of the heart from the left AV groove to enter the inferior aspect of the right atrium adjacent to the inferior margin of the interatrial septum. Although both the IVC and coronary sinus enter the right atrium along the inferior margin of the interatrial septum, the orifice of the coronary sinus is slightly more anterior and to the left, closer to the tricuspid annulus and to the crux of the heart.
Anatomic variations of normal right atrial anatomy can mimic the presence of a mass. A ridge of muscle along the right side of the right atrium, the crista terminalis, extends from the IVC orifice up to the SVC orifice. The crista terminalis separates the smooth sinus venosus portion of the right atrium from the more anterior trabeculated right atrial appendage (Fig. 9.7). The crista terminalis has a variable thickness and can appear masslike within the right atrium.10 The sulcus terminalis is a subtle groove on the epicardial surface of the heart corresponding to the crista terminalis. The sinoatrial node is located in the sulcus terminalis.
The Chiari network consists of long fibers that extend from the crista terminalis to the eustachian valve. These fibers may interfere with device placement during a percutaneous interventional procedure and are a potential, although infrequent, site of right atrial thrombus or attachment of an embolus in transit. Pectinate muscles along the right atrial appendage and along the free wall of the right atrium can appear prominent and can mimic the presence of thrombus. Lipomatous hypertrophy of the interatrial septum (see below) bulges preferentially into the right atrium and may be associated with thickening of the crista terminalis. The typical location, shape, and density of these anatomic structures distinguish them from intracardiac tumor or thrombus (Fig. 9.8).11
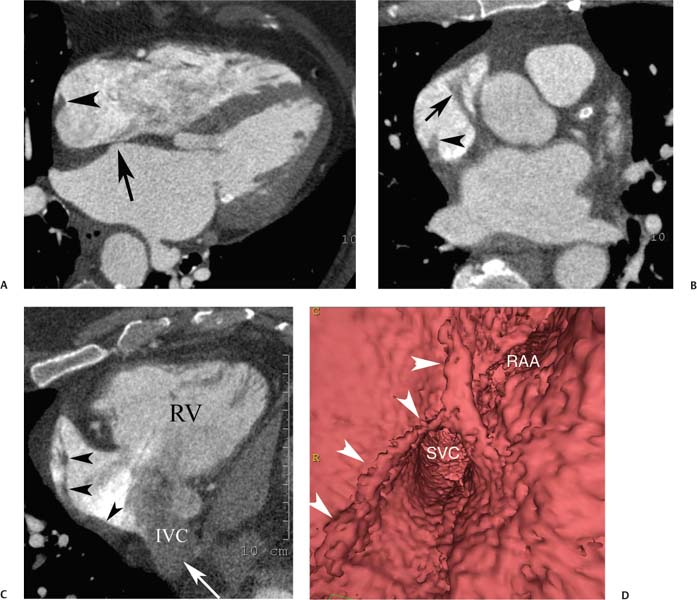
Fig. 9.7 Right atrial anatomy: crista terminalis and pectinate muscles. (A) Four-chamber view at the level of the fossa ovalis (arrow) demonstrates the crista terminalis as a ridge along the right side of the right atrium (arrowhead). (B) Axial maximum intensity projection through the superior right atrium and atrial appendage demonstrates continuation of the crista terminalis (arrowhead) to the level of the appendage as well as pectinate muscle bundles (arrow) within the appendage. (C) Right ventricular (RV) inflow view demonstrates continuity of the crista terminalis (arrowheads) from the lower portion of the right atrium adjacent to the inferior vena cava (IVC) orifice up to the atrial appendage. Unopacified blood enters the right atrium from the IVC (arrow). (D) Endoluminal view demonstrates the crista terminalis (arrowheads) as it passes adjacent to the superior vena cava (SVC) and passes into the base of the right atrial appendage (RAA).
The eustachian valve is an embryologic remnant that presents as a flap of variable thickness and mobility along the orifice of the IVC and may continue as a ridge along the right atrium. The cavotricuspid isthmus is the part of the right atrium between the ostium of the IVC, the eustachian ridge, and the tricuspid valve. This area is important in the management of certain arrhythmias, most notably atrial flutter. In theory the eustachian valve or ridge might present as a small defect along the right atrium. In practice, however, the eustachian valve and ridge are not easily identified by CT because of the inflow of unopacified blood from the IVC.
 Left Atrium
As the antechamber for the LV, the left atrium receives inflow from the pulmonary veins. Anatomic variation in the drainage of the pulmonary veins into the left atrium is discussed in detail in Chapter 11. Left atrial size has been traditionally reported by a single diameter measurement on the three-chamber view. More recent echocardiographic studies suggest that atrial volumes, calculated from four-chamber and two-chamber views, provide a more clinically relevant estimate of chamber size compared with one-dimensional measurements of atrial diameter or two-dimensional measurements of atrial area.12,13 Area measurements of the left atrium can be quantified on the four-chamber view (Fig. 9.9) and on the two-chamber view. These areas can be converted to a volume measurement via the area-length equation: 8/3π [(A1)(A2)/L], where A1 and A2 are the areas from the four- and two-chamber views, respectively, and L is the shortest inferior–superior length from the annular plane to the back wall of the atrium. However, as noted in the introduction to this chapter, normative values for atrial volumes computed from apical four-chamber and two-chamber views by echocardiography underestimate the volumes measured by cardiac CT. Thus, although we believe it is important to assess chamber morphology on CT in standard echocardiographic projections, one must be careful not to overcall chamber enlargement based on published echocardiographic standards for chamber volume. Enlargement of the left atrium may be suggested when the atrium appears larger than the adjacent aortic root in the three-chamber view (Fig. 9.10A) or when the left atrium appears large relative to the LV on the four-chamber view (Fig. 9.10B).
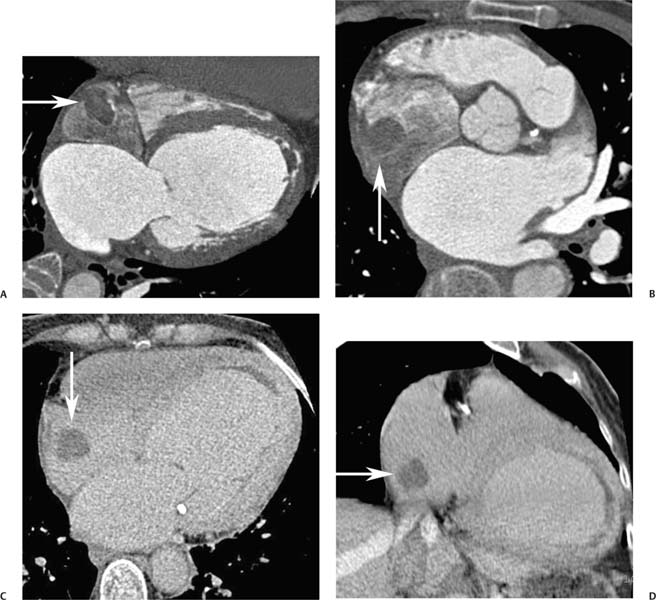
Fig. 9.8 Right atrial thrombus. (A) Four-chamber view in the arterial phase demonstrates a hypodense mass attached to the low anterior wall of the right atrium and outlined by contrast (arrow). (B) Short-axis image again demonstrates the right atrial mass (arrow). (C) Four-chamber view in a delayed phase demonstrates that there is no enhancement of the mass (arrow). (D) Delayed view demonstrates that the mass is just above the insertion of the inferior vena cava into the right atrium. Right atrial thrombus is often related to the presence of a catheter in the superior vena cava. This patient had a right atrial catheter recently removed. Follow-up magnetic resonance imaging demonstrated shrinkage of the mass with anticoagulation, confirming that it represented a thrombus.
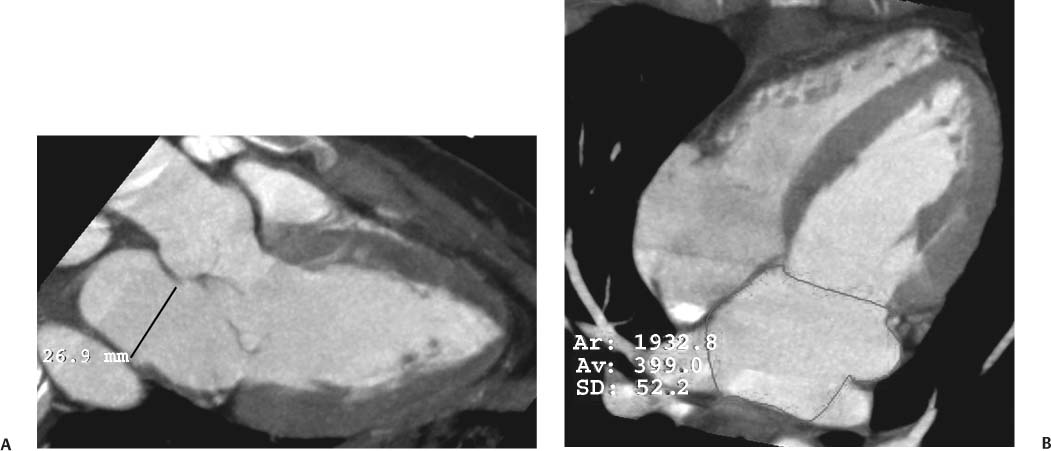
Fig. 9.9 Normal left atrium measurements. (A) Three-chamber view in systole demonstrates the proper position to measure the left atrium at the level of the aortic root. (B) Four-chamber view demonstrating measurement of left atrial area in a different patient. The left atrium is top normal in size.
Left atrial dilatation is associated with many disease processes, including LV failure, hypertension, and mitral valve disease. A dilated left atrium may be present in association with atrial fibrillation, both as a contributing cause and as a consequence of atrial fibrillation. Clot may form in a dilated left atrium, most commonly within the left atrial appendage (Fig. 9.11). Left atrial thrombus may result in embolic complications, including stroke.
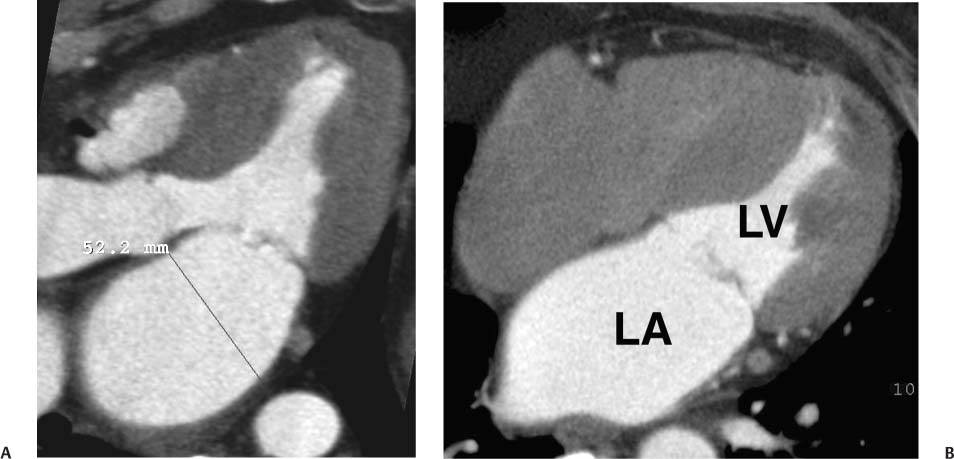
Fig. 9.10 Left atrial (LA) enlargement. (A) Three-chamber view in systole demonstrates measurement of the LA at the level of the aortic root. LA size of 5.2 cm suggests at least moderate dilatation of the LA. (B) Four-chamber view through the heart in systole again demonstrates enlargement of the LA. The LA area can be measured in the four-chamber view, but there are no established criteria for a single linear measurement of the left atrium in this projection. LV, left ventricle.
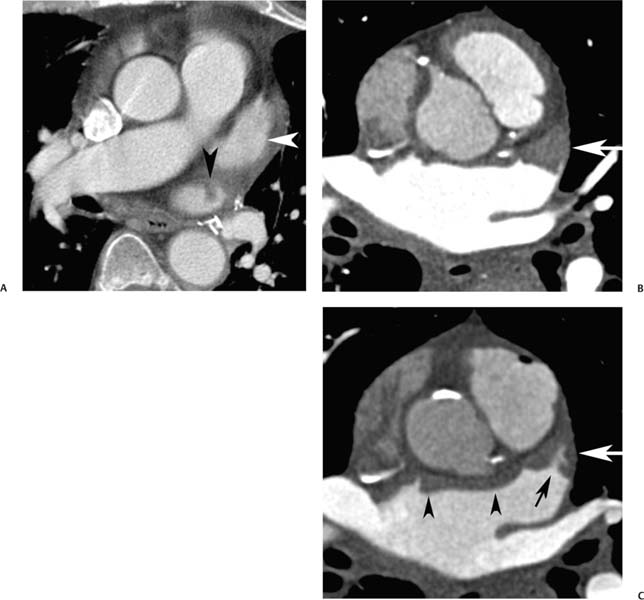
Fig. 9.11 Left atrial thrombus in two patients. (A) Axial image at the level of the left atrial appendage (white arrowhead) demonstrates a small thrombus in the roof of the left atrium (black arrowhead) adjacent to the insertion of the left superior pulmonary vein. (B) Axial image through the level of the atrial appendage in a second patient demonstrates low-density material filling the left atrial appendage (arrow). This finding is suggestive of thrombus but could be related to stasis with slow entry of contrast into the atrial appendage. (C) Delayed axial image at a similar level demonstrates contrast entering the appendage (black arrow) with peripheral thrombus along the wall of the appendage (white arrow). Low-density material along the anterior wall of the left atrium (black arrowheads) represents mural thrombus extending to the anterior wall of the left atrium. When there is uncertainty about whether the low density represents thrombus versus stagnant flow, a delayed scan may be useful to clarify the diagnosis.
 Atrial Septum
The interatrial septum is a thin-walled structure between the right and left atria. The interatrial septum develops from two separate structures, the septum primum and the septum secundum. The septum primum develops first and extends toward the AV junction. The gap that is present during development between the septum primum and the AV junction is called the ostium primum. As the septum primum closes this gap, a series of fenestrations within the septum primum coalesce into the ostium secundum. The septum secundum then grows to the right of the septum primum to cover this ostium secundum. During fetal life, a connection between the atria remains as an oblique pathway that courses between the septum primum and septum secundum and through the ostium secundum, taking oxygenated blood from the placenta to the systemic circulation, bypassing the pulmonary circuit. This pathway, the foramen ovale, generally closes after birth. However, the resultant fossa ovalis may be visible as an area of thinning within the interatrial septum (Fig. 9.12A). In patients with incomplete fusion of the septum primum to the septum secundum, the residual space between the septum primum and septum secundum may be visible on imaging (Fig.9.12B). A redundancy of the interatrial septum is often present at the level of the fossa ovalis (Fig. 9.12C). When this redundancy is large, the finding is called an interatrial septal aneurysm (Fig. 9.12D,E). Atrial septal aneurysms are diagnosed when the septum protrudes 11 mm off the mid-line or demonstrates a total excursion of 15 mm during the cardiac cycle.14 Atrial septal aneurysms are associated with an increased incidence of thromboembolic events, with the presence of a patent foramen ovale (PFO) (Fig. 9.13), and with small perforations in the atrial septum associated with interatrial shunting (see Fig. 14.3).
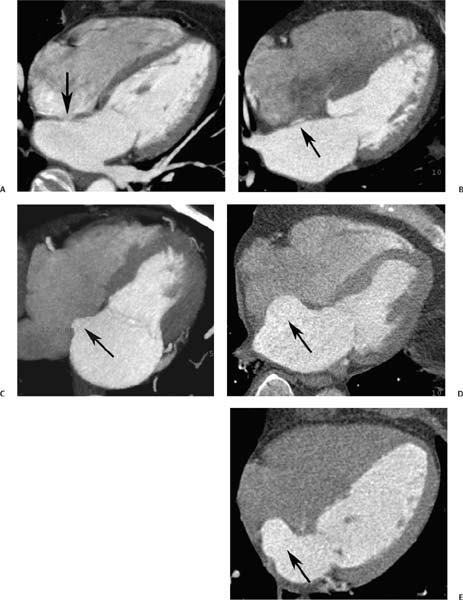
Fig. 9.12 Interatrial septum with demonstration of a continuum of appearances ranging from a normal fossa ovalis to an atrial septal aneurysm in five different patients. (A) Four-chamber view demonstrates a focal thinning of the interatrial septum corresponding to the fossa ovalis (arrow). (B) Four-chamber view demonstrates contrast within the fossa ovalis (arrow) between the septum primum and septum secundum, but there is no visible shunting of contrast into the right atrium. This likely represents a patent foramen ovale. (C) Four-chamber view demonstrates enlargement of the left atrium with a saccular pouch at the level of the fossa ovales (arrow) secondary to redundant tissue in the atrial septum. (D) Four-chamber view demonstrates an atrial septal aneurysm (arrow). The diagnosis of an atrial septal aneurysm is made when the excursion of the atrial septum is greater than 15 mm with an aneurysm base of at least 10 to 15 mm. Atrial septal aneurysms are associated with acquired and congenital heart disease, as well as with cardioembolic events. (E) Four-chamber view demonstrates an atrial septal aneurysm (arrow).
Lipomatous hypertrophy of the interatrial septum is increasingly recognized with CT of the heart (Fig. 9.14) and can present as an area of increased 2-fluoro-2-deoxyglucose (FDG) uptake during positron emission tomography (Fig.9.15).15 Lipomatous hypertrophy consists of unencapsulated mature adipose cells that proliferate within the interatrial septum. This entity was first described in 1964.16 In a prospective study using CT, lipomatous hypertrophy was identified in 2.2% of the patients.17 Lipomatous hypertrophy is associated with obesity and is seen more frequently in older patients. The diagnosis of lipomatous hypertrophy of the interatrial septum is based on a characteristic fat density with thickening of the interatrial septum in a dumb-bell shape that spares the fossa ovalis. Lipomatous hypertrophy is generally a benign entity, although it may be associated with supraventricular arrhythmia and, in singular cases, with sudden death.18 Rarely, lipomatous hypertrophy may present with SVC obstruction or intractable arrhythmia (Fig. 9.14D).19
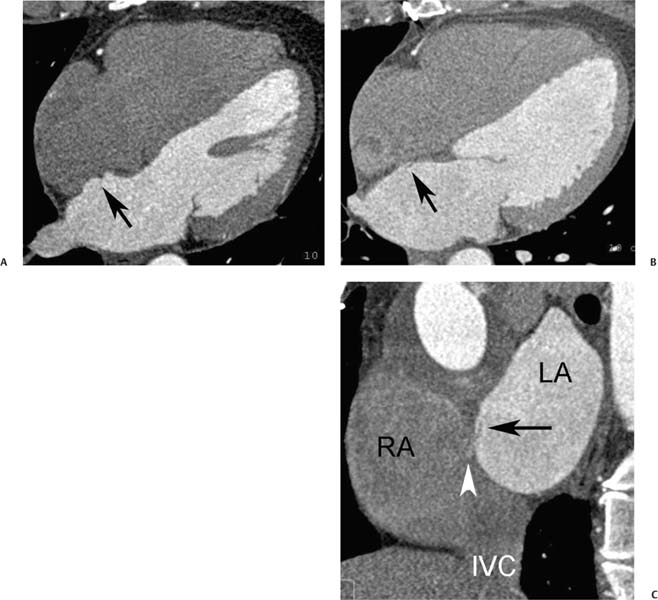
Fig. 9.13 Patent foramen ovale in the setting of an atrial septal aneurysm. (A) Four-chamber view demonstrates an atrial septal aneurysm (arrow). (B) Four-chamber view at a slightly higher level demonstrates a small flap related to the unfused end of the septum primum (arrow). (C) Oblique sagittal view of the left atrium (LA) and right atrium (RA) demonstrates the flap of the septum primum (arrow) as well as a small jet of contrast entering the RA (arrowhead). IVC, inferior vena cava.
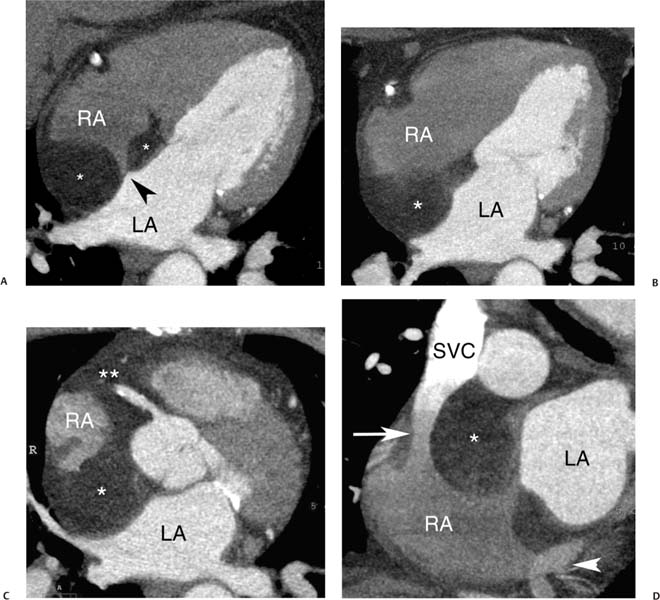
Fig. 9.14 Lipomatous hypertrophy of the interatrial septum with mass effect. (A) Four-chamber view at the level of the fossa ovalis demonstrates lipomatous tissue infiltrating the septum (*) between the right (RA) and left atria (LA) with sparing of the fossa ovalis (arrow head). (B) Four-chamber view above the level of the fossa ovalis demonstrates low-density material infiltrating the entire interatrial septum (*). (C) Slab maximum intensity projection (MIP) at a higher level demonstrates extensive lipomatous infiltration around the RA (*) extending into the right atrioventricular groove around the right coronary artery (**). The RA is compressed by the lipomatous tissue. (D) Sagittal MIP demonstrates lipomatous infiltration (*) that narrows the lumen of the superior vena cava (SVC) (arrow). However, the infiltration respects the fossa ovalis, which is not involved. The coronary veins are seen to enter the inferior aspect of the RA via the coronary sinus (arrowhead).
 Foramen Ovale
The patent foramen ovale is a hemodynamically insignificant communication between the right and left atria at the level of the fossa ovalis. The foramen ovale normally closes spontaneously after birth. However, a probe PFO may be present in upward of 25% of the adult population.20 A probe PFO is not generally associated with an intracardiac shunt,21 but it may be detected echocardiographically with a Valsalva maneuver during injection of agitated saline. A PFO is prone to serve as a conduit for paradoxical right-to-left embolization. Paradoxical embolism is often cited as one possible cause of ischemic stroke.22 Clinical studies suggest an increased prevalence of migraine headaches with aura in patients with a PFO.23 Trials are currently under way to evaluate the efficacy of PFO closure for prevention of migraine headaches and for secondary prevention of embolic stroke. The site of a PFO may be visible on cardiac CT (Fig. 9.16), but interatrial shunting is uncommonly demonstrated. PFO can be differentiated from an atrial septal defect (ASD) based on its tunneled intraseptal course (Fig. 9.12B) or the presence of a flap valve on the left atrial side of the foramen, representing the free margin of the septum primum that overlaps the septum secundum (Figs. 9.13 and 9.16).24,25 The shunt from a PFO is generally directed toward the orifice of the IVC (Fig. 9.16C and see Fig. 16.1E).
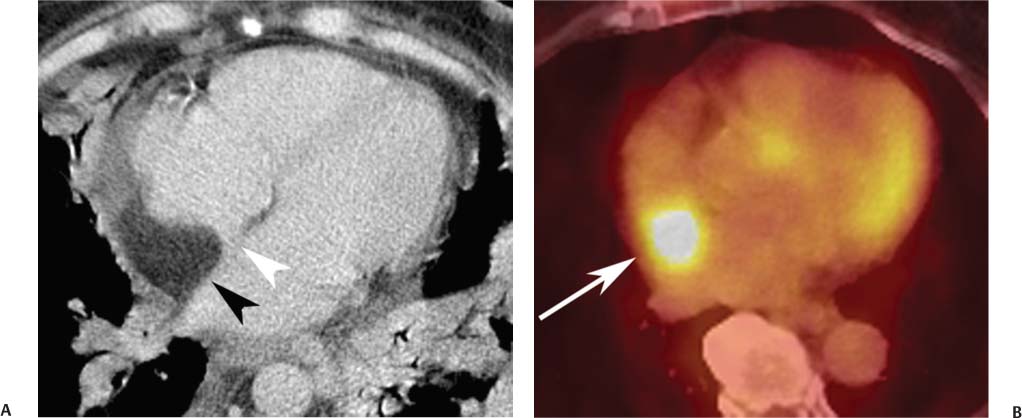
Fig. 9.15 Lipomatous hypertrophy within the interatrial septum. (A) The lipomatous tissue (black arrowhead) in the septum has a characteristic appearance of a low-density area of infiltration within the septum, respecting the fossa ovalis (white arrowhead). (B) 2-Fluoro-2-deoxyglucose (FDG)-positron emission tomography demonstrates the presence of increased metabolic activity corresponding to the site of lipomatous hypertrophy (arrow). It is important to recognize this finding to avoid false-positive interpretations related to lipomatous hypertrophy.
 Intracardiac Shunts
Intracardiac shunts found in the adult include ASDs, ventricular septal defects (VSDs), partial anomalous pulmonary venous return (PAPVR), and patent ductus arteriosus (PDA). Intracardiac shunts generally result in flow from the high (systemic) pressure left-sided circulation into the lower (pulmonary) pressure right-sided circulation. Increased flow related to intracardiac shunts results in volume overload and dilatation of the right side of the heart (Figs. 9.18, 9.19, 9.20, 9.21, 9.22, 9.23, 9.24, 9.25, 9.26, 9.27, 9.28, 9.29, 9.30, and 9.31). PDA is associated with increased blood flow through both sides of the heart and results in dilatation of the LV along with right-sided chamber dilatation. Elevation of pulmonary pressure is initially related to increased volume without a change in pulmonary resistence; but when a shunt of sufficient volume persists for an extended period, increased pulmonary resistance may result as well. Once right-sided pressures are elevated beyond the left-sided pressures, Eisenmenger physiology develops with reversal of shunt flow from the right-sided circulation into the left-sided circulation and an associated decrease in left-sided oxygen saturation.
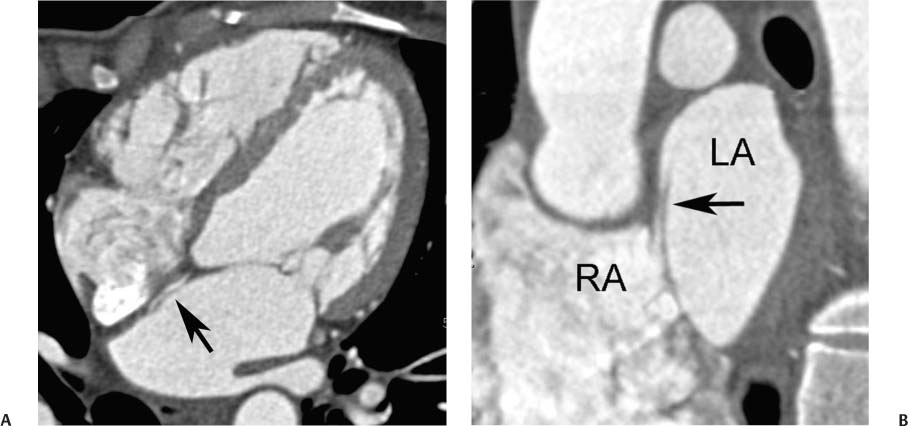
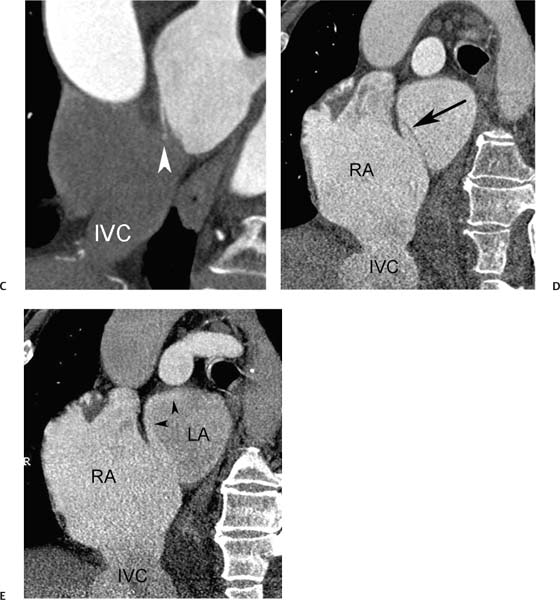
Fig. 9.16 Patient foramen ovale (PFO). (A) Four-chamber view in diastole demonstrates a patent tunnel within the interatrial septum between the septum primum and septum secundum (arrow). (B) Oblique sagittal view of the left atrium (LA) and right atrium (RA) demonstrates the flap of the septum primum on the LA side of the PFO (arrow). Patient foramen ovale (PFO). (C) Oblique sagittal view in a second patient demonstrates that the left-to-right shunt through the PFO is directed inferiorly (arrowhead) toward the orifice of the inferior vena cavaI (IVC). (D) Oblique sagittal view in a third patient with elevation of right-sided pressures (Eisenmenger physiology) demonstrates the flap of the septum primum on the LA side of the PFO (arrow) as well as a dilated RA. (E) Similar view during reinjection of contrast into the RA demonstrates right-to-left shunting of contrast through the foramen ovale and along the superior aspect of the LA (arrowheads).
 Atrial Septal Defect
ASDs are present in about 10% of newborns with congenital heart disease and are also encountered in adults. Most small ASDs (<8 mm in diameter) diagnosed in the first 3 months of life will close spontaneously before 18 months of age.26 Larger ASDs do not generally close spontaneously and may persist into adult life.
ASDs are classified based on location. The ostium secundum defect, located in the midportion of the interatrial septum, accounts for 50 to 75% of ASDs (Figs. 9.17, 9.18, 9.19, and 9.20). An ostium primum defect, located adjacent to the AV valve plane, accounts for about 15 to 30% of defects. This type of defect is often associated with endocardial cushion defects and may be associated with abnormalities of the AV valves, including cleft anterior mitral leaflet and mitral regurgitation. Ostium primum ASD is a cardiac anomaly associated with Down syndrome. The next most common subtype of ASD is the sinus venosus ASD. Most sinus venosus ASDs are located in the upper septum adjacent to the entrance of the SVC (Figs. 9.21, 9.22, and 9.23). These superior sinus venosus defects are often associated with a superior SVC that overrides both atria and anomalous drainage of the superior right pulmonary vein into the SVC. Rarely, a sinus venosus ASD may be located in the inferior portion of the interatrial septum, adjacent to the IVC (Fig. 9.24). An inferior sinus venosus ASD is not generally associated with anomalous pulmonary venous drainage. Finally, a rare form of ASD is the unroofed coronary sinus that communicates with the left atrium. Unroofed coronary sinus is frequently associated with other forms of congenital heart disease and is also frequently associated with a persistent left SVC. When treatment of an ASD is required, both surgical and percutaneous treatment options are available for closure.27
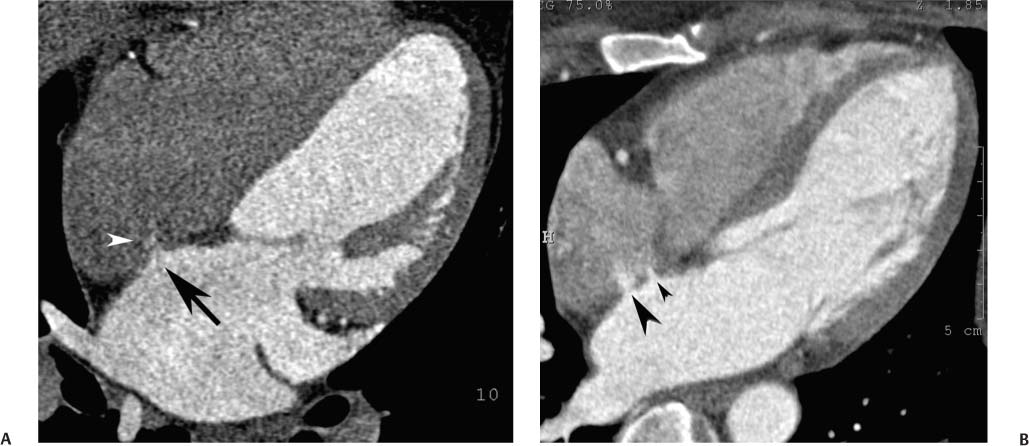
Fig. 9.17 Small ostium secundum atrial septal defects (ASDs). (A) Four-chamber view demonstrates thinning of the atrial septum at the level of the foramen ovale (black arrow). Subtle left-to-right shunting of contrast is visible through this portion of the septum (white arrow). (B) Four-chamber view in a second patient demonstrates normal-sized cardiac chambers with two defects in the atrial septum (arrowheads). The recognition of multiple defects or a fenestrated ASD can be important if the patient is to have successful percutaneous repair of the ASD (Chapter 12).
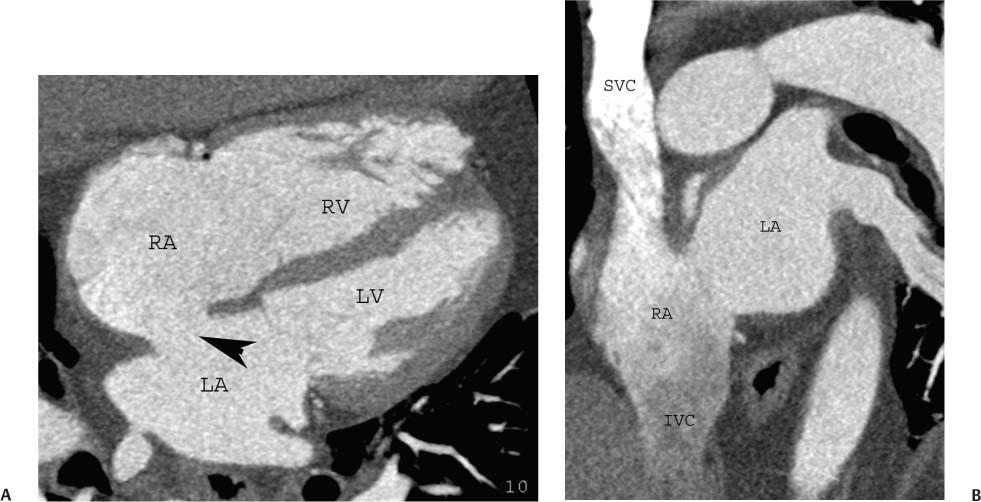
Fig. 9.18 Ostium secundum atrial septal defect (ASD). (A) Four-chamber view of the heart demonstrates a normal-sized left side of the heart (left atrium [LA] and left ventricle [LV]), mild enlargement of the right side of the heart (right atrium [RA] and right ventricle[RV]) and an obvious ASD (arrowhead). (B) Coronal view through the atria demonstrates a wide communication between the RA and LA. The superior vena cava (SVC) and inferior vena cava (IVC) are seen to empty into the RA.
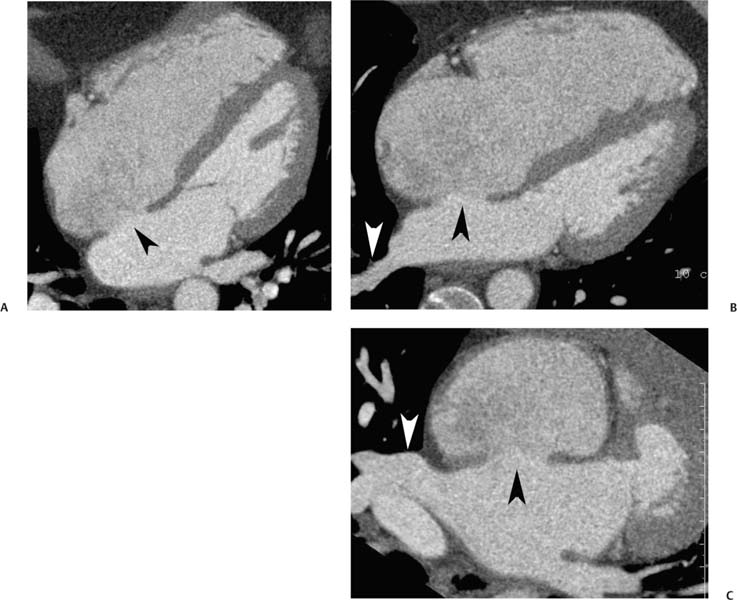
Fig. 9.19 Ostium secundum atrial septal defect (ASD) with right-sided heart enlargement. (A) Four-chamber view of the heart demonstrates enlargement of the right side of the heart. The apex of the heart is formed by the right ventricle. A large secundum ASD defect is present (arrowhead). Right-sided heart enlargement in this patient is related to right-sided volume overload secondary to shunting through the ASD. (B) Angled four-chamber view at a slightly more caudal level again demonstrates the ASD (black arrowhead). In addition, the right inferior pulmonary vein (white arrowhead) is identified as it enters the left atrium. (C) Image through the left atrium at the level of the right superior pulmonary vein (white arrowhead). The ostium secundum ASD is again identified (black arrowhead). The right superior pulmonary vein enters the left atrium. The left superior pulmonary vein is also visualized entering the left atrium at the bottom of the image. Ostium secundum-type ASDs are associated with normal pulmonary venous anatomy.
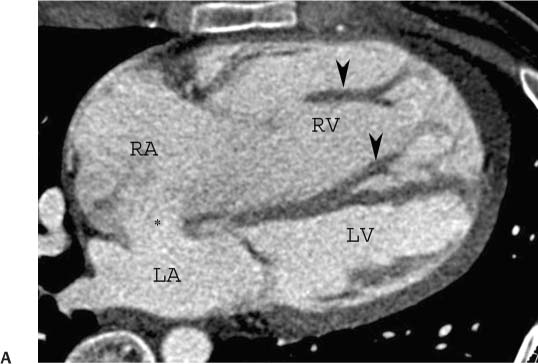
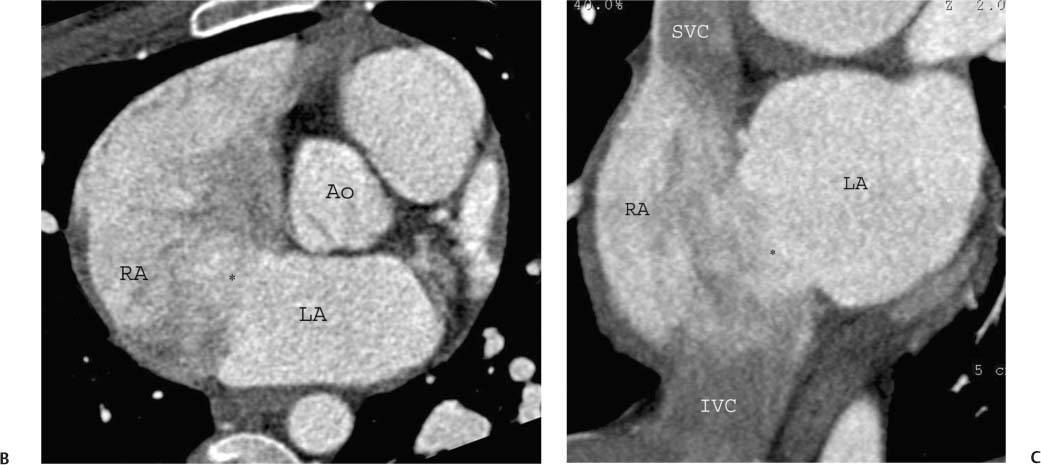
Fig. 9.20 Ostium secundum atrial septal defect (ASD) with right-sided heart enlargement and hypertrophy. (A) Four-chamber view of the heart demonstrates a large atrial septal defect with contrast shunting (*) from the left atrium (LA) to the right atrium (RA). In addition to enlargement of the right side of the heart (RA and right ventricle [RV]), there are prominent trabeculations in the RV (arrowheads) suggesting hypertrophy. (B) Short-axis view again demonstrates dense contrast shunting from the left atrium (LA) to the right atrium (RA). (C) Coronal view through the atria demonstrates a wide communication between the RA and LA (*). The superior vena cava (SVC) and inferior vena cava (IVC) are seen to empty into the RA.
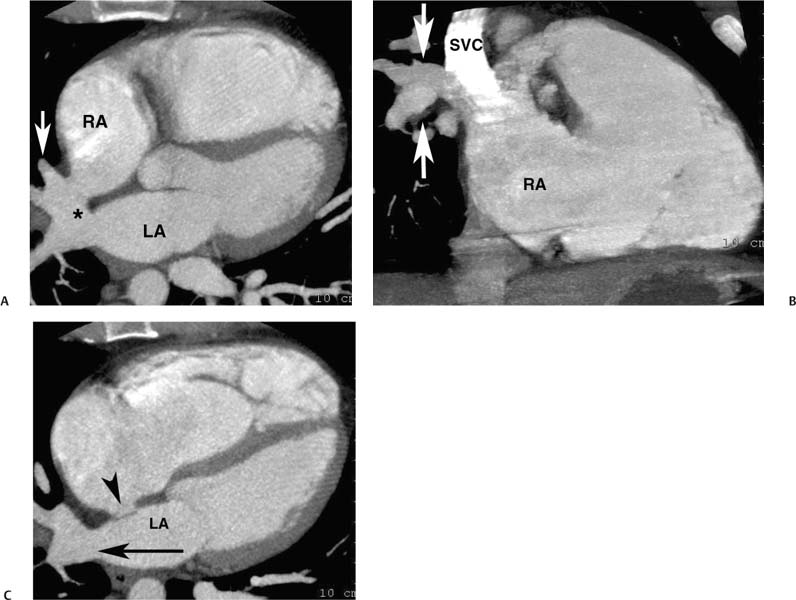
Fig. 9.21 Sinus venosus atrial septal defect (ASD). (A) Five-chamber view demonstrates a high ASD linking the right and left atria (*). The sinus venosus ASD affects the portion of the interatrial septum adjacent to the superior vena cava (SVC) insertion. Several pulmonary veins empty directly into the ASD (arrow). A superior sinus venosus ASD is often associated with anomalous pulmonary venous return. (B) Coronal maximum intensity projection demonstrates a right-sided superior pulmonary vein emptying directly into the superior vena cava. (C) Four-chamber view at a slightly lower level demonstrates an inferior pulmonary vein emptying into the left atrium (arrow). A normal appearance is identified at the level of a closed foramen ovale (arrowhead). The right side of the heart is dilated, secondary to the presence of shunting through the ASD and anomalous pulmonary venous return.
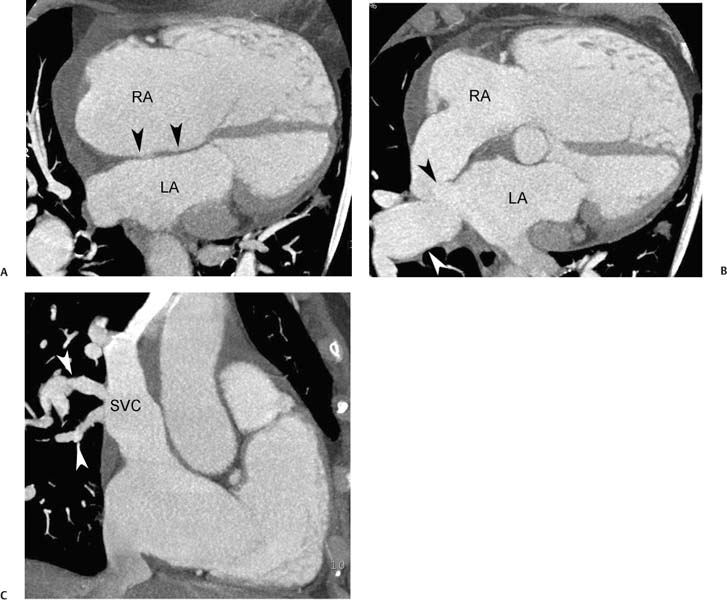
Fig. 9.22 Sinus venosus atrial septal defect (ASD). (A) Four-chamber view demonstrates an intact atrial septum (arrowheads) at the level of the foramen ovale. The left atrium (LA) is normal in size, but the right atrium (RA) is markedly dilated. (B) Five-chamber view demonstrates an ASD in the more superior portion of the atrial septum (black arrowhead) between the LA and RA. A large pulmonary vein (white arrowhead) communicates with both atria at the level of the defect. (C) Oblique coronal maximum intensity projection demonstrates two right-sided superior pulmonary veins (arrowheads) emptying directly into the superior vena cava.
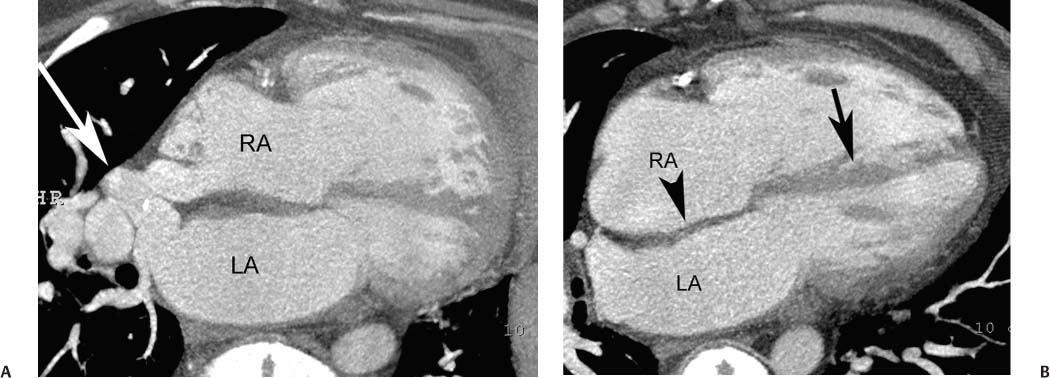
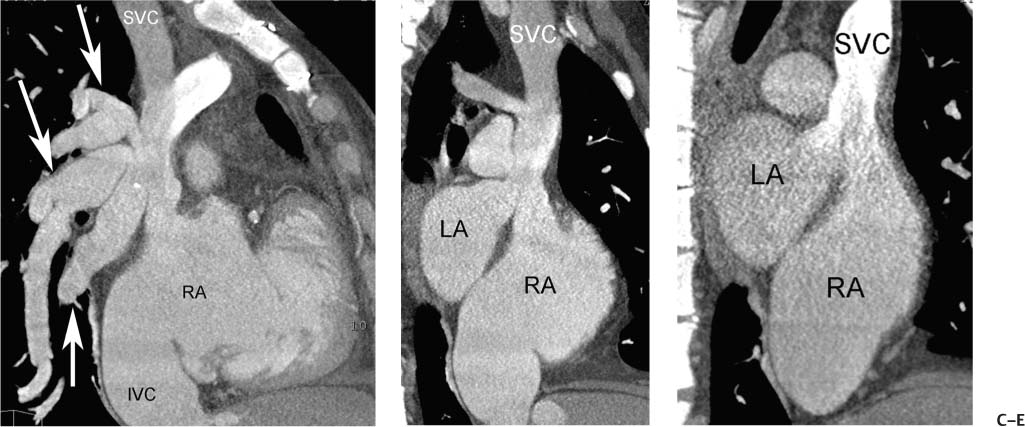
Fig. 9.23 Sinus venosus atrial septal defect (ASD) with pressure or volume overload of the right side of the heart. (A) Four-chamber view at a superior level demonstrates a complex communication between the left atrium (LA) and right atrium (RA) via an overriding vessel (arrow). (B) Four-chamber view at a more caudal level demonstrates bowing of the atrial septum (arrowhead) toward the LA and straightening of the interventricular septum (arrow). (C) Sagittal view demonstrates multiple pulmonary veins (arrows) entering the superior vena cava (SVC). A dilated inferior vena cava (IVC) is also noted. (D) Oblique sagittal view demonstrates that the SVC overrides both the RA and LA at the level of the sinus venosus ASD. (E) Oblique sagittal view during the early venous phase of the study demonstrates contrast from the SVC entering both the RA and the LA. The right-sided heart enlargement, bowing of the atrial septum, flattening of the interventricular septum, and dilated IVC are all indicators of severe right-sided pressure or volume overload.
 Ventricular Septal Defect
Related posts:
Stay updated, free articles. Join our Telegram channel

Full access? Get Clinical Tree


