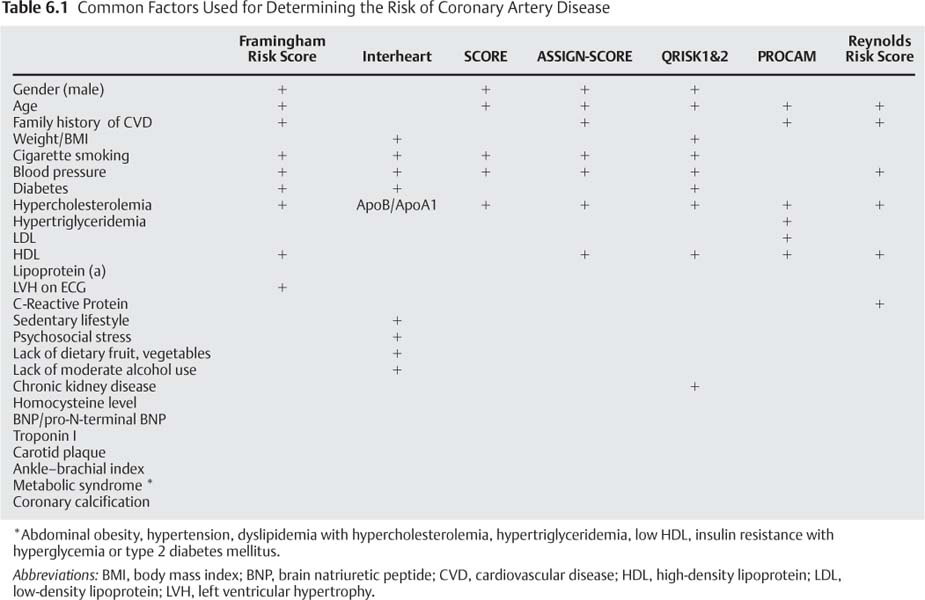
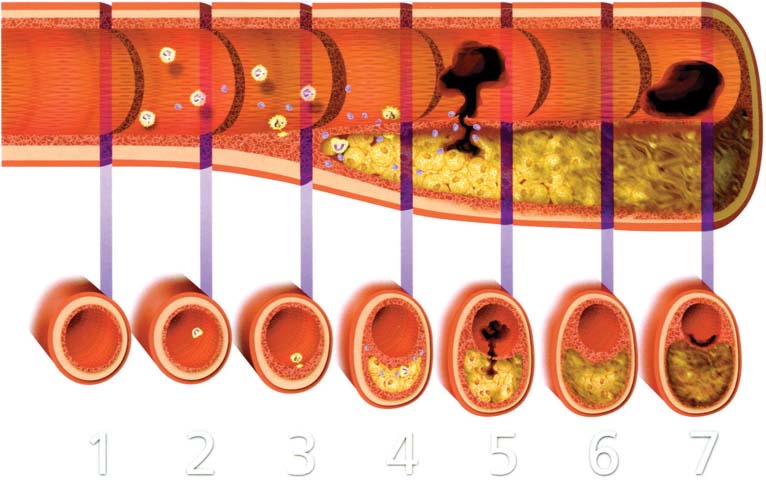
6 Following the introduction of coronary angiography in the 1960s, the diagnosis and treatment of coronary artery disease (CAD) focused on the arterial lumen. Treatments such as bypass surgery and angioplasty relieve ischemia by reducing the severity or impact of coronary artery stenoses while leaving the underlying disease process unchanged. In more recent years therapies for CAD have expanded to include the earlier stages of atherosclerosis, before the development of flow-limiting stenoses. These treatments are directed toward preventing or retarding plaque formation or stabilizing existing plaques. Early medical intervention can lessen the likelihood of plaque rupture and the resulting acute coronary syndromes (ACS), which may manifest as unstable angina or myocardial infarction. Coronary CT angiography (CTA) can demonstrate several important aspects of CAD. Quantification of coronary calcium allows a global assessment of risk, as discussed in detail in Chapter 5. The ability to define the arterial lumen and the arterial wall provides an important noninvasive means of assessing the symptomatic patient with suspected CAD. Combining pharmacologic “stress testing” with coronary CTA expands on this utility. The determination of which patients should receive lifelong preventative treatment can be difficult. The ability of coronary CTA noninvasively to define plaque morphology may lead to more focused strategies. Identification of the so-called vulnerable plaques that are prone to rupture would be an invaluable aid in the prevention of ACS. If these plaques could be accurately identified, targeted interventions could be performed to prevent myocardial infarctions. Atherosclerosis is a chronic, systemic, and multifactorial disease. Risk factors contribute to the initial arterial injury and subsequent response, which leads to atherosclerosis. Hyperlipidemia, especially in the form of an elevated serum low-density lipoprotein (LDL), plays an important role in the development of coronary atherosclerosis and is the most powerful risk factor for the development of CAD. Inflammation also plays a critical role. It has been well demonstrated that C-reactive protein, a marker of systemic inflammation, offers additional independent prognostic information with a predictive value similar to that of LDL.1 The most common risk factors for CAD are summarized in Table 6.1. Many of these factors have been used in scoring systems, such as the Framingham risk score, the Interheart study, and the Reynolds risk score. Risk factor data are combined in these risk scores to calculate a patient’s risk of developing clinically significant CAD. Several additional bio-markers may be relevant in the pathogenesis of CAD but have not been shown to add clinically useful prognostic information beyond the traditional risk factors.2 The progression of atherosclerosis from a clinically insignificant “fatty streak” to a stenotic lesion is not a linear process of plaque deposition over time. Rather, atherosclerosis is a complex systemic arterial disease that can evolve at varying rates and manifest as different stages at different locations within the arterial tree of a single patient. Atherosclerotic plaques differ in their behavior and their clinical manifestations at different points in their life cycle (Fig. 6.1).3 The American Heart Association (AHA) classification of athero-sclerotic lesions4 and a subsequent modification5 are summarized in Tables 6.2 and 6.3. Whereas a detailed description of the pathophysiology of atherosclerosis is beyond the scope of this book, familiarity with the stages of atherosclerosis should help clarify the clinical implications of the radiographic features of this disease. Atherosclerosis begins when normal endothelium is damaged. Sources of endothelial injury include hypercholesterolemia, irritants in cigarette smoke, vasoactive substances, metabolic end products in diabetics, and circulating immunocomplexes. Mechanical stresses such as abnormal flow and increased shear forces may be related to hypertension. The resultant endothelial dysfunction leads to a “response to injury” that evolves into an atherosclerotic plaque. This process can begin as early as the second decade of life.3,6 Fig. 6.1 Stages of development of atherosclerotic plaque. Longitudinal schematic of an artery depicts a timeline beginning with (1) a normal artery. Smooth muscle cells migrate into the intima early in life. (2) Lesion initiation is associated with inflammatory leukocytes and extra-cellular lipid. (3) The fibrofatty stage is characterized by monocytes that transform into macrophages and become lipid-laden foam cells. (4) The inflammatory process continues with matrix degrading proteinases that weaken the fibrous cap. (5) Rupture of the fibrous cap may result in vascular thrombosis. (6) The healing process may result in a fibrous and often calcified plaque. (7) In some cases vascular thrombosis may be related to superficial endothelial erosions rather than to plaque rupture. In this figure the erosion is superimposed on a complex plaque. However, endothelial erosion may occur in the absence of an underlying complex plaque. (Reprinted with permission from Libby P. Current concepts of the pathogenesis of the acute coronary syndromes. Circulation. 2001;104(3):365–72.) Injured endothelium results in production of proteins that attract circulating monocytes, which become incorporated into the arterial wall as tissue macrophages. Oxidized LDLs become incorporated into the intima, binding with proteins and inducing an inflammatory response. More monocytes migrate into the arterial wall, and smooth muscle cells migrate from the media into the intima. These cells transform into lipid-laden foam cells, collections of which create the “fatty streak” of early atherosclerosis. These early atherosclerotic lesions are seen in young people and can regress. Later stages of atherosclerosis cannot regress. Cytokines activate smooth muscle cells and cause extra-cellular protein and matrix deposition and fibrosis. Neovascularization of the intimal plaques arises from the media via the vasa vasorum. Proteins that regulate calcification are expressed by macrophages, smooth muscle cells, and adventitial cells. Microcalcifications can occur in AHA III and IV transitional lesions. Coronary calcification becomes denser with continued fibrosis.4 As atherosclerosis progresses, the involved vessel may enlarge, allowing eccentric plaque growth within the vessel wall without impinging upon the arterial lumen. This process of positive remodeling allows atherosclerosis to evolve without causing a stenosis or any clinical evidence of ischemic disease.7 Such plaques can grow to a significant size, developing a large lipid core with extensive macrophage infiltration and few smooth muscle cells. Eccentric plaque growth and vascular remodeling can result in disruption of the internal elastic lamina and neovascularization. Intraplaque hemorrhage, inflammation, and apoptosis result in softening of the lipid-rich core and weakening of the overlying fibrous cap. Metabolic processes, including enzymatic degradation of the extracellular matrix, apoptosis and inflammation, and physical factors such as wall stress and blood flow both contribute to thinning of the fibrous cap. Macrophages and mast cells present at the shoulder of an eccentric plaque or between the plaque and the adjacent vessel wall participate in the inflammatory process. These are the two sites where plaque rupture most frequently occurs.
Coronary Artery Disease
 Risk Factors for Coronary Artery Disease
 Pathogenesis of Atherosclerosis

Lesion | Description | Thrombosis |
|---|---|---|
Nonatherosclerotic intimal lesions |
|
|
Intimal thickening | The normal accumulation of SMCs in the intima in the absence of lipid or macrophage foam cells | Absent |
Initial xanthoma or fatty streak | Luminal accumulation of foam cells without a necrotic core or fibrous cap. These lesions may regress. | Absent |
Progressive atherosclerotic lesions |
|
|
Pathologic intimal thickening | SMCs in a proteoglycan-rich matrix with areas of extracellular lipid accumulation without necrosis | Absent |
With erosion | Plaque the same as above, with luminal thrombosis | Mostly mural |
Fibrous cap atheroma | Well-formed necrotic core with an overlying fibrous cap | Absent |
With erosion | Plaque the same as above, with luminal thrombosis No communication of thrombus with necrotic core | Mostly mural infrequently occlusive |
Thin fibrous cap atheroma | A thin fibrous cap infiltrated by macrophages and lymphocytes with rare SMCs and an underlying necrotic core | Absent, may have intraplaque hemorrhage |
With plaque rupture | Fibroatheroma with cap disruption; luminal thrombus communicates with the bunderlying necrotic core. | Usually occlusive |
Calcified nodule | Eruptive nodular calcification with underlying fibrocalcific plaque | Usually nonocclusive |
Fibrocalcific plaque | Collagen-rich plaque with significant stenosis, usually contains large areas of calcification with few inflammatory cells; a necrotic core may be present. | Absent |
Modified from Virmani R, Kolodgie FD, Burke AP, Farb A, Schwartz SM. Lessons from sudden coronary death: a comprehensive morphological classification scheme for atherosclerotic lesions. Arterioscler Thromb Vasc Biol. 2000;20:1262–1275.
Abbreviation: SMC, smooth muscle cells.
Different mechanisms of ACS may be associated with different types of plaque (Table 6.3). The most common mechanism for ACS is related to infiltration by inflammatory cells and plaque rupture at a site of fibrous cap thinning as described above. Several characteristics make a plaque more likely to rupture. In most cases the fibrous cap overlying the lipid core has thinned to less than 65 μm; these plaques are characterized as a thin-cap fibroatheroma (TCFA).
A less common mechanism of ACS is related to a small, nonulcerated erosion of the endothelium that generates a platelet-rich mural thrombus. The thrombus that covers the denuded endothelium is most commonly nonocclusive and often asymptomatic. The aggregate of many of these events throughout the coronary tree results in asymptomatic progression of CAD. However, approximately one third of occlusive thrombi within the coronary arteries occur at a site of endothelial erosion without rupture into a lipid core.8 The least common mechanism for coronary thrombosis is related to eruptive nodular calcification with underlying fibrocalcific plaque. In this scenario, the unstable plaque responsible for ACS may be calcified.
 “Vulnerable” Plaque
The precursor of a ruptured plaque is known as a vulnerable plaque. If these vulnerable plaques could be reliably identified before rupture, targeted therapy could be applied to prevent acute coronary events. This simple construct is attractive, but unfortunately it is not currently possible to classify a plaque accurately as stable or vulnerable.
Most plaque ruptures occur in TCFAs. Plaque rupture often occurs in large plaques that are not associated with obstructive coronary disease. These lesions often demonstrate positive remodeling and serve as the nidus for occlusive thrombus. There is a systemic component to CAD; patients with an ACS often have two or more TCFA lesions scattered throughout the coronary artery tree. Therefore, although the presence of TCFAs increases the risk of a clinical event, it is not possible to predict whether an individual TCFA will, within a specified time frame, rupture and become the cause of an acute coronary event.
The heterogeneity of plaque morphologies that presage clinical events complicates the radiographic identification of the vulnerable plaque. TCFA is not the only morphology that leads to acute coronary artery occlusion. Occlusive, platelet-rich intracoronary thrombosis can form on the eroded surface of a plaque without frank rupture. Identification of plaque characteristics that are associated with an increased risk of a clinically relevant coronary event may warrant more aggressive risk factor modification. However, there is no clearly defined morphology or characteristic that can distinguish a stable plaque from a vulnerable plaque with enough accuracy to be immediately predictive of an acute coronary event.
 Consequences of Coronary Atherosclerosis
The progression of CAD can manifest in many ways. Atherosclerosis can develop slowly over years as a series of nonclinically significant steps, or it may present suddenly in a young patient as an acute coronary occlusion of a previously nonstenotic plaque. Furthermore, there is a wide range of how people feel angina; some patients experience typical angina when a coronary stenosis limits the blood flow, whereas others have atypical or no symptoms despite myocardial ischemia. These factors, among others, are responsible for the wide range of clinical presentations of CAD.
The clinical consequences of endothelial disruption depend largely on the extent of thrombus that develops. A small disruption of the intima may be covered by a platelet-rich thrombus, which may not cause any limitation of blood flow. Such an intimal disruption can be a clinically silent event that contributes incrementally to the existing coronary stenosis. Factors that affect thrombus formation include the degree of pre-existing stenosis and the thrombogenicity of the plaque. The lipid-rich core of large eccentric plaques is the most thrombogenic substrate in the coronary circulation, and the rupture of this type of plaque is the most frequent cause of ACS. Hypercoagulable states caused by cigarette smoke, elevated LDL levels, catecholamines, or metabolic syndrome also promote thrombus formation.3,5,6,9 The stenosis caused by the plaque itself (without the overlying thrombus) is often not hemodynamically significant, but the abrupt thrombotic occlusion can cause acute ST elevation or non-ST elevation myocardial infarction or unstable angina.
The factors that determine the clinical course of a plaque rupture include the acuity of the occlusion, the size and distribution of the affected artery, the presence or absence of collaterals, the status of the other coronary arteries, and the underlying ventricular function. Secondary events such as arrhythmias or mechanical complications of an infarction (eg, ventricular septal defect, acute mitral regurgitation secondary to papillary muscle dysfunction or free wall rupture) can also affect the clinical course.
The process of acute plaque rupture with secondary thrombosis explains how a patient can suffer a myocardial infarction shortly after a negative stress test, and more broadly explains why screening tests for CAD based on luminal stenoses has been a disappointing strategy overall. However, the long preclinical phase of atherosclerotic CAD does provide opportunity for early diagnosis and treatment with aggressive risk factor modification. Statins and angiotensin-converting enzyme inhibitors have been demonstrated to decrease cardiac events in prevention trials. The mechanism of action appears to be plaque stabilization and suppression of inflammation rather than regression of stenosis.10
 CT Angiographic Assessment of Coronary Artery Disease: Stenosis
CTA is an excellent tool for visualization of both calcified and noncalcified plaque and for the assessment of coronary stenosis. Because CTA obtains a volumetric data set, vessels can be visualized in any desired orientation. Each coronary segment can be rotated into an optimal orientation to visualize the vessel lumen and plaque (Figs. 6.2 and 6.3).
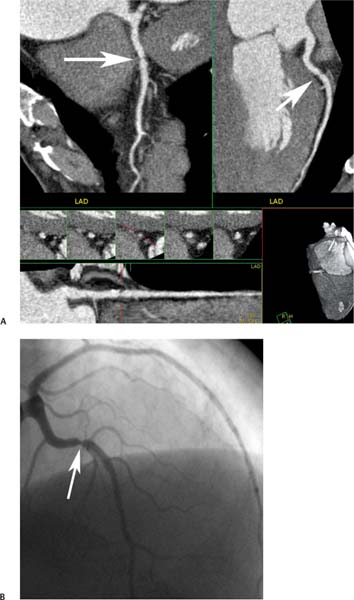
Fig. 6.2 Multiple projections demonstrate a focal stenosis in the left anterior descending artery (LAD) with coronary CT angiography. (A) Orthogonal curved maximum intensity projections demonstrate a bandlike stenosis in the proximal LAD (arrows). The straightened lumen view also demonstrates focal stenosis related to noncalcified plaque at this level. Cross-sectional images of the LAD at the level of the stenosis confirm a 70 to 80% narrowing. (B) Conventional coronary arteriography confirms a 70 to 80% narrowing of the LAD (arrow).
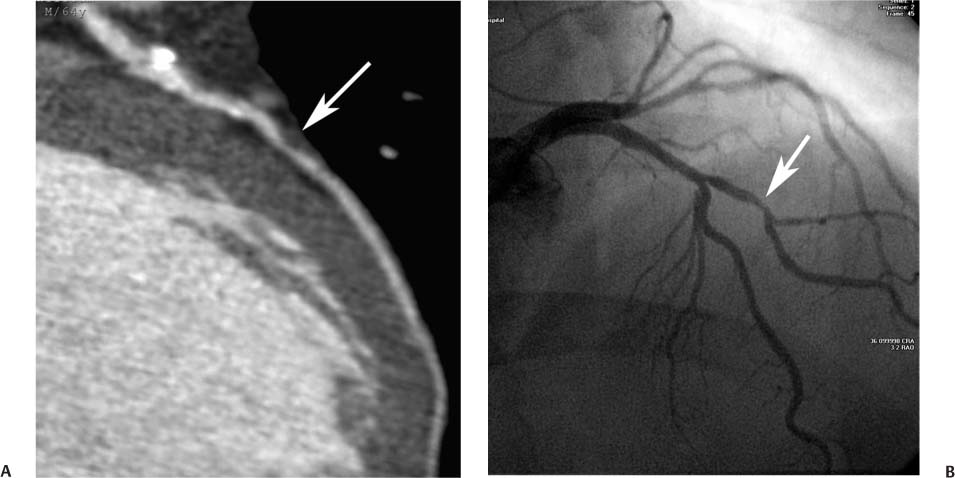
Fig. 6.3 Maximum intensity projection (MIP) image rotated to demonstrate optimally moderate stenosis in a first diagonal branch. (A) Slab MIP image through the proximal left anterior descending artery (LAD) and extending into the first diagonal branch demonstrates calcified atherosclerotic disease in the proximal portion of the vessel with positive remodeling. Focal noncalcified plaque in the proximal first diagonal branch results in moderate stenosis of 50 to 70% (arrow). (B) Conventional arteriography confirms the CT angiographic findings, again demonstrating focal stenosis in the diagonal branch. Because the plaque can be rotated so that it is clearly defined adjacent to the luminal narrowing on CT, the severity of the disease is more easily appreciated by CT angiography compared with conventional arteriography.
Maximum intensity projection (MIP) images provide the most useful technique to assess for vascular stenosis. In the setting of positive remodeling, vessels with calcified plaque can be rotated so that the calcified plaque projects beyond the expected lumen of the vessel (Figs. 6.4, 6.5, 6.6, 6.7, 6.8, 6.9, and 6.10). Small calcified plaques are generally easy to assess with simple MIP rendering. Vessel tracking tools may be useful in the assessment of more diseased vessels (Figs. 6.7, 6.8, 6.9, and 6.10). Vessel tracking provides straightened lumen and cross-sectional views through the artery that may be useful for assessment of circumferential plaque. A complete discussion of different rendering and display techniques is included in Chapter 2.
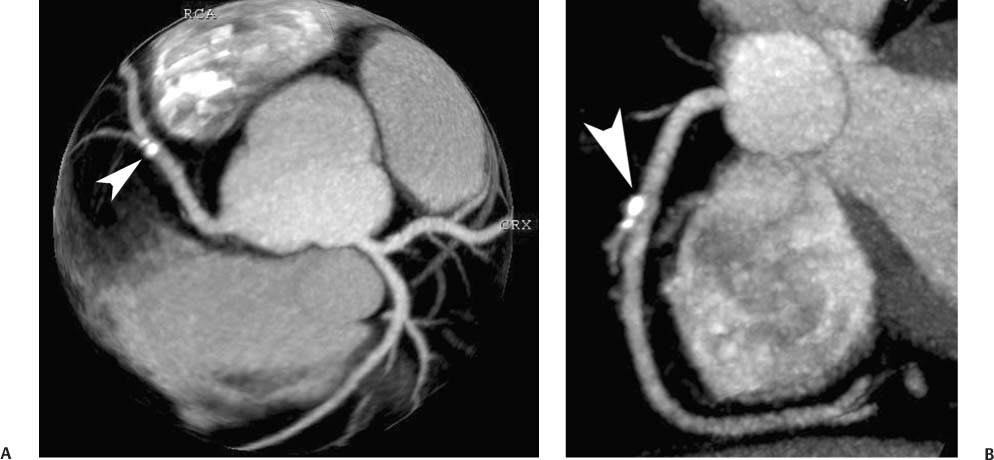
Fig. 6.4 Calcified atherosclerotic plaque in the right coronary artery (RCA) with positive remodeling. (A) Globe maximum intensity projection (MIP) demonstrates a focal calcified plaque overlying the proximal RCA (arrowhead). The plaque appears to involve the vessel lumen in this view. (B) Slab MIP projection of the RCA in a left anterior oblique projection demonstrates that the calcified plaque is mostly outside the lumen of the RCA (arrowhead) and is diagnostic of positive remodeling with no significant stenosis.
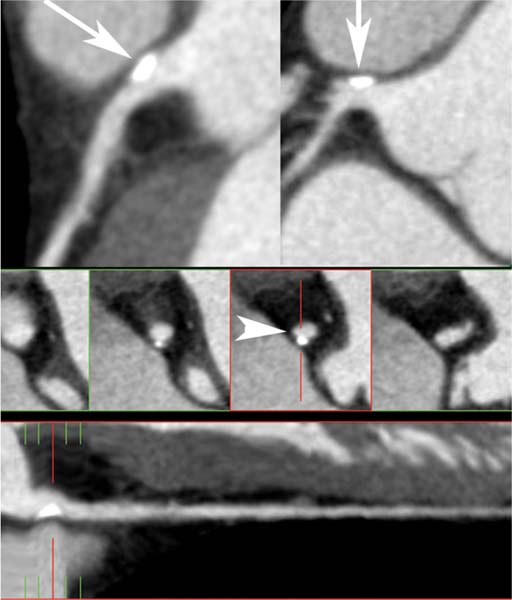
Fig. 6.5 Calcified plaque in the left main coronary artery with positive remodeling. Slab maximum intensity projections (MIPs) of the left main coronary artery (two top images) demonstrate eccentrically located calcified plaque without narrowing of the lumen (arrows). A straightened lumen MIP projection at the bottom of the image confirms the eccentric location of the plaque. Cross-sectional images through the left main coronary artery demonstrate that the calcified plaque is extruded from the vessel lumen (arrowhead), diagnostic of positive remodeling. There is no associated stenosis of the lumen.
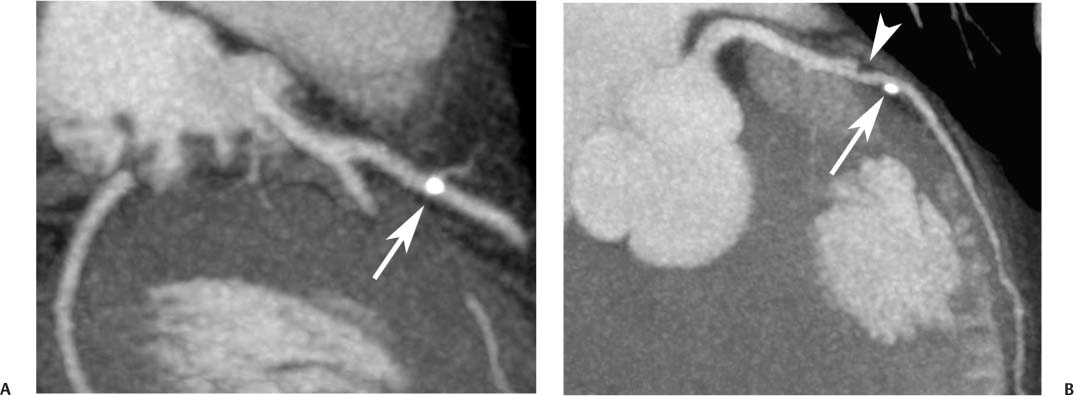
Fig. 6.6 Noncalcified and calcified plaque in the proximal left anterior descending artery (LAD) without significant narrowing. (A) Slab maximum intensity projection (MIP) demonstrates calcified plaque in the proximal LAD overlying the vessel lumen (arrow). (B) Slab MIP in a different projection demonstrates that the calcified plaque is eccentric with positive remodeling (arrow). Just proximal to this calcified plaque, there is noncalcified plaque (arrowhead) that was not visible in (A). Noncalcified and calcified plaque in the proximal left anterior descending artery (LAD) without significant narrowing. (C) Orthogonal curved MIP images demonstrate both noncalcified and calcified plaques with less than 50% luminal narrowing. At the bottom of the figure, the straightened lumen view and associated cross-sectional images through the LAD demonstrate positive remodeling of the calcified LAD plaque.
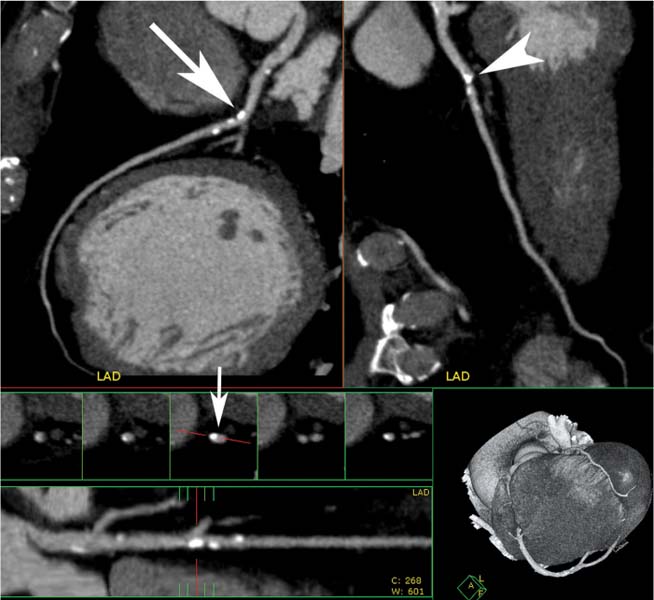
Fig. 6.7 Calcified plaque in the proximal left anterior descending artery (LAD) with positive remodeling. Orthogonal curved maximum intensity projections of the LAD. Although the calcified plaque appears to overlie the vessel in one view (arrowhead), it is clearly eccentric on the second view (arrow). The straightened lumen view and associated cross-sectional images through the vessel demonstrate positive remodeling with extrusion of the calcium beyond the vessel lumen (small arrow).
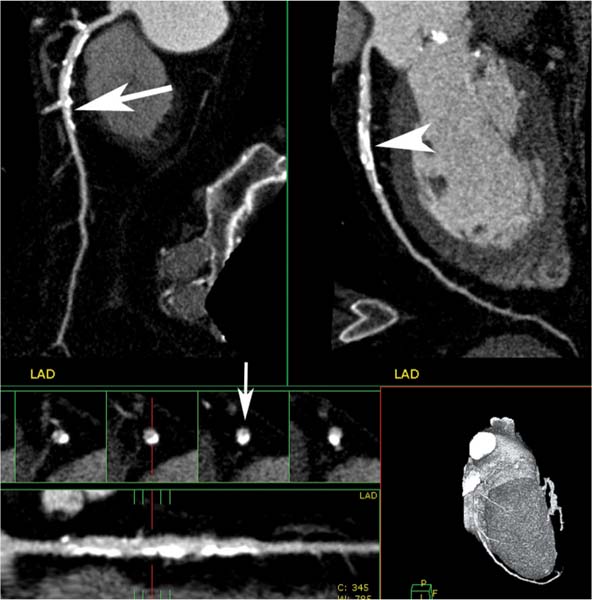
Fig. 6.8 Calcified atherosclerotic plaque in the proximal to the mid-left anterior descending artery (LAD) with less than 50% diameter reduction. Orthogonal curved MIP projections of the LAD demonstrate moderate calcification in the proximal to midportion of the vessel. Although the calcified plaque appears to cause greater than 50% luminal narrowing on one projection (arrowhead), only mild narrowing is observed on the second projection (arrow). The straightened lumen view and cross-sectional images of the LAD suggest an approximate 50% diameter narrowing with positive remodeling (small arrow). The degree of narrowing associated with densely calcified plaque is often overestimated because the extent of the calcium is exaggerated by blooming artifact.
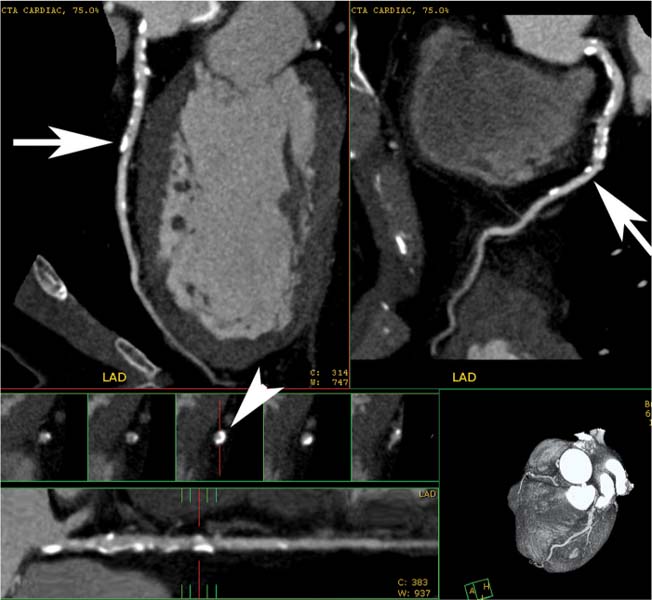
Fig. 6.9 Calcified left main and proximal left anterior descending (LAD) arteries with less than 50% narrowing. Orthogonal curved maximum intensity projection (MIP) images of the LAD demonstrate mild diffuse calcified plaque in the proximal to midportion of the LAD (arrows). Cross-sectional images through the LAD at the level of the arrows demonstrate that some of the calcium is circumferential, but the degree of vessel narrowing is less than 50% (arrowhead). The circumferential nature of the calcified plaque is not appreciated on the orthogonal MIP views because each thin orthogonal MIP image includes the calcification along only one side of the vessel wall.
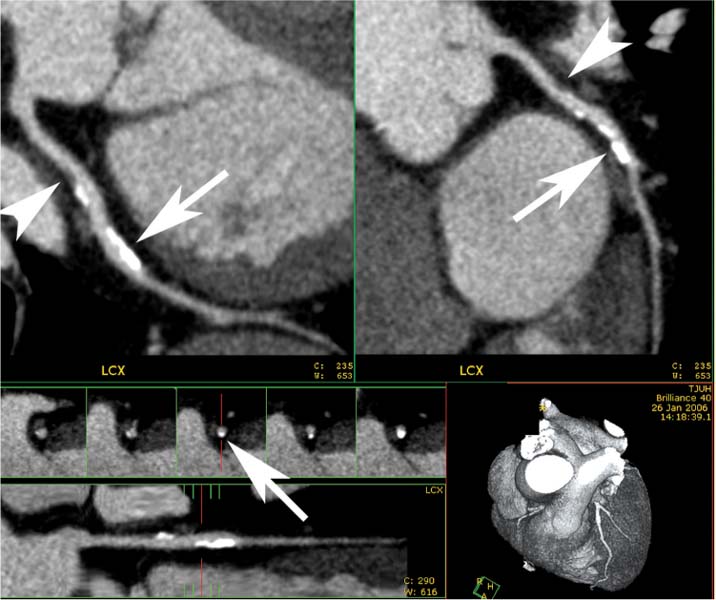
Fig. 6.10 Noncalcified and calcified plaque in the proximal to mid-circumflex artery with mild stenosis. Orthogonal curved maximum intensity projection (MIP) images at the top of the figure demonstrate noncalcified (arrowheads) and calcified (arrows) plaque in the proximal to mid-circumflex artery with less than 50% luminal narrowing. There is no remodeling associated with the noncalcified plaque, but there is positive remodeling associated with the calcified plaque. The straightened lumen and cross-sectional views at the bottom of the figure confirm that the degree of narrowing is less than 50%. LCX, left circumflex artery.
In the setting of extensive coronary calcification, the underlying lumen is often obscured. Calcium in the arterial wall creates blooming artifact, which limits assessment of the adjacent lumen in the presence of stenosis (Figs. 6.11, 6.12, and 6.13) and may result in a false-positive diagnosis in the absence of stenosis (Fig. 6.14). In the presence of heavy coronary calcification, the diagnosis of significant coronary disease can sometimes be suggested on the basis of an adjacent noncalcified vascular segment (Fig. 6.15). Although the density of calcium may be similar to that of adjacent contrast media in the arterial lumen, use of wide window settings may be helpful to distinguish calcium from contrast material. Careful evaluation of CTA images with wide window settings using MIP and vessel tracking techniques allows accurate diagnosis of obstructive disease in greater than 90% of small and moderate-sized calcified coronary artery plaques.11 Nonetheless, a calcium score above 1000 is frequently associated with reduced image quality and decreased accuracy in the assessment of coronary stenosis.12
Arterial size is another important issue that can limit the CTA evaluation of stenoses. The sensitivity for detection of stenosis is clearly superior in proximal arterial segments compared with more distal segments.13 The left anterior descending and circumflex arteries may measure 3 to 4 mm in diameter proximally and then taper in caliber distally. Evaluation of diagonal and obtuse marginal branches may also be limited by their small caliber (Fig. 6.16). As arterial size decreases below 1 mm, the effect of volume averaging increases, thereby reducing vascular conspicuity and decreasing diagnostic accuracy. The right coronary artery does not taper significantly to the level of the posterior descending artery. However, the midportion of the right coronary artery is the most rapidly moving segment within the coronary tree and has the highest rate of nondiagnostic images attributable to motion artifact.
Related posts:
Stay updated, free articles. Join our Telegram channel

Full access? Get Clinical Tree


