BASIC RADIOLOGIC ANATOMY OF THE CHEST
In order to identify pathologic changes in the chest, it is important to understand the radiologic anatomy. Since chest radiography and CT are the primary modalities for imaging the chest, these will be depicted in Figs. 4.1 to 4.6. While the heart and lungs are the dominant structures in the chest, it is important to remember that many other important structures are depicted on radiographs and CT scans of the chest, such as the great vessels, esophagus, tracheobronchial tree, rib cage, etc. Many of these structures are contained within the mediastinum. For practical purposes, it is useful to compartmentalize the mediastinum as described by Felson [1]. The anterior and middle mediastinum are divided on the lateral chest radiograph by a line extending along the anterior tracheal border and inferiorly along the posterior border of the heart. The middle and posterior mediastinum are separated by a line 1 cm posterior to the anterior margin of the thoracic vertebral bodies. While this differs from traditional anatomic boundaries, it proves useful radiographically.
Fig. 4.1.
Normal PA view of the chest. This is a female patient (note the breast shadows). White arrowheads denote the right paratracheal stripe. This is normally 4 mm or less in thickness. The white arrow annotates the aortic knob, which is created by the aortic arch being seen somewhat en face, slightly oblique. The black arrow denotes the AP window. The hilar angles are demarcated bilaterally by the black arrowheads, and are normally concave as in this patient. The right heart border (mostly the right atrium) is border forming with the right middle lobe, and the left heart border (mostly the left ventricle) is border forming with the lingula.
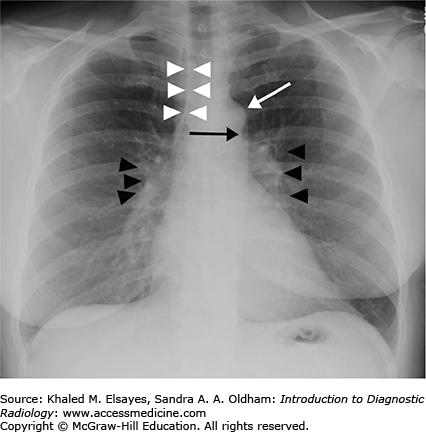
Fig. 4.2.
Normal PA view of the chest. This is the same study as Figs. 4.1; however, the window and level settings have been adjusted to allow for improved visualization of the mediastinal borders. Black arrowheads annotate the lateral border of the descending aorta. Black arrows demarcate the left paraspinal stripe. White arrowheads demonstrate the anterior junction line, formed where the pleura of the right and left lungs appose anteriorly. Finally, the azygoesophageal recess is marked by white arrows, formed by the interface of the right lower lobe with the esophagus and azygous vein. Please note the importance of altering window/level settings in order to maximize visualization of normal anatomic structures and therefore pathology as well.

Fig. 4.3.
Normal lateral chest radiograph. RS denotes the retrosternal clear space. An opacity in this region would suggest an anterior mediastinal mass. Black arrowheads mark the posterior wall of the trachea. Thin black arrows denote the posterior wall of the bronchus intermedius, and white arrowheads outline the right main bronchus, which is seen en face on the lateral projection. Thick white arrows demonstrate the posterior border of the left atrium, and thin white arrows annotate the posterior border of the IVC. Note how the vertebral bodies become more lucent inferiorly; loss of this lucency is a useful sign when assessing for a retrocardiac opacity.
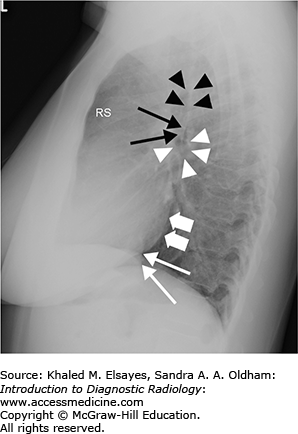
Fig. 4.4.
(A) Axial CT section through the upper chest with accompanying illustration. RL = right lung, LL = left lung. (B) Axial CT section through the pulmonary artery with accompanying illustration. A = ascending aorta, D = descending aorta, RPA = right pulmonary artery, LPA = left pulmonary artery. (C) Axial section through the heart with accompanying illustration. LV = left ventricle, RV = right ventricle, RA = right atrium, LA = left atrium, D = descending aorta.
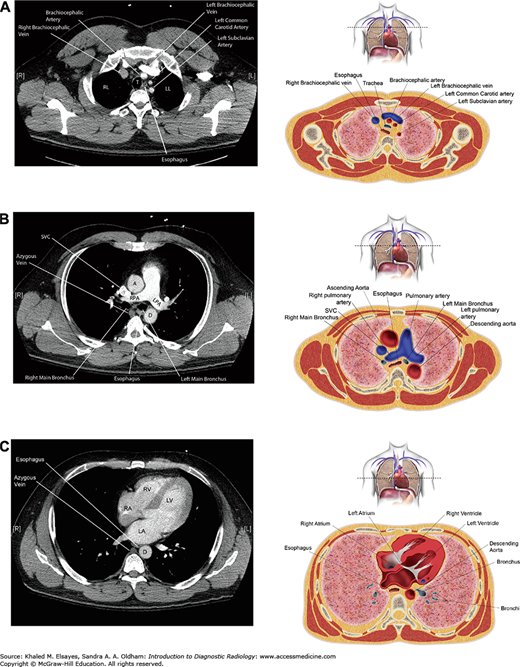
Fig. 4.5.
Representative axial CT sections in lung windows, superior to inferior. (A) Axial section through the apices. Note the bilateral dependent hazy opacity (white arrowheads). This is due to areas of subsegmental or discoid atelectasis, and is seen commonly. If the patient were scanned in the prone position rather than supine, then this would be seen in the ventral aspect of the lungs. (B) Axial section just below the carina demonstrates the right and left main bronchi (black arrows). (C) Axial section slightly inferior to (B) demonstrates the posterior wall of the bronchus intermedius (white arrow). (D) Axial section through the lung bases again demonstrates bilateral dependent atelectasis (white arrowheads). This is seen nearly ubiquitously at the lung bases.
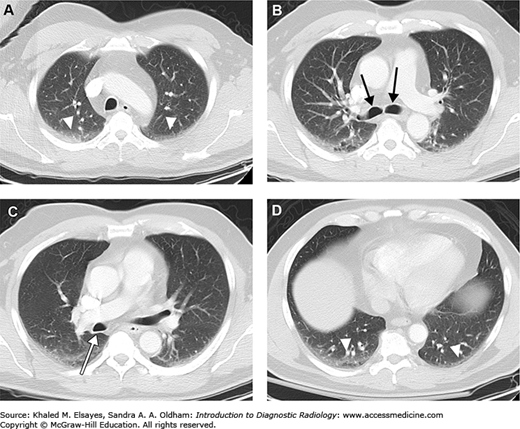
Fig. 4.6.
Additional axial CT sections, different patient. (A) Axial section just below the carina demonstrates the anterior junction line (white arrow). (B) Axial section slightly lower than (A) in soft tissue windows demonstrates the azygos vein (black arrow), esophagus (white arrowhead), and the azygoesophageal recess (white arrow). (C) Lung windows better demonstrate the lung-mediastinum interface (white arrow), which creates the azygoesophageal recess on chest x-rays.
The right lung is divided into upper, middle, and lower lobes by pleural reflections known as fissures (Fig. 4.7). The major fissure is obliquely oriented from superior to inferior, and divides the right lower lobe posteroinferiorly from the upper and middle lobes anterosuperiorly. The minor fissure is horizontally oriented and divides the right upper and middle lobes. Each lobe is divided into segments based on bronchovascular supply. The right upper lobe is divided into apical, anterior, and posterior segments. The right middle lobe is divided into medial and lateral segments. The right lower lobe is divided into a superior segment and 4 basal segments (medial, anterior, lateral, and posterior). The left upper lobe is divided into the apicoposterior segment and anterior segment. The lingua is divided into superior and inferior segments. The left lower lobe consists of a superior segment, but only contains three basal segments instead of four (anterior, lateral, and posterior).

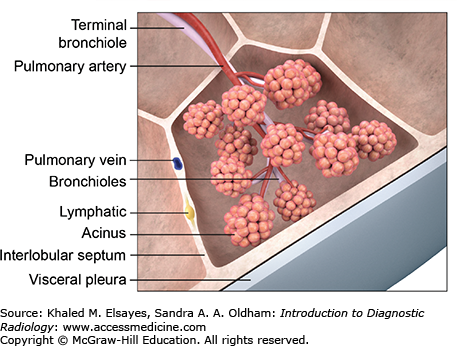
The smallest functional unit of the lung is known as the secondary pulmonary lobule (Fig. 4.8). Each lobule is demarcated by interlobular septae, which contain lymphatics and pulmonary veins. Interlobular septae are not normally visible on radiographs, and only occasionally faintly seen on HRCT. When they become visible, it is usually because they are diseased. The lobule is supplied centrally by a terminal bronchiole and accompanying centrilobular pulmonary artery, which are together known as the bronchovascular bundle. A second set of lymphatics also runs with the bronchovascular bundle.
B. Chest Roentgenology. WB Saunders, PA; 1973.
CASE 1: PNEUMONIA
A 50-year-old female presents with fever, cough, and chest pain.
Pneumonia
Chest x-ray, preferably PA and lateral views (Figs. C1.1–C1.5)
Fig. C1.1
Necrotizing right middle lobe pneumonia. (A) Initial frontal chest radiograph demonstrates a hazy opacity bordered by the minor fissure superiorly, indicating right middle lobe location (white circle). There is a rounded lucency within this opacity (black arrow). (B, C) PA and lateral views obtained 24 hours later show worsening right middle lobe opacity (white circle). The rounded lucency is more well defined (black arrow). (D) Chest CT in lung windows performed at the same time as (B) and (C) demonstrates focal consolidation within the right middle lobe (white arrow) with an area of lucency consistent with necrosis, more apparent than on the chest x-rays (black arrow). Necrotizing pneumonias may be caused by Staphylococcus aureus, Klebsiella pneumoniae, as well as anaerobic organisms (often when due to aspiration). Fungal organisms should also be considered in the appropriate clinical setting. Occasionally, it may be difficult to differentiate necrotizing pneumonia from a cavitary malignancy. In necrotizing pneumonia, there is typically a larger area of surrounding pulmonary consolidation. Also, cavities resulting from malignancy typically have more nodular walls.
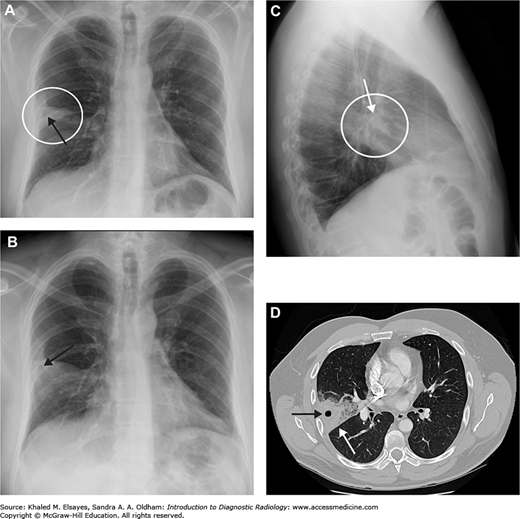
Fig. C1.2
Pneumonia. (A) Portable AP chest radiograph demonstrates a hazy right lower lung opacity (white circle) and a retrocardiac opacity that partially obscures the left hemidiaphragm (black arrows). The patient is intubated and there is a nasogastric tube. (B) Axial chest CT in lung windows demonstrates bilateral dependent consolidation, right worse than left (black arrowheads). Note the air bronchograms (black arrow). (C) Same study as B, now in soft tissue windows. Note how the consolidated lung does not enhance. If this were atelectasis, the lung would demonstrate enhancement.
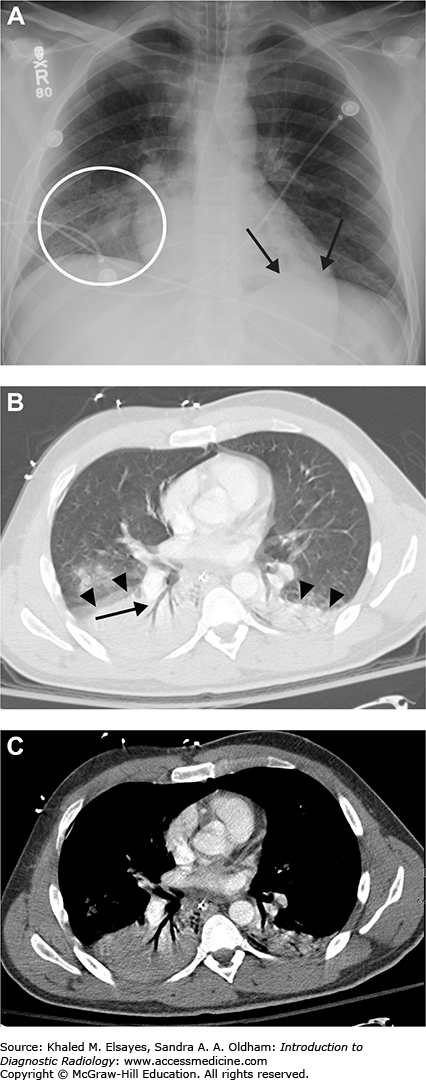
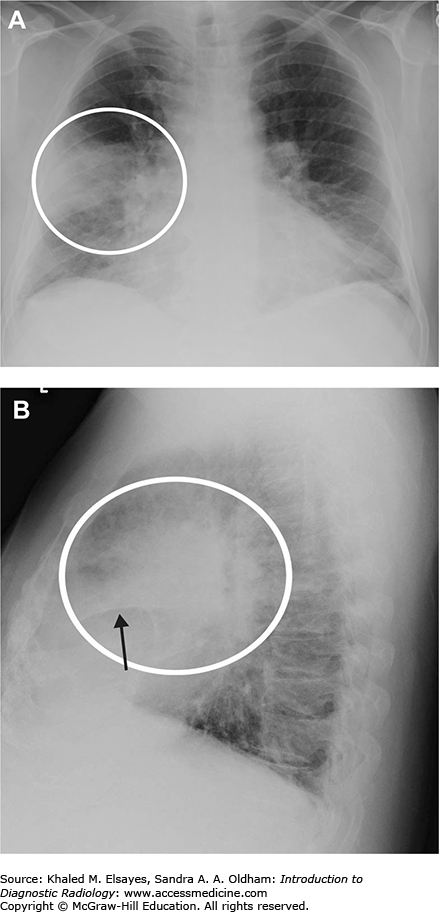
Fig. C1.4
Right upper and lower lobe pneumonia. (A) Initial AP chest radiograph demonstrates airspace opacity in the right lower lung zone (white circle) bordered by the minor fissure superiorly (white arrow), indicating right middle lobe consolidation. (B) Lateral scout from CT scan obtained the same day demonstrates right middle lobe consolidation (black arrows). There are also multiple air bronchograms seen posteriorly (white arrows), suggesting right lower lobe consolidation as well. (C) Sagittal reformatted CT in lung windows demonstrates right middle and lower lobe consolidation. Blood cultures were positive for Streptococcus pneumoniae. The patient was HIV positive.
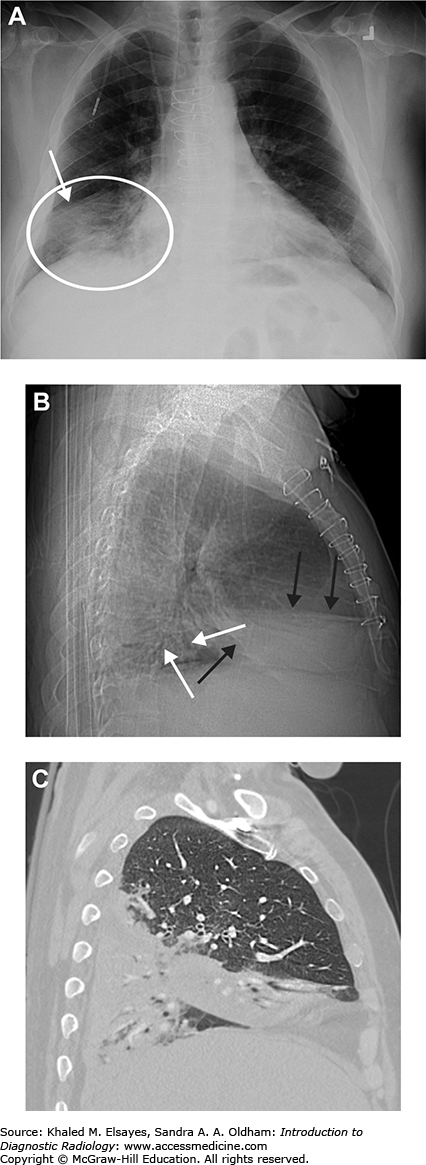
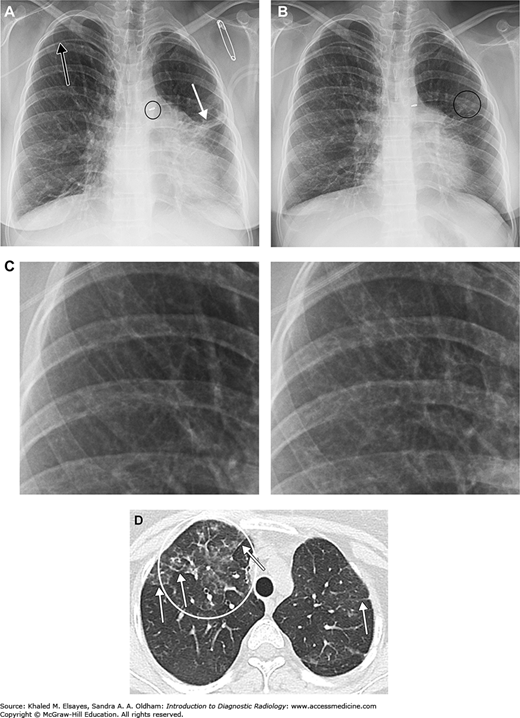
Fig. C1.5
CMV pneumonia. The patient is a 22-year-old female with congenital heart disease, common variable immunodeficiency, being treated for Burkitt’ lymphoma. (A) Baseline frontal chest x-ray demonstrates a right upper extremity PICC (black arrow), PDA ligation clip (black circle), and some scarring in the left lung, probably from prior infections in this immunocompromised patient (white arrow). (B) Several months later the patient presented with fever and cough. Chest x-ray demonstrates subtly increased reticular opacities throughout most of the right lung. Faint nodular opacities in the left lung are annotated as well (black circle). (C) Magnified view of a portion of the right upper lung with baseline image on the left and admission chest x-ray on the right. Although subtle, note the increased linear densities in the right image. (D) Axial chest CT demonstrates patchy ground glass opacities in the right upper lobe (white circle). Compare this to the denser consolidation seen in Figs. C1.2 and C1.4. White arrows indicate examples of reticular opacities. Bronchoalveolar lavage was performed, and CMV was isolated.
Classic inhalationally acquired pneumonias follow one of several radiographic patterns: a lobar pattern, lobular or bronchopneumonia pattern, or an interstitial pattern. Lobar pneumonias are due to filling of distal airspaces with a fibrinopurulent exudate. Radiographically, they manifest as airspace opacities that are largely confined to one lobe and often demonstrate “air bronchograms,” which are branching patent airways seen against a background of opacified airspaces. These airspace opacities are often described as fluffy, hazy, or consolidative opacities. Lobar pneumonias are most often due to bacterial infections, and Streptococcus pneumoniae is a typical organism. There is little, if any, volume loss, and there may even be volume expansion manifest by bulging fissures, especially in Klebsiella infections. A lobular or bronchopneumonia pattern is due to patchy consolidation of the lung and is typically caused by bacterial infection, for example Staphylococcus aureus. There is considerable overlap between lobar and bronchopneumonia patterns, as the patchy opacities seen in a bronchopneumonia may progress and become confluent, thus resembling a lobar pneumonia. Also, the same organism may cause a bronchopneumonia pattern in one individual, and a lobar pattern in another. The “silhouette sign” is a useful sign to localize an area of consolidation. The premise of the silhouette sign is that when two structures of similar densities are abutting each other, the border between them is not visible on a radiograph. The diaphragmatic and cardiomediastinal borders on a chest x-ray are visible because the mediastinum and diaphragm are of soft tissue density (approximately the same as water), and are outlined by the lungs, which are of primarily air density. When the portion of lung in contact with one of these borders becomes diseased (eg, with pneumonia, edema, hemorrhage, etc, which are all similar to water density), then that border becomes obscured, or “silhouetted.” For instance, the right heart border on a frontal view of the chest is mostly bordered by the middle lobe (RML). Therefore, obscuration of the right heart border often signifies disease in the RML. The left heart border is often obscured by disease in the lingula, the right border of the ascending aorta is often obliterated by RUL anterior segment disease, disease silhouetting the diaphragm is in either the right or the left lower lobe, and disease obliterating the left border of the aortic knob localizes to the LUL apicoposterior segment.
Aspiration pneumonitis and pneumonia are distinct clinicopathologic entities that bear discussion as well. Aspiration events will vary in distribution depending on the position of the patient at the time of aspiration. If aspiration occurs in the supine position, the gravity-dependent portions of the lungs are the superior segments of the lower lobes and the posterior segments of the upper lobes. In the upright position, the right middle lobe and basilar segments of the lower lobes are affected. In general, the right lung is affected more due to the more vertical orientation of the right main bronchus. Aspiration pneumonitis is most often the result of aspirating sterile but acidic gastric contents, and is also known as Mendelson’ syndrome. Aspiration pneumonia results when oropharyngeal secretions colonized by microorganisms are aspirated. Radiographically, it is not often possible to differentiate the two. Sterile pneumonitis may clear more rapidly and without antibiotic therapy, while aspiration pneumonia may progress to necrosis, cavitation, and abscess formation. Severe acute aspiration events may cause severe lung injury and can lead to ARDS.
Interstitial patterns are usually caused by atypical bacteria (ie, Mycoplasma pneumoniae), or viral infections (such as influenza, RSV, adenovirus, HSV, varicella, etc). They are characterized pathologically by an inflammatory infiltrate primarily confined to the interstitium of the lung and the walls of the alveoli, without dense filling of the alveolar airspaces. There may be obstruction of small airways due to the inflammation, resulting in areas of resorptive atelectasis. Radiographically, interstitial opacities are often described as reticular (consisting of predominantly linear densities), nodular (predominantly small rounded opacities), or reticulonodular (a combination of both). At CT, these findings may be easier to appreciate, and subtle cases may only be visible with CT. Additionally, CT often demonstrates “ground glass” opacities, which are not as dense as frank consolidation and have a hazier appearance. Pathologically, these opacities represent partial filling or collapse of alveolar airspaces, as well as infiltration of the interstitium below the resolution of CT.
COPD exacerbation, aspiration, myocardial infarction, pulmonary embolism
Airspace opacities are most often due to pneumonia, edema, contusion, or hemorrhage. Clinical information is often required to distinguish between these entities. Atelectasis may also mimic airspace opacity, although evidence of volume loss is often present, and can aid in the diagnosis. The differential diagnosis of cavitary pneumonias includes fungal infection, tuberculosis, and malignancy.
B. Chest Roentgenology. WB Saunders, PA; 1973.
PE. Aspiration pneumonitis and aspiration pneumonia. N Engl J Med. 2001;344:665-–671.
[PubMed: 11228282]
CASE 2: PLEURAL EFFUSION
Progressive shortness of breath over the past several days to weeks. On exam, there are decreased breath sounds at the right lung base.
Pleural effusion (Figs. C2.1–C2.4)
Fig. C2.1
Small pleural effusion. (A) PA view of the chest demonstrates sharp lateral costophrenic angles, no evidence of pleural effusion. The cardiac silhouette is enlarged, and there is an AICD/pacemaker. (B) Lateral view demonstrates blunting of the posterior costophrenic angles, indicating small bilateral pleural effusions (black arrows). On the lateral view, the right hemidiaphragm can be followed anteriorly, while the left hemidiaphragm will be silhouetted by the heart and will be lost anteriorly. Therefore, the lower black arrow indicates the right costophrenic angle in this case, and the upper arrow is the left.
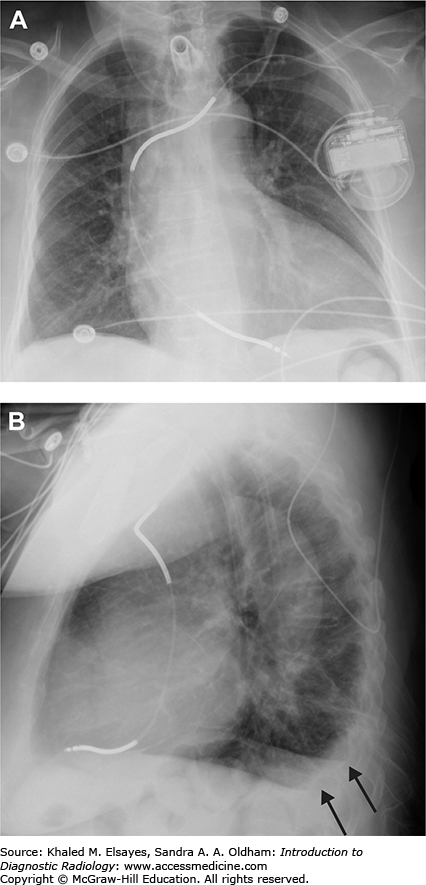
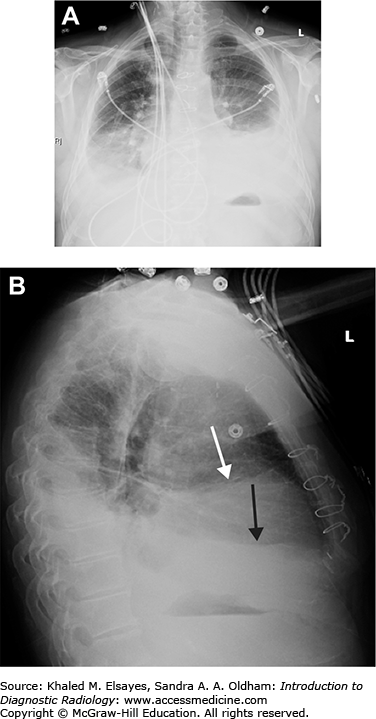
Fig. C2.3
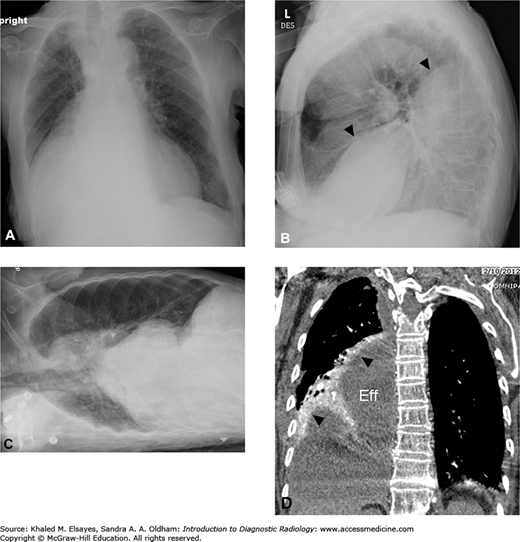
Pseudotumor caused by fluid tracking along the minor fissure. (A) PA view of the chest demonstrates smooth, lentiform right lateral pleural thickening (black arrow) suspicious for pleural effusion. There is a nodular opacity in the right midlung zone (white arrow). An ill-defined hazy opacity is also seen at the left lung base (black circle). (B) Lateral view of the chest fails to demonstrate the nodular lesion seen in the right midlung on the frontal view. However, there is fluid noted to be tracking in the minor fissure (black arrows). This creates an illusion of a nodular or mass lesion on frontal views of the chest, and it is often described as a pseudotumor. This is most often seen in association with congestive heart failure or other transudative effusions. (C) Sagittal reformatted CT scan in soft tissue windows demonstrates fluid tracking along the major (white arrowhead) and minor (white arrow) fissures. There was no mass. Ill-defined opacity at the left lung base was due to scarring, likely from prior infection.

Fig. C2.4
Loculated pleural effusion. (A) There is elevation of the right hemidiaphragm on PA view. (B) Lateral view. The left hemidiaphragm is visible and silhouetted by the heart anteriorly. The right hemidiaphragm appears elevated (black arrowheads) likely due to a large subpulmonic effusion. (C) Right lateral decubitus view does not demonstrate layering of the effusion, indicating that it is loculated and not freely mobile. (D) Coronal reformatted contrast-enhanced CT in soft tissue windows demonstrates a large subpulmonic effusion (Eff) and adjacent enhancing atelectatic lung (black arrowheads).
Chest x-ray. CT can be a useful adjunct in characterizing empyemas and loculated effusions.
Frontal and lateral views should be obtained, and decubitus views are helpful as well to demonstrate mobility/layering of fluid to exclude loculation. Decubitus views are also the most sensitive to small amounts of fluid. CT is helpful in complicated cases (ie, empyema, loculation), as well as to evaluate for underlying lung or pleural masses. Administration of contrast material is helpful whenever possible, especially when looking for underlying masses or if an exudative effusion is suspected (ie, empyema).
The pleural space physiologically contains up to 5 cc of fluid. Mobile pleural effusions will travel to the most dependent portion of the pleura, which will vary depending on the position in which the patient is imaged. When the patient is erect, this is typically the posterior costophrenic recess, and this is why lateral views are more sensitive to detect small effusions compared to frontal views. A frontal view may require 200 to 500 cc of fluid to be present before blunting of the lateral costophrenic recesses will become evident, whereas approximately 50 cc may be necessary to see blunting of the posterior costophrenic recess on a lateral view [1]. The lateral decubitus view is actually the most sensitive, and may be able to detect as little as 10 cc of fluid [2]. After filling the posterior and lateral recesses, moderate sized effusions will typically extend superiorly and produce a meniscus, which is easily identified. Very large effusions can result in compressive atelectasis of most of the lung as well as contralateral mediastinal shift due to their space occupying effects, and can result in complete opacification of the hemithorax. These are often due to malignancy. Pleural fluid can accumulate in a variety of locations, including within the fissures, the subpulmonic space, and along the mediastinum. Subpulmonic effusions in particular can be difficult to assess on a frontal view. Some signs to look for include elevation of the hemidiaphragm, lateral displacement of the peak of the hemidiaphragm, and (only on the left side) increased distance between the gastric bubble and the diaphragm. In all of these signs, it is not actually the hemidiaphragm that is displaced, rather it is the subpulmonic collection silhouetted against the diaphragm that you are seeing. On a supine frontal view of the chest, pleural fluid will layer posteriorly, and may reach a very large size before being detectable. A hazy gradient opacity overlying the entire hemithorax may be the only clue. Larger effusions will eventually cause blunting of the lateral costophrenic recess, and a meniscus may be seen as well. Very large effusions will extend to the lung apex, producing an “apical cap.”
Many patients with pneumonia develop simple parapneumonic effusions, of which a small percentage will go on to develop into an empyema due to secondary infection of the pleural fluid. While this may not be readily identifiable on plain films (unless it is loculated), contrast-enhanced CT can be helpful and will demonstrate thickening and enhancement of the pleura. Additionally, there will often be a “split-pleura” sign, which is when both the visceral and parietal leaves of the pleura are thickened and enhancing, and are seen to be separated by an empyema or exudative effusion [3]. Loculated effusions can be demonstrated by lack of mobility on decubitus views of the chest. Additionally, they tend to lose their meniscoid shape, and may appear as peripheral lentiform-shaped collections on frontal views, which may be indistinguishable from pleural masses based on x-ray alone. CT is again helpful in this situation, and will demonstrate fluid attenuation within a loculated pleural effusion, as opposed to a pleural mass. Ultrasound may allow direct visualization of the fibrinous septations responsible for the loculation, and may be used to guide thoracentesis. Hemorrhagic pleural effusions can sometimes be distinguished on CT due to the higher attenuation of blood compared to water. Additionally, a hematocrit effect may be seen, which is manifest by layering high-density material due to clotted blood products.
Drainage of pleural effusions whether for diagnostic or therapeutic purposes can be achieved in a variety of ways, depending largely on institutional or operator preference. Ultrasound, CT, and fluoroscopy are all commonly used. Ultrasound has the advantage of being portable, allowing for bedside drainage, and avoids radiation exposure as well.
Pneumonia, atelectasis, and lung cancer may all present with shortness of breath and decreased breath sounds.
Imaging findings of a simple pleural effusion are fairly typical and pathognomonic. CT may be helpful in differentiating a simple effusion from an empyema as described on the previous page.
CC, Black
WC, Dallas
RV,
et al. Pleural fluid volume estimation: a chest radiograph prediction rule. Acad Radiol. 1996;3:103-–109.
[PubMed: 8796649]
H, Platt
RT, Schachar
R,
et al. Roentgen visualization of minute pleural effusion: an experimental study to determine the minimum amount of pleural fluid visible on a radiograph. Radiology. 1973;109:33-–35.
[PubMed: 4783125]
GJ. The split pleura sign. Radiology. 2007;243:297-–298.
[PubMed: 17392263]
CASE 3: PULMONARY EDEMA
A 72-year-old male with past medical history of ischemic cardiomyopathy presents with increasing shortness of breath. A third heart sound and pulmonary rales are heard on auscultation, and there is pitting edema of the lower extremities. BNP is elevated.
Decompensated congestive heart failure (CHF), pulmonary edema (Figs. C3.1–C3.3)
Fig. C3.1
“Batwing” pulmonary edema. Frontal chest radiograph demonstrates bilateral perihilar airspace opacities consistent with batwing pulmonary edema. This tends to be seen with acute or rapid development of heart failure. Also, there is thickening of the minor fissure, which is due to subpleural accumulation of fluid.

Fig. C3.2
Interstitial pulmonary edema. Frontal chest radiograph demonstrates diffuse bilateral reticular opacity as well as Kerley B lines (two are annotated with black arrows). These represent distended pulmonary lymphatic channels within the interlobular septae due to fluid overload. The cardiac silhouette is grossly enlarged in this patient with CHF.
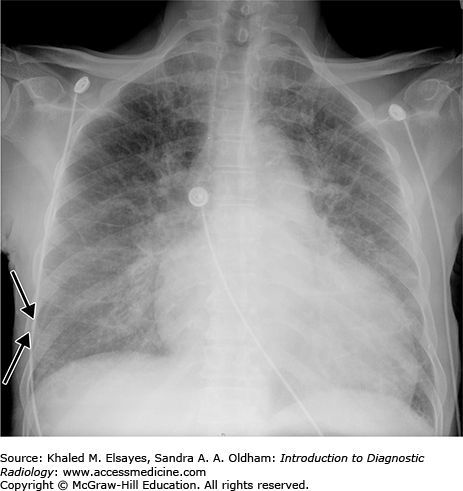
Fig. C3.3
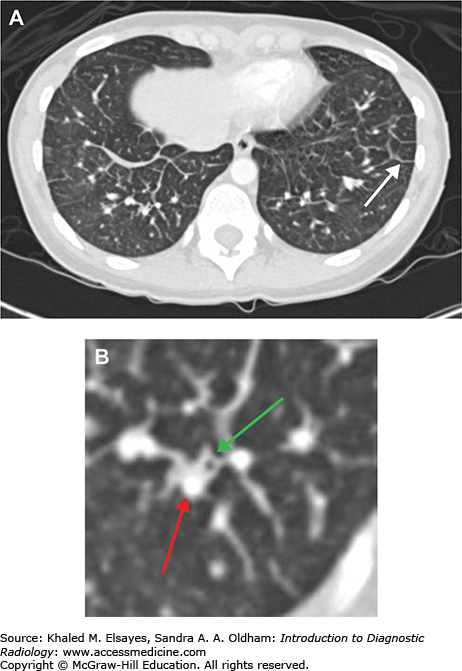
Interstitial pulmonary edema. (A) Axial chest CT demonstrates smooth thickening of interlobular septae (white arrow) in a patient with interstitial pulmonary edema. This is the CT equivalent of Kerley B lines seen on chest x-rays. (B) Magnified view from the RLL in the same patient demonstrates bronchial wall thickening (green arrow), which is the CT equivalent of peribronchial cuffing seen on radiographs. Also, note that the adjacent pulmonary artery branch (red arrow) is slightly larger than the bronchus.
Chest x-ray, preferably upright PA and lateral views. Echocardiography is helpful in assessing cardiac function and chamber size among other things.
Pulmonary edema can be broadly classified as being due to increased hydrostatic pressure, or due to increased capillary permeability. Hydrostatic edema is primarily due to left heart failure and volume overload states. Radiographically, hydrostatic edema typically progresses through three stages, which have been shown to correlate with a rising pulmonary capillary wedge pressure through each stage. The first stage is pulmonary venous hypertension, which is accompanied by vascular redistribution to the upper lobes, and is demonstrated by cephalization on a frontal radiograph (increased vessel diameter in the upper lobes on an erect film). The second stage is interstitial pulmonary edema, which is due to fluid accumulating in the interstitium of the lung, and due to dilation of lymphatic channels as they begin to drain the excess fluid. This is manifested radiographically by interlobular septal thickening (visible as Kerley “B” lines on a chest x-ray which are thin horizontal lines perpendicular to the pleural surface seen at the lung bases), peribronchial cuffing (thin, circular densities seen due to thickening of bronchial walls secondary to fluid accumulation), and hazy vessel margins. Small pleural effusions may also be seen, which may only manifest as mild pleural thickening. The third phase is frank alveolar edema, due to fluid extravasation into the alveolar space. Radiographically, this is manifest by consolidative opacities, which tend to have ill-defined margins. Classically, they may be in a perihilar or “bat-wing” distribution, although varying patterns are possible, and the pattern may gradually shift depending on patient positioning. The presence of cardiomegaly suggests underlying CHF and can add confidence to the diagnosis, but cardiomegaly can also be seen in patients with renal failure or other causes of volume overload. On an upright and inspiratory PA view of the chest, a rough assessment of cardiomegaly can be made using the cardiothoracic ratio. This is defined as the maximal transverse diameter of the cardiac silhouette divided by the internal diameter of the thorax, measured at the highest point on the right hemidiaphragm. In normal adults, this ratio is less than 0.5. It is important to note that the cardiac silhouette is magnified on AP projections, and this ratio cannot be used. Also, expiratory phase imaging will artificially elevate this ratio. On CT, the main finding in interstitial edema is smooth interlobular septal thickening. Bronchial wall thickening will also be seen, and is the basis of peribronchial cuffing seen on chest x-rays. Central pulmonary arteries will be enlarged, and may be larger than the adjacent bronchus. As the edema progresses into the alveolar space, lobular ground glass opacities will develop, often in a geographic pattern. Pleural effusions may also be present.
Permeability edema can be due to numerous conditions. Common ones include sepsis, blood transfusion (TRALI), chemical pneumonitis (eg, aspiration), and pancreatitis. Radiographically, it is manifest by nonspecific bilateral air space opacification which is often symmetric, and can be a component of acute respiratory distress syndrome (ARDS) and acute lung injury (ALI), which are clinical diagnoses consisting of multiple criteria. The opacities may initially be patchy and inhomogeneous, but may rapidly coalesce and lead to diffuse opacification. Since permeability edema is primarily an alveolar process, septal lines (ie, Kerley B lines) and peribronchial cuffing are not commonly seen. In patients with ARDS, be on the lookout for complications of barotrauma (such as pneumothorax and pneumomediastinum), as lung compliance is reduced and patients are often on positive pressure ventilation. Superimposed pneumonias are common, and are impossible to distinguish radiographically from the surrounding edema. On CT, the typical pattern is of dense opacification of the dependent portions of the lung, with ground glass opacity layered on top of that, and any normal lung at the very top in the most nondependent regions. The distribution is bilateral, but may be asymmetric and inhomogeneous. The pattern may have a geographic appearance, where uninvolved lobules are seen adjacent to involved lobules. Although septal lines are not often seen on x-rays, interlobular septal thickening is often seen on CT. Pleural effusions may again be present.
Pneumonia, myocardial infarction, pulmonary embolism
Airspace disease due to hemorrhage or infection may resemble alveolar edema. Interstitial edema may resemble viral or atypical pneumonias.
ML, Kee
ST, Golden
JA, Webb
WR. Hydrostatic pulmonary edema: high-resolution CT findings. AJR. 1995;165:817-–820.
[PubMed: 7676973]
T, Capasso
P, Schnyder
P,
et al. Clinical and radiologic features of pulmonary edema. RadioGraphics. 1999;19(6):1507-–1631.
[PubMed: 10555672]
CASE 4: PNEUMOTHORAX
A 20-year-old male presents with acute onset of left-sided chest pain. On examination he is tall and thin, and breath sounds are absent on the left.
Pneumothorax
Chest x-ray (Figs. C4.1–C4.4). This should preferably be performed in the upright position initially, although lateral decubitus views offer the greatest sensitivity. Some small pneumothoraces may only be visible on CT.
Fig. C4.1
Bilateral posttraumatic pneumothorax. (A) Portable AP chest radiograph obtained in the emergency department demonstrates a faintly visible pleural line bilaterally (black arrows) as well as lucency along the diaphragmatic and cardiac borders (black arrowheads) consistent with bilateral pneumothorax. Also note the extensive subcutaneous emphysema particularly over the left chest and extending into the neck. (B) Axial chest CT again demonstrates bilateral pneumothoraces (black arrowheads). There is extensive pulmonary contusion in the left lung (black circle) as well as subcutaneous chest wall emphysema (black arrow).
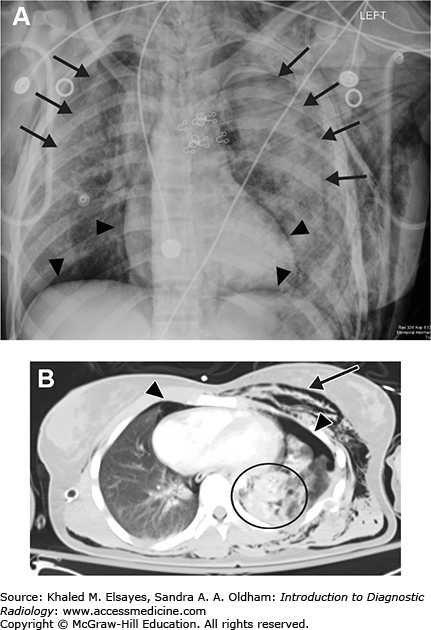
Fig. C4.2
Deep sulcus sign. (A) Portable AP chest x-ray obtained in the emergency department demonstrates air tracking deep within the lateral costophrenic sulci, known as the deep sulcus sign, bilaterally (black arrows). This is indicative of bilateral pneumothorax. (B) Chest CT with coronal reformation demonstrates the basis for this finding (black arrows).
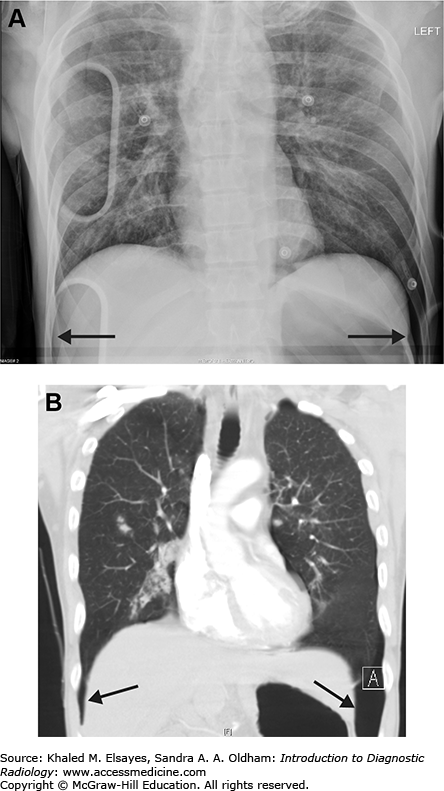
Fig. C4.3
Tension pneumothorax. (A) Scout image from chest CT demonstrates a left rib fracture (white arrowhead) and large left pneumothorax (white arrows). (B) Axial section from the CT scan demonstrates a large left pneumothorax as well as mild rightward mediastinal shift, suspicious for a tension pneumothorax. The patient was hemodynamically stable however. Radiographic evidence of tension physiology does not always correlate with the clinical syndrome, as demonstrated here.

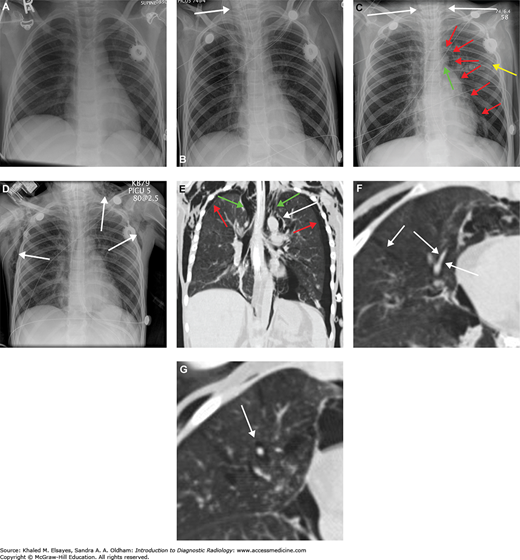
Fig. C4.4
Pneumomediastinum. (A) Baseline chest x-ray. (B) Chest x-ray obtained while the patient was intubated in the intensive care unit demonstrates linear lucency along the right paratracheal region extending into the neck, consistent with pneumomediastinum. (C) Subsequent chest x-ray the next day demonstrates lucency extending into the neck bilaterally (white arrows). Additionally, there is lucency along the aortic knob and left heart border (red arrows). There is lucency along the undersurface of the aortic arch (green arrow). Yellow arrow points to the lateral margin of the left scapula, which may simulate a pneumothorax. (D) By the third day, extensive subcutaneous emphysema has developed. (E) A CT scan was performed at this time, and a coronal reformat demonstrates the lucency surrounding the aortic knob that was seen on the x-ray (white arrow). Additionally, there are bilateral pneumothoraces that were not well seen on x-ray (red arrows). Green arrows demonstrate gas extending from the mediastinum into the neck. (F) Axial CT in lung windows demonstrates branching tubular lucencies in the lung (white arrows) consistent with pulmonary interstitial emphysema. There is also air surrounding a pulmonary artery branch in the RML. (G) Different section again demonstrates gas surrounding a pulmonary artery branch (white arrow). All of these findings were likely the result of barotrauma due to positive pressure ventilation.
On an upright frontal view of the chest most pneumothoraces are classically manifest by a visible visceral pleural line. No lung markings will be visible peripheral to the pleural line, and there will often be mediastinal shift toward the side of the pneumothorax due to the associated volume loss (with the exception of a tension pneumothorax). The contralateral lung will then be somewhat hyperexpanded and more lucent, and the collapsed lung will be shrunken and more radiopaque.
On a supine film, small pneumothoraces may not be readily visible, and sensitivity is greatly reduced. Many signs of pneumothorax on a supine film have been described. One of these is the “deep sulcus sign,” which is deepening of the costophrenic angle and increased lucency due to subpulmonic accumulation of air [1]. Other signs of subpulmonic pneumothorax include deepening of the cardiophrenic angle, “double diaphragm sign” (when the inferior extent of the anterior pleural space becomes visible separate from the dome of the diaphragm), and visible well-defined pericardial fat pads [2,3]. Collections of air anteromedially can be manifest by increased sharpness or lucency along the ipsilateral cardiomediastinal border [2]. Sometimes, overlying skin folds or the lateral margin of the scapula may simulate a pneumothorax radiographically, and result in a false positive diagnosis. In these cases, pulmonary vascular markings can usually be seen extending beyond the skin fold or scapular margin, excluding a pneumothorax.
In problematic cases, a lateral decubitus view can be helpful. Since the air will rise to a nondependent location, the contralateral decubitus view should be obtained. For example, if a left-sided pneumothorax is suspected, a right lateral decubitus view should be obtained (ie, with the right side down and the left side up). The air should then rise and be visible along the left chest wall. CT can also be performed in questionable cases, and should easily demonstrate air within the pleural space.
Tension pneumothorax is classically described as a large pneumothorax with contralateral mediastinal shift. However, it is important to note that the presence of contralateral mediastinal shift does not always correlate with clinical findings of tension physiology (ie, impaired venous return due to increased intrathoracic pressure resulting in hypotension) [4].
Bronchopleural fistulas are most often seen as a complication of cardiothoracic surgery (ie, pneumonectomy), however, they can also be created due to malignancy, or infection. These can be suspected clinically in the setting of a pneumothorax that is refractory to treatment. CT is the imaging modality of choice, as the fistulous communication can often be directly visualized. Xe-133 ventilation scanning can also be helpful, and will demonstrate accumulation of radiotracer in the pleural space on washout images. This confirms the presence of a bronchopleural fistula, although it does not aid in localization [5].
Pulmonary embolism, myocardial infarction, pneumonia, costochondritis.
There are several pitfalls in the diagnosis of pneumothorax on plain radiographs including skin folds and the lateral margin of the scapula. Knowledge of these pitfalls will aid in their avoidance. On CT the appearance of a pneumothorax is characteristic.
R. The deep sulcus sign. Radiology. 1980;136:25-–27.
[PubMed: 7384513]
IM. Pneumothorax in the supine patient: radiographic anatomy. RadioGraphics. 1985;5(4):557-–586.
FMH
Jr, Westcott
JL. Supine subpulmonary pneumothorax. AJR. 1981;137:699-–701.
[PubMed: 6974963]
S, Ragg
M, Stella
J. Is mediastinal shift on chest x-ray of pneumothorax always an emergency? Emerg Med (Fremantle) 2003;15:429-–433.
[PubMed: 14992056]
NR, Gleeson
FV. Imaging of pleural disease. Clin Chest Med. 2006;27(2):193-–213.
[PubMed: 16716813]
CASE 5: PULMONARY CONTUSION
A 45-year-old male status post high-speed MVA involving blunt trauma to the chest complains of chest pain and hemoptysis.
Pulmonary contusion
While large contusions may be evident on chest radiographs, CT is usually the modality of choice (Figs. C5.1 and C5.2). Although iodinated contrast is not necessary to diagnose a pulmonary contusion, it is very helpful in the setting of chest trauma, particularly to evaluate the aorta.
Fig. C5.2
Pulmonary contusion and laceration. (A) Axial CT from another patient with blunt chest trauma demonstrates a left pneumothorax (black arrowheads) and subcutaneous emphysema (white arrows). There is extensive ground glass and consolidative opacity within the collapsed left lung (black circle). Also note the several small lucent areas (black arrow) consistent with pulmonary lacerations. (B) Frontal chest x-ray demonstrates consolidative opacity over the left lung base, in the area of the contusion (black circle). Subcutaneous emphysema is evident (black arrowheads). A chest tube has been placed to re-expand the lung.

Pulmonary contusions are caused by blunt chest trauma, and pathologically they represent blood in the alveoli, which can cause hemoptysis. Radiographically, they typically manifest as a ground glass opacity with ill-defined borders in a geographic distribution. More severe cases may demonstrate frankly consolidative opacities. They stabilize in appearance by 24 hours, and resolve over the course of a week. A pulmonary opacity that appears more than 24 hours after the initial trauma is not therefore due to contusion. Pulmonary lacerations are caused by penetrating trauma usually and are manifest radiographically by rounded lucencies, which may be surrounded or obscured by surrounding contused lung. The lucent areas often contain air-fluid levels secondary to blood within the lesion, and are caused by disruption of the lung parenchyma with resulting recoil of the surrounding lung tissue. A true blood filled cyst is termed a pulmonary hematoma.
In the setting of trauma, the complaints of chest pain and hemoptysis are highly suggestive of pulmonary contusion.
On imaging alone, contusion may be indifferentiable from air space disease due to infection, edema or aspiration. The history suggests the diagnosis, as do other ancillary findings of trauma, such as concomitant rib fractures.
ML, Primack
SL, Israel
RS,
et al. CT in blunt chest trauma: indications and limitations. RadioGraphics. 1998;18:1071-–1084.
[PubMed: 9747608]
R, Avery
LL, Asrani
AV,
et al. Multidetector CT of blunt thoracic trauma. RadioGraphics. 2008;28:1555-–1570.
[PubMed: 18936021]
CASE 6: PULMONARY EMBOLISM
A 69-year-old female with breast cancer presents with acute onset of shortness of breath and pleuritic chest pain. On examination, the patient is tachycardic and O2 saturation is 90% on room air.
Pulmonary embolism (PE)
Pulmonary CT angiography is now the criterion standard (Figs. C6.1 –C6.10). This has essentially replaced catheter pulmonary angiography and has been demonstrated to be significantly more sensitive, especially for small (ie, segmental and subsegmental) emboli [2]. V/Q scans still have a role in patients who cannot receive iodinated contrast. Some authors advocate perfusion only scans (a V/Q scan without the ventilation component) in pregnant or young women in an effort to reduce radiation dose, although reported doses vary widely and many, if not most, institutions still prefer CT angiography (CTA) [6]. Doppler ultrasound of the lower extremities is also useful in detecting deep venous thrombosis (DVT), the leading cause of pulmonary embolism.
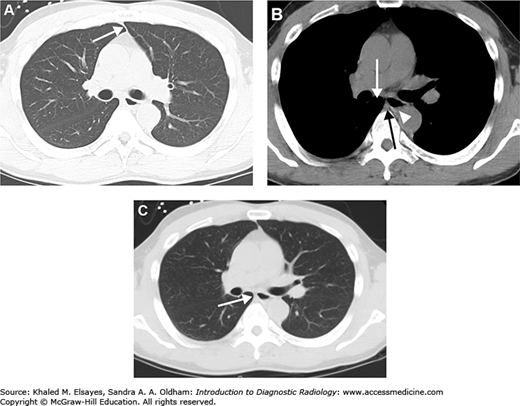
Fig. C6.1
Acute pulmonary embolism. (A) There is an intraluminal filling defect forming a concave border with the contrast material (white arrow). There is also right lower lobe consolidation (black arrow), which could represent a pneumonia or infarction in the appropriate clinical setting. (B) Coronal reformation in the same patient better demonstrates the thrombus (black arrow).

Fig. C6.2
Acute pulmonary embolism with likely pulmonary arterial hypertension. There is an intraluminal filling defect, consistent with an acute pulmonary embolism (white arrow). The pulmonary arterial trunk (PA) is larger than the adjacent ascending aorta (A), suggesting pulmonary arterial hypertension, likely due to the large PE.


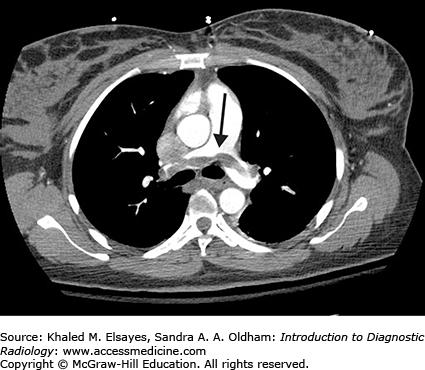
Fig. C6.5
Pulmonary embolism and infarction. (A) CT angiogram of the chest demonstrates a filling defect in the right lower lobe pulmonary artery (white arrow) which was seen straddling the anterior and posterior segments on contiguous sections, consistent with a pulmonary embolism. (B) Axial section in lung windows more inferiorly demonstrates a peripheral wedge shaped opacity in the posterior segment of the right lower lobe, consistent with an infarct (black arrow). (C, D) PA and lateral chest x-ray obtained the same day do not show any abnormality, stressing the insensitivity of chest radiographs for pulmonary embolism.
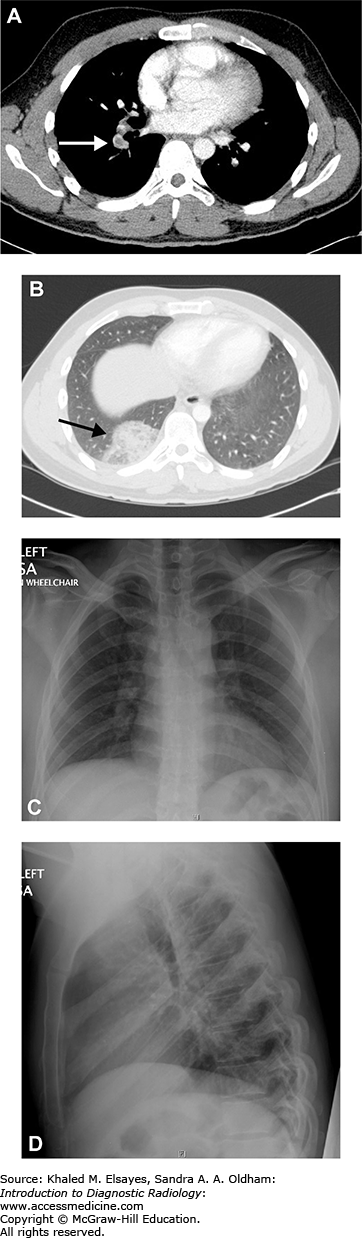
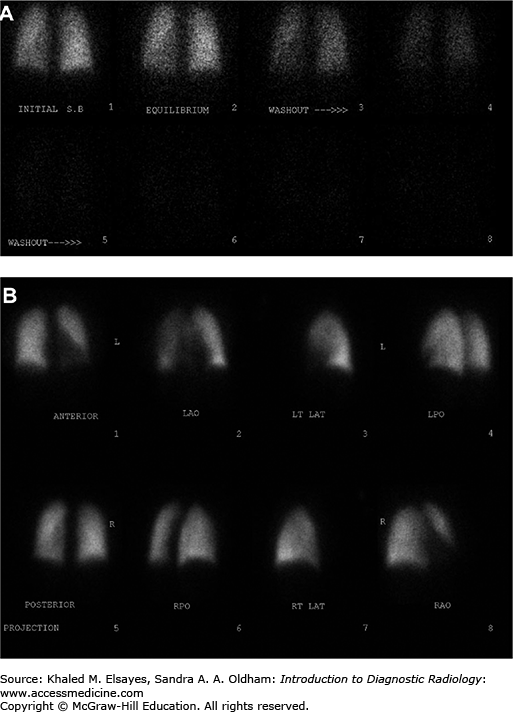
Fig. C6.7
Intermediate probability V/Q scan. (A) Ventilation images demonstrate no focal defects. (B) Perfusion images demonstrate a segmental defect involving the anterior basal segment of the right lower lobe (white arrows), giving an intermediate probability for pulmonary embolism. CT angiogram performed 5 days later did not demonstrate any pulmonary emboli, although the patient received anticoagulation in the interim, and it is conceivable that any potential thrombus may have resolved.

Fig. C6.8
High probability V/Q scan. (A) PA view of the chest demonstrates subtle decrease in vascular markings in the left lung as compared to the right (Westermark sign). (B) Ventilation scan in the same patient is normal. (C) Perfusion scan demonstrates greatly diminished perfusion to the left lung (white arrows) and a moderate sized segmental defect involving the anterior segment of the right upper lobe (white arrowhead), consistent with a high probability of pulmonary embolism. (D) Grayscale Doppler of the left lower extremity in the same patient demonstrates a noncompressible popliteal vein with echogenic thrombus within the lumen. (E) Color Doppler demonstrates lack of flow within the popliteal vein (v), which is completely occluded with echogenic thrombus (white arrows). A few foci of color flow are seen in adjacent collaterals.

Fig. C6.9
Chronic pulmonary embolism. (A) CT angiogram demonstrates a partially occlusive eccentric filling defect within the posterior basal segment of the left lower lobe as well as an occlusive filling defect in the posterior basal segment of the right lower lobe (white arrows). The morphology of the thrombus in the left lower lobe suggests chronic pulmonary embolism. (B) Different section from the same study demonstrates low attenuation thrombus around the tip of a central catheter (white arrow), which could be a source of emboli. This was a cancer patient with an indwelling port-catheter. (C) Whole body MIP from a PET-CT performed the next day demonstrates foci of low level FDG uptake within the medial lung bases bilaterally as well as slightly higher in the mediastinum (black arrows). Physiologic excretion is seen within the renal pelvises, along the ureters, and in the bladder. Malignant foci are present in the right groin. (D) An axial section from the PET portion of the study localizes the two lower foci to the posterior basal segments bilaterally (white circles). (E) Fused PET-CT image demonstrates that these foci are within the pulmonary arteries, corresponding to the filling defects seen on the prior CTPA (white circles). (F) Another fused PET-CT image demonstrates low-level uptake within the catheter tip thrombus as well (white arrow). Low-level uptake in the esophagus (white arrowhead) is likely physiologic. It is thought that FDG uptake may be secondary to glucose metabolism by the inflammatory cellular infiltrate including activated macrophages, neutrophils, and fibroblasts within an organizing thrombus.
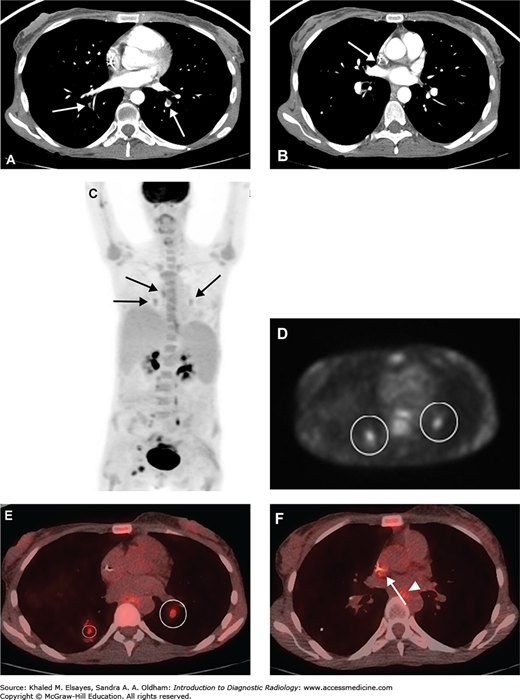
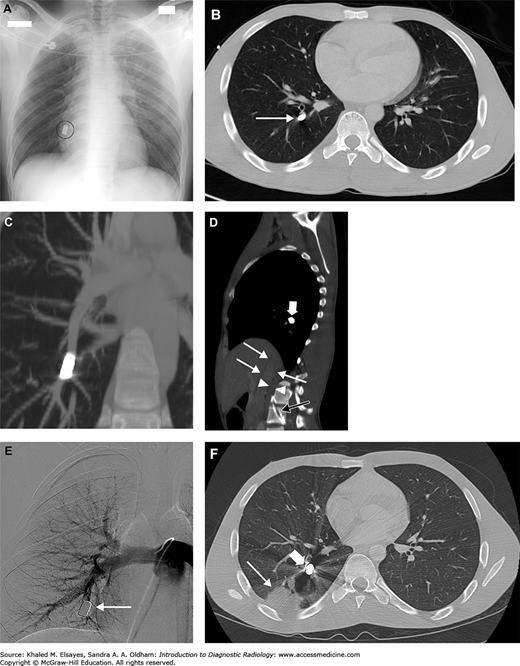
Fig. C6.10
Bullet pulmonary embolus. (A) Portable AP chest x-ray demonstrates a bullet projecting over the medial right lung base (black circle). No evidence of hemothorax, pneumothorax, or other traumatic injury to the chest. Note that since this is only a single view, it could be external to the patient as well. (B) Axial chest CT demonstrates that the bullet is within the right posterior basal segment pulmonary artery branch (white arrow). (C) Coronal MIP nicely demonstrates the intra-arterial location of the bullet. (D) Sagittal CT reconstruction demonstrates the bullet tract through the lumbar spine (black arrow). From there, the bullet entered the IVC (thin white arrows) and then migrated intravascularly into the pulmonary arterial tree via the right heart. There is a retroperitoneal hematoma (white arrowheads). The bullet itself is again seen (thick white arrow). (E) Catheter pulmonary angiogram was performed several days later, also demonstrating the intravascular nature of the bullet (white arrow). The bullet appeared to be stable in position compared to the earlier CT scans, and it was decided to leave the bullet in situ, rather than attempt to retrieve it. (F) Repeat chest CT obtained approximately one week later demonstrates interval development of a peripheral somewhat wedge-shaped opacity consistent with an infarct (thin white arrow) in the territory of the embolized vessel (thick white arrow).
Pulmonary CT angiography is widely available, fast, noninvasive, and very reliable when the study is of good quality. Also, other causes of the patient’ symptoms are often identified, even if negative for pulmonary embolism. Excluding inconclusive studies, the sensitivity of CTA for detecting pulmonary embolism was 83% and the specificity was 96% in the PIOPED II study [3].
Entails exposure to radiation and iodinated contrast. The exam will be limited if the patient is excessively tachypneic and unable to hold their breath throughout the scan, although scan times are now typically less than 15 seconds on modern multidetector CT scanners. Also, a large bore IV or power injectable central venous catheter is required to withstand the high contrast flow rates needed (typically 4.0-5.0 cc/s).
On a pulmonary CTA, the key finding is a filling defect within the pulmonary arterial tree. In an acute pulmonary embolus, this filling defect may occlude the entire vessel, resulting in complete nonopacification and sometimes even mild enlargement of the vessel. Alternatively, it may lie centrally within the vessel and be surrounded by a thin rim of contrast material, producing a target appearance on a transverse section of the vessel or a tram-track appearance on a longitudinal section. The embolus is frequently seen straddling a vascular bifurcation where the embolus gets hung up at the bifurcation, with portions of the embolus going into different segments of a vessel. When imaged longitudinally, the trailing edge (more proximal end) of the thrombus typically has a concave appearance. Finally, it may lie against the wall of the vessel, in which case it will usually form acute angles and maintain a rounded appearance (this is important in differentiating from chronic pulmonary embolus, which will be discussed later) [4]. On a noncontrast CT, large central emboli can rarely be seen as a hyperdense clot within the pulmonary trunk or in the main pulmonary arteries [1]. If there is an associated pulmonary infarct, this typically appears as a peripheral wedge shaped opacity in the territory of the affected vessel(s), and there may or may not be an associated pleural effusion. An additional benefit to CTA for detection of pulmonary embolism is the ability to detect DVT of the lower extremities concurrently using the same contrast bolus by performing a delayed CT venogram through the pelvis and lower extremities after imaging the chest. The drawback to this approach is increased radiation dose, and this information may be readily obtained by Doppler ultrasound as well (although the IVC and iliac veins are difficult to evaluate sonographically).
Several indirect signs of pulmonary embolism on chest x-rays have been historically described, which lack sensitivity, but deserve mention nonetheless. In fact, the chest x-ray may be entirely normal, and the patient may have a massive PE. Massive acute emboli or extensive chronic emboli may cause pulmonary arterial hypertension, which can manifest as an enlarged pulmonary arterial shadow and/or right heart enlargement on chest x-ray in the setting of cor pulmonale. The Westermark sign is the presence of diminished and/or narrowed vascular markings in the affected vascular territory secondary to regional oligemia. Hampton’ hump is a peripheral wedge shaped opacity representing an infarct. While these signs have been reported to have a high specificity, sensitivity and positive predictive value remain low [5].
Ventilation/Perfusion scintigraphy (V/Q scan) has declined in popularity with the advent of CTA; however, it remains a viable option for patients in whom iodinated contrast is contraindicated. The key finding of PE on a V/Q scan is termed a “V/Q mismatch,” which is an area of lung that is ventilated, but not perfused. Although specific protocols vary by institution, the premise is similar. For the ventilation portion, the patient inhales a radioactive gas (Xe-133 or Kr-81m) or aerosol (Tc-99m DTPA), and breath hold, equilibrium, and washout images are typically obtained. For the perfusion portion, Tc-99m-MAA is injected intravenously and again images are obtained with a gamma camera in multiple projections. The ventilation and perfusion images are then compared, and assessed for focal defects (areas of photopenia) corresponding to segmental territories. Based on the number and size of matched/mismatched defects and comparison with a recently performed chest x-ray as well as other factors, the likelihood of pulmonary embolism is then assessed based on criteria derived from the PIOPED study [6]. The probability is usually stratified into the following categories: normal, low probability, intermediate probability, and high probability. There have been several proposed modifications to these criteria since the original study, and the latest recommendations can be found in the Society of Nuclear Medicine practice guidelines.
Chronic pulmonary emboli are best imaged with CTA as well, and are more irregular in appearance than acute emboli. When imaged longitudinally, the trailing edge tends to form a concave border with the contrast media as opposed to a convex border typically seen with acute emboli. Chronic thrombus is often eccentric in location within the vessel and is adherent to the vessel wall. This results in intimal irregularities, which often form obtuse angles with the wall when imaged transversely, as compared to the acute angles typically formed by acute emboli. Progressive organization and resorption of the thrombus can lead to the formation of bands and webs within the thrombus as it recanalizes [7]. Often, however, it may not be possible to definitively differentiate acute from chronic thrombi.
Pneumonia, myocardial infarction, pleuritis, pericarditis, GERD.
The typical appearance of a pulmonary embolism is virtually pathognomonic. Occasionally, artifact from either respiratory or cardiac motion may limit evaluation of certain vessels or mimic a filling defect, leading to either false positive or false negative result. Differentiation of acute and chronic emboli may often be made, as described on page 161. Tumor thrombi and pulmonary artery sarcoma will also present as filling defects, but typically demonstrate enhancement of the thrombus.
JP, Gotway
MB, Thoongsuwan
N, Stern
EJ. Six cases of acute central pulmonary embolism revealed on unenhanced multidetector CT of the chest. AJR. 2003;180:1661-–1664.
[PubMed: 12760938]
C, Waltman
AC, Shepard
JA, Halpern
E, Goodman
LR. Discordance between CT and angiography in the PIOPED II study. Radiology. 2007;244(3):883-–889.
[PubMed: 17664436]
PD, Fowler
SE, Goodman
LR,
et al. Multidetector computed tomography for acute pulmonary embolism. N Engl J Med. 2006;354(22):2317-–2327.
[PubMed: 16738268]
C, Maher
MA, Yoo
AJ,
et al. CT angiography of pulmonary embolism: diagnostic criteria and causes of misdiagnosis. RadioGraphics. 2004;24:1219-–1238.
[PubMed: 15371604]
DF, Alavi
A, Aronchick
JM,
et al. Chest radiographic findings in patients with acute pulmonary embolism: observations from the PIOPED study. Radiology. 1993;189(1):133-–136.
[PubMed: 8372182]
A, Sostman
HD, Coleman
ER,
et al. Ventilation-perfusion scintigraphy in the PIOPED study. Part II. Evaluation of the scintigraphic criteria and interpretations. J Nucl Med. 1993;34:1119-–1126.
[PubMed: 8315488]
C, Kalra
MK, Maher
MM,
et al. Acute and chronic pulmonary emboli: angiography-CT correlation. AJR. 2006;186: S421-–S429.
[PubMed: 16714619]
C, Scott
JA. 18F-FDG PET of pulmonary embolism. AJR. 2007;189:171-–176.
[PubMed: 17579168]
CASE 7: TUBERCULOSIS
A 36-year-old male prisoner presents with worsening cough for several weeks, recently with occasional flecks of blood. On review of systems, he also complains of occasional fevers and night sweats.
Tuberculosis (TB)
Chest x-ray, PA and lateral views (Figs. C7.1–C7.4). Typical chest x-ray findings and positive sputum cultures/smears are all that is typically needed to make the diagnosis. CT can be helpful in adding confidence to the diagnosis, although it is usually not necessary.
Fig. C7.1
Miliary tuberculosis. (A) Frontal chest radiograph demonstrates innumerable tiny nodules distributed throughout both lungs. There is a hazy opacity at the left lung base with obscuration of the diaphragm, suggesting a pleural effusion. (B) Axial chest CT from the same patient also demonstrates innumerable tiny nodules randomly distributed, which were due to miliary tuberculosis in this HIV positive patient. One of these is annotated (black arrow). There is a large left pleural effusion (white arrowhead).
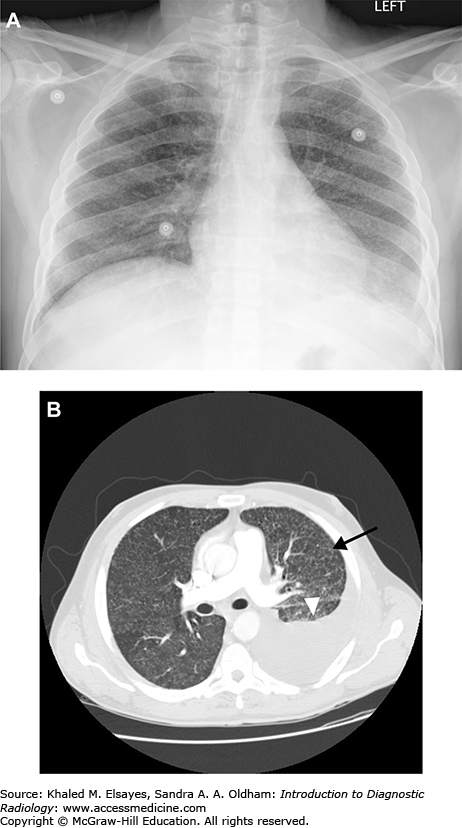
Fig. C7.2
Postprimary (reactivation) tuberculosis. (A) Frontal chest radiograph demonstrates patchy airspace opacities in the right upper lung, and to a much lesser extent in the left apex as well. In the appropriate clinical setting, opacities that demonstrate an apical predominance should raise suspicion for reactivation tuberculosis. (B) Axial chest CT from the same patient demonstrates right upper lobe reticulonodular opacities with a large, irregular, cavity. Note that the cavity is more readily apparent on the CT as compared to the radiograph. The patient was HIV positive, and had a CD4 count of 525.


Fig. C7.4
HIV patient with reactivation tuberculosis. (A) Frontal chest x-ray demonstrates left upper lobe consolidation (black circle). (B) Axial chest CT also demonstrates left upper lobe consolidation with an air bronchograms (black arrow). (C) Different section from the same scan demonstrates an area of cavitation that is not apparent on the radiograph (black arrow). Sputum cultures demonstrated Mycobacterium tuberculosis. The patient had a CD4 count of 228.

Lymphadenopathy is the hallmark of primary tuberculosis, especially in pediatric age groups. The incidence of lymphadenopathy declines with increasing age, however. The right hilar nodes and right paratracheal nodes are classically the most commonly involved, although any combination of mediastinal and hilar nodes may be affected. This right-sided predominance is felt to be due to the higher statistical likelihood of any airborne infection entering the right lung due to the anatomy. In extrapulmonary TB, other nodal groups throughout the body may be affected as well. The classic appearance of tuberculous adenopathy is peripheral enhancement with central hypodensity, which pathologically corresponds to a centrally necrotic but peripherally vascular and inflamed lymph node. In the proper clinical setting this appearance is highly suggestive of TB, although metastatic carcinoma and suppurative adenitis (particularly in the neck) may also have this appearance. In contrast to the incidence of lymphadenopathy in primary TB, the incidence of parenchymal involvement and pleural effusions increase with age. Focal consolidative opacity is the most common parenchymal finding in primary TB, although patchy or multifocal involvement can also occur. Unlike postprimary disease, there is no definite lobar predilection for primary TB. When pleural effusions occur, they are most often unilateral and on the same side as the infection, but can be bilateral. In a few percent of cases, a pleural effusion may be the only finding of primary TB, although it most commonly occurs in conjunction with parenchymal disease.
Postprimary or reactivation TB is classically manifest by apical and posterior opacities and cavitary lesions, although there may also be disease beyond these locations. Particularly, the apical and posterior segments of the upper lobes and the superior segments of the lower lobes are the favored sites. Nodular opacities (ie, tuberculomas) may predominate in a few patients, and some of these may go on to cavitate. On CT, in addition to these findings, there is usually also evidence of bronchogenic spread manifest by centrilobular nodules in a “tree-in-bud” configuration, which represent infectious/necrotic material impacted within respiratory and terminal bronchioles. As their name implies, centrilobular nodules are found in the center of the secondary pulmonary lobules. As such, a centrilobular distribution of nodules will exhibit subpleural sparing as the distal airways do not extend all the way to the pleural surface. This is in contrast to a lymphatic distribution, in which pleural surfaces are involved as well. Pleural effusions can occur in reactivation disease. In contrast to primary TB, hilar and mediastinal adenopathy is uncommon in postprimary disease.
Miliary disease most often occurs in the immunocompromised, and consists of innumerable tiny nodules in a random distribution throughout both lungs, with a basilar predominance consistent with hematologic dissemination. There may be associat ed consolidative and/or cavitary parenchymal disease with or without lymphadenopathy. Early on, miliary disease may not be seen on chest x-ray, and only seen on CT. The pattern of findings in HIV positive individuals varies with the degree of immune suppression. When immune function is maintained (CD4 > 200), the typical reactivation pattern of disease is seen, similar to immunocompetent hosts. As immune function becomes compromised (CD4 < 200), there is increasing trend toward a primary pattern of disease dominated by lymphadenopathy and noncavitary consolidative opacities.
Nontuberculous mycobacterial infections (NTMB) can cause a spectrum of diseases. In the “classic” form, it consists of apical fibrocavitary disease, which is indistinguishable from postprimary TB, and there is a predilection for older men with underlying COPD or other chronic lung disease. There is a bronchiectatic or “nonclassic” form as well, which has a predilection for older white women, and has been termed “Lady Windermere” syndrome. Radiologic findings include centrilobular nodules (which may be in a tree-in-bud pattern) and bronchiectasis, most commonly affecting the right middle lobe and lingula. NTMB can also be a cause of solitary pulmonary nodules in asymptomatic patients. In those with HIV and CD4 counts of less than 100, NTMB most commonly causes disseminated disease in which the primary finding is lymphadenopathy, which may involve mediastinal and hilar groups as well as abdominal and other extrathoracic groups. More recently, NTMB have been associated with a form of hypersensitivity pneumonitis termed “hot tub lung.” This is felt to represent a hypersensitivity reaction to nontuberculous mycobacteria growing in hot tubs, and presents with similar findings to hypersensitivity pneumonitis on imaging. On CT, findings include ground glass nodules and ground glass opacities, as well as air trapping on expiratory scans.
Lung cancer, bronchiectasis, fungal infection
Nontuberculous necrotizing pneumonia, lung cancer, fungal infection.
AN. Pulmonary tuberculosis: the essentials. Radiology. 1999;210:307-–322.
[PubMed: 10207408]
S, McAdams
HP, Batchu
CS. The many faces of pulmonary nontuberculous mycobacterial infection. AJR. 2007;189:177-–186.
[PubMed: 17579169]
CASE 8: OPPORTUNISTIC INFECTION
A 35-year-old male with history of HIV and CD4 count of 70 presents with acute onset of shortness of breath and cough for 2 days.
Pneumocystis pneumonia (PCP)
Initially PA and lateral views of the chest (Figs. C8.1–C8.5). Chest CT may be helpful as well.
Fig. C8.1
Pneumocystis pneumonia. (A) PA chest x-ray demonstrates diffuse bilateral reticular opacity in a perihilar distribution. The patient had a history of HIV. (B) Axial chest CT in a different patient demonstrates bilateral patchy ground glass opacities with reticular opacities as well. A pneumatocele is demonstrated (white arrow). Rupture of pneumatoceles can cause pneumothorax. (C) A different patient. PA view of the chest demonstrates faint bilateral interstitial opacities in a patient with HIV. (D) Same patient as C, axial chest CT in lung windows demonstrates bilateral patchy ground glass opacity. BAL samples demonstrated Pneumocystis jiroveci. (E) PA chest x-ray demonstrates interstitial and patchy faint airspace opacities in another HIV patient. (F) Axial chest CT from the same patient as E demonstrates patchy ground glass opacities, although less impressive than in (D).

Fig. C8.2
Airway-invasive aspergillosis. (A) Initial chest radiograph from a 25-year-old female with discoid lupus on chronic immune suppression demonstrates bilateral diffuse reticulonodular opacities. (B) Chest CT demonstrates patchy clusters of nodular opacities, predominantly centrilobular in nature, demonstrating a “tree-in-bud” pattern in some places. This pattern is nonspecific and represents impaction of small terminal airways with mucus and/or pus. In this patient, BAL samples eventually grew Aspergillus terreus. This appearance is most consistent with an airway invasive pattern of aspergillosis, although not specific. Similar appearance can be seen with mycobacterial, viral or atypical pneumonias, or other fungal pneumonias.
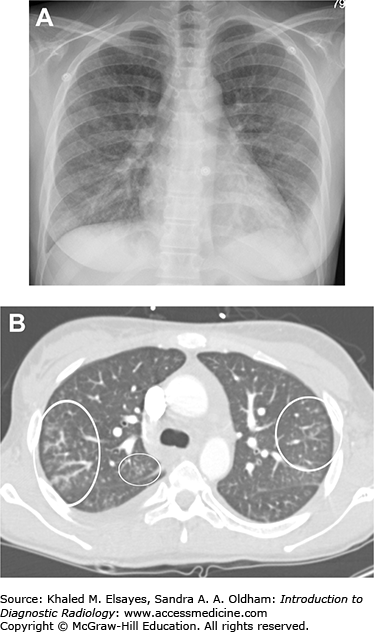
Fig. C8.3
Mycetoma. (A) Scout image from CT scan demonstrates a heterogeneous rounded lesion in the left upper lobe with internal lucencies and surrounding crescent of air (black arrowheads). (B) Chest CT demonstrates a heterogeneous masslike lesion with internal foci of air surrounded by an air crescent nondependently (black arrowheads). The appearance is consistent with a mycetoma. If there was any doubt, the patient could be reimaged in the prone position and the mycetoma would shift position to remain dependent.
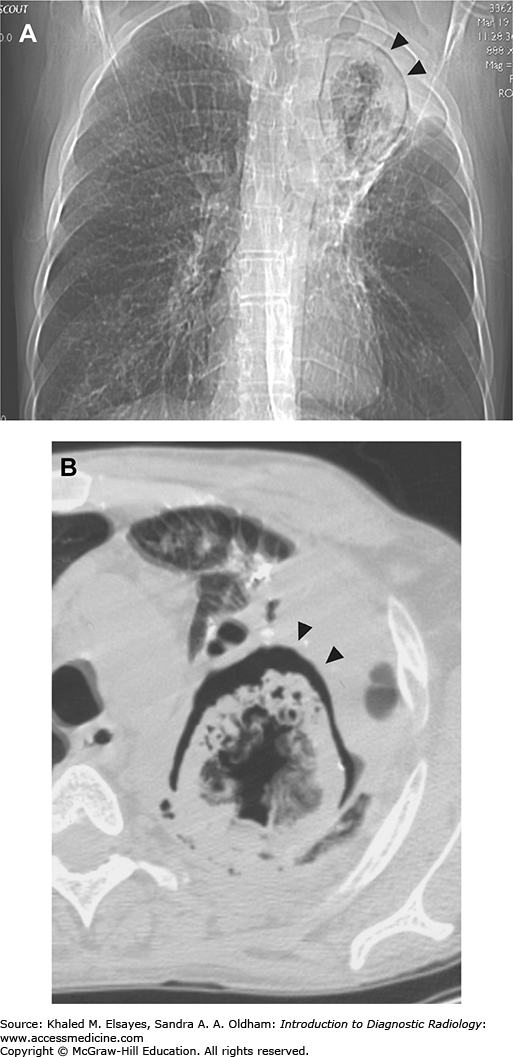
Fig. C8.4
Cryptococcal pneumonia and disseminated cryptococcosis. (A) Portable AP chest radiograph demonstrates an ill-defined opacity that partially obscures the right heart border, suggesting right middle lobe consolidation. The patient presented with hemoptysis and had a history of HIV. He had been noncompliant with HAART medication for several years, and his CD4 count was 35. (B) Chest CT demonstrates patchy consolidation in the right middle lobe, as well as a few nodular opacities (black arrows). Note how this abuts the right heart border, which was obscured on the x-ray as well. This appearance is suspicious for infection, although bacterial, fungal or mycobacterial etiologies would all be possible in this clinical setting. (C) Axial CT section through the upper abdomen demonstrates numerous nonspecific hypodense lesions in the liver. Differential diagnosis would include cysts, metastases or fungal abscesses. Serum cryptococcal antigen was positive, and disseminated cryptococcosis was diagnosed.

Fig. C8.5
Fungal pneumonia and Nocardia. (A) Frontal chest radiograph demonstrates a nodular opacity in the right upper lung zone (white arrow). The patient was recently status post bone marrow transplant and had chest pain. (B) Chest CT demonstrates a spiculated right upper lobe nodule (white arrow). Given the clinical history, fungal infection was favored, although a malignancy would have a similar appearance. Bronchoscopy revealed fungal hyphal elements, although a specific organism was not isolated. Empiric antifungal therapy was initiated. (C, D) Follow-up CT scans demonstrate progressive involution of the nodule. (E) Axial section through the apices from the same exam as (D) demonstrates a new nodule in the left apex (white arrow). This was suspicious for a new infection since the old lesion appeared to be responding to treatment. (F) Short-term follow-up CT demonstrates rapid growth of the new left upper lobe nodule. Repeat bronchoscopy was performed, and cultures this time demonstrated Nocardia. (G) The patient was begun on antibiotics for Nocardia as well, and the nodule involuted. (H) Follow-up chest CT demonstrates growth and cavitation of the initial right upper lobe nodule. Upon further questioning, the patient admitted stopping taking antifungal medications secondary to nausea. (I) Antifungal therapy was restarted, and the lesion decreased in size and became more thin-walled.

PCP is typically seen in patients with AIDS who have a CD4 count of less than 200 cells/mm3 or are otherwise immune suppressed (ie, bone marrow transplant patients). On the frontal chest radiograph, the classic findings are perihilar reticular and ground glass opacities. If sufficiently large, thin-walled cysts (pneumatoceles) may be appreciated. If one of these cysts ruptures, pneumothorax may result. In fact, spontaneous pneumothorax can be the presenting finding in some patients. However, in some patients, the chest x-ray may be interpreted as normal and subtle findings may only be seen at CT. CT findings include fairly symmetric bilateral ground glass opacity with relative sparing of the periphery, and there may be superimposed smooth interlobular septal thickening resulting in a “crazy-paving” pattern. It should be noted that this pattern is not specific for PCP, and may be seen in other entities such as pulmonary alveolar proteinosis, ARDS, and NSIP among others.
Smaller pneumatoceles may be seen that were not apparent on chest x-ray. A nuclear gallium-67 scan will demonstrate bilateral diffuse pulmonary uptake and is highly sensitive for the detection of PCP. However, it lacks specificity, as there may be pulmonary gallium-67 uptake in a variety of pulmonary infections and inflammatory processes. It is rarely performed nowadays.
Endemic mycoses (histoplasmosis, blastomycosis, and coccidioidomycosis) may affect both immunocompetent and immunocompromised hosts. Radiographically, there are many similarities between these infections. In acute pneumonia due to these organisms, consolidative opacities are commonly seen, and may contain air bronchograms. This pattern is indifferentiable from typical community acquired pneumonias. In more indolent cases, solitary or multifocal nodular opacities may be seen, which can be indifferentiable from malignancy. These nodules may go on to cavitate, in which case they often demonstrate an apical predominance that can mimic postprimary tuberculosis. There may be associated scarring with resultant parenchymal distortion and traction bronchiectasis. In some cases, reticulonodular opacities may be the predominant finding in endemic mycoses. In severe disseminated cases, a miliary pattern may be seen consisting of innumerable tiny nodules diffusely in both lungs. This is typically only seen in immunocompromised patients. Hilar and mediastinal adenopathy are more likely to be seen in cases of histoplasmosis and coccidioidomycosis as compared to blastomycosis. Definitive diagnosis of the various endemic mycoses is usually impossible on the basis of imaging alone, and the diagnosis ultimately rests on clinical and laboratory findings and identification of the causative organism in sputum or lavage samples, or FNA/biopsy specimens.
Aspergillus fumigatus can cause a spectrum of disease in the human host, and may affect either immune competent or immunocompromised hosts in differing capacities. Saprophytic aspergillosis is caused by growth of fungal elements within a preexisting lung cavity (most commonly due to prior tuberculous infection). Radiologically, this is demonstrated by the presence of a rounded mass within an existing cavity, typically with a crescent of air surrounding it (air crescent sign). If there is doubt about whether a lesion represents a cavitating nodule/mass or a mycetoma within a preexisting cavity, the patient can be imaged in different positions (ie, prone and supine). A mycetoma will be mobile and therefore move to the dependent portion of the cavity, whereas a cavitating nodule or mass will appear unchanged. Aspergillus can also cause disease due to a hypersensitivity reaction, termed allergic bronchopulmonary aspergillosis (ABPA). This is typically seen in long-standing asthmatics, and is manifest pathologically by plugs of inspissated mucus within proximal airways containing Aspergillus organisms as well as eosinophils. There may be peripheral eosinophilia in the blood as well. Radiologic findings include mucoid impaction and extensive proximal cylindrical bronchiectasis, typically with upper lobe predominance. Mucus plugs may be of high density due to extensive inspissations, and sometimes calcification may be seen. Semi-invasive aspergillosis is characterized by chronic necrotizing granulomatous inflammation, and typically infects chronically debilitated or mildly immunocompromised patients. Radiologic findings include slowly progressive consolidative or nodular opacities which may cavitate and which may progress over months to years. The findings may resemble postprimary tuberculosis. Angioinvasive aspergillosis is typically seen in severely immunocompromised patients and is caused by invasion of small to medium-sized pulmonary arteries leading to hemorrhagic infarcts. At CT, these infarcts classically present as nodular opacities surrounded by a zone of ground glass attenuation (hemorrhage), termed the “halo sign.” However, this is nonspecific and may be seen in several other entities such as Kaposi’ sarcoma, hemorrhagic metastases, as well as other causes. They may also present as pleural-based wedge shaped opacities, similar to classical lung infarcts.
Cryptococcus neoformans may infect both immune competent and immunocompromised hosts. Infections in immune competent patients are often asymptomatic, while disseminated disease may occur in immunocompromised patients. Typical radiographic patterns are nonspecific as with other fungal infections, and include single or multiple nodules or masslike opacities or consolidative opacities. Nodules or masses may go on to cavitate in immunocompromised hosts. Pleural effusions and hilar and/or mediastinal adenopathy are also more common in immunocompromised hosts.
The differential diagnosis for pneumonia in the immunocompromised patient is long, including bacterial, fungal, and viral etiologies.
Depends on the radiologic findings. Differential diagnosis for “crazy paving” includes PCP, sarcoidosis, AIP, diffuse hemorrhage, and pulmonary alveolar proteinosis. When fungal pneumonias present with consolidative opacities, bacterial pneumonia is in the differential. When presenting as solitary to multifocal nodules or masses, malignancy and lymphoma may be in the differential diagnosis, and when a miliary pattern is seen, TB, metastases, and viral pneumonia should be in the differential diagnosis.
T, Muller
NL, Gimenez
A,
et al. Spectrum of pulmonary aspergillosis: histologic, clinical, and radiologic findings. RadioGraphics. 2001;21:825-–837.
[PubMed: 11452056]
W, Washington
L, Kumar
N. Imaging manifestations of blastomycosis: a pulmonary infection with potential dissemination. RadioGraphics. 2007;27:641-–655.
[PubMed: 17495283]
SE, Erasmus
JJ, Volpacchio
M. “Crazy-paving” pattern at thin-section CT of the lungs: radiologic-pathologic overview. RadioGraphics. 2003;23:1509-–1519.
[PubMed: 14615561]
HP, Rosado-de-Christenson
ML, Lesar
M. Thoracic mycoses from endemic fungi: radiologic-pathologic correlation. RadioGraphics. 1995;15:255-–270.
[PubMed: 7761632]
HP, Rosado-de-Christenson
ML, Templeton
PA. Thoracic mycoses from opportunistic fungi: radiologic-pathologic correlation. 1995;15:271-–286.
CASE 9: SEPTIC EMBOLI
A 30-year-old male with history of IV drug abuse presents with fever, cough, and chest pain.
Septic pulmonary emboli
Initial PA and lateral chest x-ray; CT may be helpful as well (Figs. C9.1 and C9.2).
Fig. C9.1
Infected pacemaker lead with septic emboli. (A) Frontal chest x-ray demonstrates numerous cavitary lesions (white arrow). They are present bilaterally, although there are more in the right lung. (B) Axial chest CT from the same patient demonstrates multiple cavitary nodules, as well as some smaller nodules that have not cavitated yet. The patient had an infected pacemaker lead that was the source of the emboli.
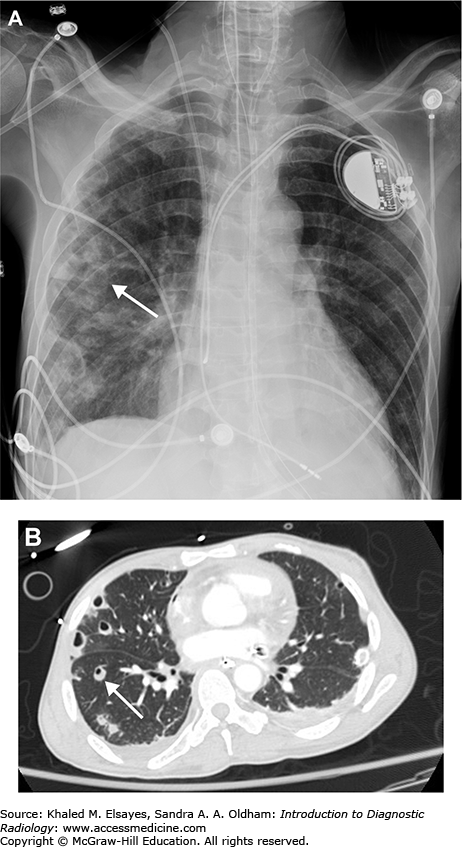
Fig. C9.2
Superficial thrombophlebitis and septic emboli. (A) Axial chest CT demonstrates a small cavitary lesion with mildly thick walls in the left upper lobe (white arrow). (B) CT of the neck demonstrates thrombosis of a superficial neck vein that is nonenhancing, expanded, and peripherally enhancing (white arrow). These findings are indicative of superficial thrombophlebitis, which was felt to be the source of the emboli. The patient had pharyngitis and was admitted for high fever and altered mental status as well as swelling in the neck related to the thrombophlebitis. This is similar to Lemierre’s syndrome, in which severe bacterial pharyngitis causes septic thrombophlebitis of the internal jugular vein, which can then cause septic pulmonary emboli as well as showering septic emboli elsewhere in the body. In this case, however, a superficial vein was involved rather than the internal jugular vein. Blood cultures grew alpha-hemolytic streptococcus.

Septic emboli develop when embolic fragments to the lung contain microorganisms. Typical sources include line infections, tricuspid valve endocarditis, and IV drug use. Septic pulmonary emboli represent hematogenous or blood-borne infection to the lungs, different from bronchogenic infections such as pneumonia. Positive blood cultures are frequently found. Bacterial and fungal etiologies are both possible. Radiographically, there will be multiple nodules, which may be of similar sizes if they were the result of a single embolic shower, or of varying sizes if there are multiple embolic events. The nodules are often large and cavitated, containing air-fluid levels. Rupture of one of these cavities into the pleural space results in empyema, pneumothorax, or a combination of both. There is typically a lower lobe predominance due to the increased blood flow to the lung bases. CT findings are essentially the same as at chest x-ray, with the exception that smaller lesions will be more apparent. Also, occasionally a pulmonary artery branch may be seen leading up to some of the lesions, termed the “feeding vessel” sign. In uncomplicated cases, CT may not be necessary, as the diagnosis is often readily made based on the chest x-ray and clinical setting alone.
Pneumonia, coronary vasospasm, pulmonary embolism
Cavitary metastases, Wegener’s granulomatosis, laryngeal papillomatosis. Cavities with a thicker, more irregular, and nodular wall tend to favor malignancy, but this is by no means pathognomonic, and correlation with clinical findings and/or biopsy is necessary.
IG, Burney
K. Radiology of recreational drug abuse. RadioGraphics. 2007;27:919-–940.
[PubMed: 17620459]
D, Lee
KS, Franquet
T,
et al. Thrombotic and nonthrombotic pulmonary arterial embolism: spectrum of imaging findings. RadioGraphics. 2003;23:1521-–1539.
[PubMed: 14615562]
CASE 10: ATELECTASIS
A 76-year-old male with extensive smoking history presents with shortness of breath and decreased breath sounds over the left upper lung.
Lobar collapse
Chest x-ray, PA and lateral views (Figs. C10.1–C10.7)
Fig. C10.1
Differentiating subsegmental atelectasis from fibrosis. (A) Supine images from a chest CT demonstrate bilateral linear opacities at the lung bases. (B) Prone images obtained during the same session do not show these same opacities, indicating that they represent subsegmental (or discoid/platelike) atelectasis. This typically occurs in dependent regions of the lung and can be differentiated from early fibrotic changes by imaging in the prone position, as in this case. Atelectatic changes will typically resolve in the prone position, while true fibrotic changes will remain unchanged. (C) Supine and (D) prone images from a different patient than (A) and (B) demonstrate bibasilar reticular opacities that did not change between supine and prone imaging, indicating fibrosis.

Fig. C10.2
Compressive atelectasis. There is a right pleural effusion (Eff) with compressive atelectasis of the right lower lobe (white arrowheads). Note the uniform enhancement of the atelectatic lung, which helps to differentiate it from consolidated lung, which would not enhance. An area of subsegmental atelectasis is also noted at the left lung base (white arrow).
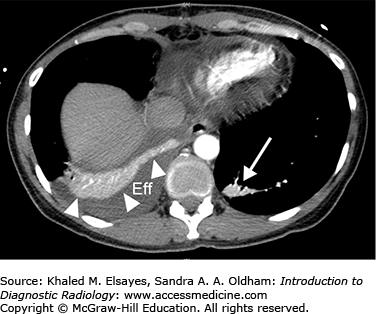
Fig. C10.3
Central mass (squamous cell carcinoma) with left upper lobe collapse. (A) Frontal radiograph demonstrates hazy left upper lung zone opacity with a concave border (black arrow) which is consistent with left upper lobe collapse. There is also a convex border-forming structure projecting over this same area, suggesting an underlying mass, which also results in tracheal compression (white arrows). (B) Lateral radiograph demonstrates concave border of the collapsed left upper lobe with anterior displacement of the major fissure (black arrow). Convex border of the underlying mass is seen more posteriorly (white arrow). The lateral view is somewhat limited by rotated positioning. (C) Axial contrast-enhanced chest CT at the level of the aortic arch demonstrates a heterogeneous centrally located mass (white arrow) abutting the aorta. There is atelectatic lung anterior to the mass, which contains normal appearing pulmonary vessels (black arrows), although the heterogeneous attenuation of this lung suggests post obstructive pneumonitis or pneumonia. (D) Coronal CT section with lung widows demonstrates high-grade stenosis of the left main bronchus, and the left upper lobe bronchus is not visualized, as it is completely occluded. Note tracheal compression by the medially displaced aortic arch. (E) Coronal CT section in soft tissue windows demonstrates the collapsed left upper lobe responsible for the concave shadow on the frontal chest radiograph. Normal pulmonary vessels are annotated (black arrowheads). Heterogeneous attenuation of this lung again suggests post obstructive pneumonitis or pneumonia. (F) Another coronal CT section in soft tissue windows more posteriorly than (E) demonstrates the mass responsible for the convex border on the radiographs. Note the lack of normal pulmonary vessels in the mass as compared to the atelectatic lung in (E).

Fig. C10.4
Right upper lobe collapse. Frontal chest radiograph demonstrates streaky perihilar opacities consistent with viral bronchiolitis in this child. There is a hazy concave bordered opacity in the right upper lung zone consistent with right upper lobe collapse. There is subtle elevation of the medial portion of the right hemidiaphragm, as well as rightward mediastinal shift due to volume loss.
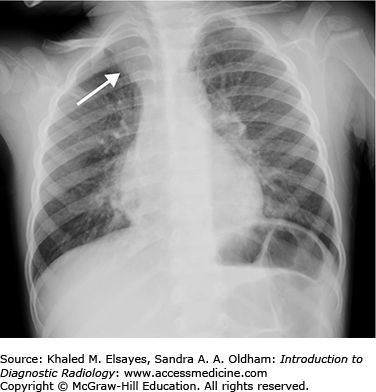
Fig. C10.5
Collapse of the medial basal segment of the right lower lobe. Frontal chest radiograph demonstrates a hazy triangular shaped opacity that does not obliterate the right heart border. Lateral chest radiograph demonstrates a triangular opacity (black arrows) bordered anteriorly by the major fissure. This could easily be confused for RML collapse, but the right heart border would usually be obscured in RML collapse, and more important the RML would be bordered posteriorly by the major fissure on the lateral view instead of anteriorly.

Fig. C10.6
Right upper lobe collapse due to obstructing hilar mass (undifferentiated large cell carcinoma). (A, B) Initial PA and lateral chest radiographs demonstrate lobulated contour and increased opacity of the right hilum suspicious for an underlying mass. Hazy opacity along the right heart border on the PA view may be due to post obstructive pneumonitis and/or atelectasis, however, the patient was lost to follow-up. (C) Scout view from CT scan obtained approximately four months later when the patient re-presented. There is opacification of the right upper lung zone with a centrally convex border (white arrow) which suggests an underlying mass. Note how the combination of a central convex border with a more peripheral convex border forms a reverse S configuration; this is known as the S sign of Golden. There is rightward tracheal and mediastinal shift with elevation of the right hemidiaphragm indicating volume loss. The overall picture is consistent with RUL collapse secondary to an obstructing mass. Additionally, the right main bronchus is cut off (black arrow). (D) Coronal contrast-enhanced chest CT with narrowed window/level settings demonstrates an enhancing right hilar mass (white arrows) invading the mediastinum and occluding the right main bronchus. Compare this to the scout view. (E) Axial contrast-enhanced CT demonstrates enhancing right hilar mass (white arrow) invading the mediastinum (black arrow). Black arrowhead denotes a highly stenotic left upper lobe bronchus. White circle denotes atelectatic lung anteriorly with air bronchograms. Lack of enhancement in this lung suggests post obstructive pneumonitis or pneumonia. Small right pleural effusion is also present (white arrowhead). (F) Coronal section more anterior than D demonstrates atelectatic LUL containing lucent bronchi and pulmonary vessels. Note the smooth, concave border.

Fig. C10.7
Round atelectasis. (A) There is a nodular opacity at the left lung base (black circle). Note the comet tail (black arrow). The patient had had a pleural effusion earlier, and the opacity developed after the pleural effusion resolved. This is a typical appearance for round atelectasis. (B) PET scan demonstrates lack of FDG uptake in the lesion, consistent with the diagnosis.

The term atelectasis refers to collapse of alveoli, with resulting volume loss. Mechanistically, atelectasis may be either resorptive, compressive, or cicatricial. Resorptive atelectasis is secondary to an obstructing endobronchial lesion with resorption of air distal to the obstruction and resulting volume loss. Compressive atelectasis is volume loss due to compression from an adjacent space-occupying lesion, often a pleural effusion. Cicatricial atelectasis is volume loss due to parenchymal fibrosis. Morphologically, several types of atelectasis are recognized. Round atelectasis refers to a small round area of nonaerated lung due to overlying pleural adhesions that prevent it from expanding. There is often a “comet tail” representing the feeding bronchovascular bundle. Discoid or “platelike” atelectasis refers to areas of subsegmental atelectasis manifest by bandlike linear opacities. These are often seen at the lung bases due to the relatively poorer ventilation in these regions. When the areas of atelectasis involve larger portions of the lung, the terms segmental or lobar collapse are applied, depending on the anatomic extent of involvement. Classic patterns of lobar collapse can typically be diagnosed solely on the basis of chest radiographs, and the clinical scenario will dictate the most likely etiology. For example, collapse of an entire lung in a child is most likely due to an aspirated foreign body (although this more often presents with hyperinflation due to ball-valve effect). In the ambulatory adult patient, lobar collapse is a classic presentation of an obstructing bronchogenic carcinoma, while in the ventilated ICU patient it is most commonly due to a mucus plug.
The upper lobes typically collapse anteriorly and medially. On the right, elevation of the minor fissure may be seen on the frontal view, as well as right paratracheal density, elevation of the right hilum, and compensatory hyperinflation of the middle and lower lobe. On the lateral view, there may be anterior displacement of the major fissure and obliteration of the retrosternal clear space. Left upper lobe collapse may present with similar signs on the left, and classically there is a hazy veil-like opacity over the left hemithorax on the frontal view, with obscuration of the left upper cardiac border and aortic knob.
Right middle lobe collapse is often best demonstrated on the lateral projection, where there will be inferior displacement of the minor fissure and a triangular or band like opacity in the area of the right middle lobe with associated volume loss. On the frontal view, there may be obscuration of the right heart border and hazy opacity over the right lower lung zone which may have a triangular configuration. Of note, right middle lobe collapse is often seen in asthmatics, especially in children.
The lower lobes tend to collapse medially and posteriorly against the spine. On the frontal view, there may be a triangular opacity in the lower paravertebral region that obscures the medial portion of the diaphragm. There may be elevation of the diaphragm secondary to volume loss, and there may also be compensatory hyperinflation of the upper lobe. On the lateral view, there will be a triangular opacity posteriorly with posterior displacement of the major fissure and obscuration of the posterior portion of the diaphragm.
Differential diagnoses for causes of lobar collapse include foreign body, mucus plug, and bronchogenic carcinoma.
Classic findings of lobar and segmental collapse may be confidently diagnosed radiographically. Subsegmental atelectasis may be more difficult to distinguish from early pneumonias, as there may not be an appreciable degree of volume loss. Round atelectasis may be difficult to distinguish from other causes of solitary pulmonary nodules, particularly malignancy and granulomatous or fungal infection.
Related posts:
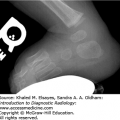
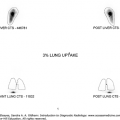
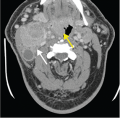

Stay updated, free articles. Join our Telegram channel

Full access? Get Clinical Tree


