Cerebral Ischemia and Infarction
Jeremy J. Heit
Michael P. Marks
Stroke is a commonly used but imprecise term that describes a frequently devastating clinical event—the sudden onset of a persistent neurologic deficit, usually secondary to blockage or rupture of a cerebral blood vessel. Stroke is the fourth leading cause of death in the United States after myocardial infarction, cancer, and chronic lower respiratory disease (1,2) and is already among the top five causes of lost life years in high- and middle-income countries worldwide, according to World Health Organization (WHO) estimates. The WHO further predicts that, by 2030, developing nations will also count stroke among its top causes of disease and disability. It is the number one cause of adult disability in the United States, leaving about 70% of survivors with difficulty in working or performing the basic tasks of everyday life (3). The societal cost of stroke in the United States alone has been estimated at greater than US$50 billion per year (3).
The clinical entity of stroke has many different causes, with different diagnostic workups, different treatments, and different prognostic implications. Imaging has played an important role in the evaluation of the stroke patient for several decades. Initially imaging was used to exclude other diagnoses and evaluate for surgically amenable lesions. That role has changed dramatically over the last two decades and continues to evolve. A new era in stroke management has emerged, centered on treating very early cerebral infarction with medical and endovascular therapies. Moreover, time is of the essence, since significant brain destruction occurs very early in the time course of ischemia (Table 12.1). Owing to the critical impact of imaging on treatment decisions, many would agree that aside from immediate stabilization of the stroke patient, imaging now takes precedence over everything else. Advances in magnetic resonance imaging (MRI) specifically show that high sensitivity for detection of very early (now termed “hyperacute”) infarction has become part of clinical scanning protocols. Moreover, these techniques (particularly diffusion and perfusion MR) can characterize ischemic brain parenchyma with the potential to distinguish dead from salvageable tissue. Advances in computed tomography (CT) technology also show great promise for evaluating brain perfusion and have implications for identifying potentially recoverable but ischemic brain tissue in the face of cerebrovascular compromise. This critical distinction—dead tissue from salvageable tissue—promises to change treatment algorithms dramatically.
The symptomatology of stroke presenting through the emergency room has three main etiologies: ischemic cerebral infarction, intraparenchymal hemorrhage, and subarachnoid hemorrhage. Ischemic infarction due to inadequate cerebral blood flow is the most common case of stroke and is the main topic covered in this chapter. Cerebral blood flow is responsible for the continuous replenishment of metabolic requirements and removal of byproducts to and from the brain. Although cerebral blood flow is physiologically complex, the physiologic requirements placed on it are relatively straightforward. Normal cerebral blood flow implies normal delivery of blood to the brain with an adequate concentration of oxygen and glucose. When brain perfusion falls below certain critical levels, ischemia develops. This results in a loss of neuronal function, and ischemia becomes clinically apparent with the sudden development of a neurologic deficit. If a perfusion deficit lasts long enough or if it is profound enough, the ischemic episode results in cerebral infarction. Infarction results in a pathologic change marked by neuronal and glial cell death.
Imaging of the ischemic infarction can be performed at various times after the onset of the ischemic episode. This extends from a hyperacute period, that is, minutes to hours after the start of ischemia, to a chronic period, that is, months to years after an infarction. Conventional CT and MR have both been used to image the patient with infarction. Recently, physiologic protocols have been developed to enhance the conventional imaging sequences used in CT and MR. These include diffusion and perfusion imaging with MR and perfusion and cerebral blood flow evaluation with CT. In addition, CT and MR are
often augmented by noninvasive vascular imaging (CT angiography or MR angiography [MRA]) to obtain a more complete assessment of the ischemic patient.
often augmented by noninvasive vascular imaging (CT angiography or MR angiography [MRA]) to obtain a more complete assessment of the ischemic patient.
TABLE 12.1 Estimated Pace of Neural Circuitry Loss in Typical Large Vessel, Supratentorial Acute Ischemic Stroke | ||||||||||||||||||||
|---|---|---|---|---|---|---|---|---|---|---|---|---|---|---|---|---|---|---|---|---|
| ||||||||||||||||||||
TABLE 12.2 Emergent Evaluation in Acute Stroke | ||||||
|---|---|---|---|---|---|---|
|
CT has been in more widespread use for the evaluation of the hyperacute and acute stroke patient. CT scanners are often situated adjacent to emergency departments and traditionally have been less expensive to operate and more widely available. Imaging-related triage and management decisions in early stroke patients are often based on CT findings. In many centers, CT still serves as the basis of therapeutic decisions based upon the extent of infarcted territory and the identification of intracerebral hemorrhage. However, advanced MR techniques have far greater sensitivity for defining the presence of early infarction than conventional CT; beyond that, these MR techniques provide unique information that is likely to be highly important to early stroke management. Specifically, diffusion and perfusion MR have already proven to be valuable tools when used to evaluate the patient with an acute ischemic event. Recent studies suggest a growing role for MR in the emergency setting, particularly when acute-phase therapy is contemplated. Along with the evidence for using MR in the acute setting of stroke, MR units are becoming more available to emergency departments in many institutions. It should also be noted that MR is more sensitive in the detection of edema, provides multiplanar views, and lacks beam-hardening artifact when compared with CT. In addition, MRI has been shown to be equally or even more sensitive for the detection of intracerebral hemorrhage. MR has, therefore, become the imaging modality of choice when evaluating the patient with subacute and chronic ischemic changes in many stroke centers equipped for state-of-the-art stroke management. If availability was equal, MR might replace CT as the imaging modality of choice for triage of all emergency stroke patients because it will likely provide answers to the major questions involved in the emergent evaluation of acute stroke patients (Table 12.2). On the other hand, CT scanning has also dramatically evolved with the advent of multislice technology, CT angiography, and CT perfusion techniques. CT perfusion and dynamic CTA may ultimately replace MRI for distinguishing salvageable ischemic tissue from already infarcted brain. The ultimate impact of CT may be significantly influenced by radiation dose concerns. Moreover, a host of other factors have significant influence on medical technology and imaging, particularly economic factors. These also determine access and utilization of these tools in stroke. This chapter focuses on MRI, but the debate has yet to fully resolve.
Pathophysiology of Cerebral Ischemia
To understand the sequence of imaging changes that occur after an ischemic insult and the time course of these changes, it is critical to understand the pathophysiologic events that ensue after a drop in cerebral blood flow below critical levels (Fig. 12.1). Normal cerebral blood flow is in the range of 50 to 55 mL/100 g brain tissue/min. Experimental models have demonstrated that neuronal electrical activity ceases within seconds of arterial occlusion (4). Experimental stroke models have also shown that this loss of function generally occurs when the cerebral blood flow falls to a level of 15 to 20 mL/100 g/min (5,6,7). Similar observations have been made in humans, when drops in blood flow to this range during carotid endarterectomy cause flattening of the electroencephalogram (8,9). However, as shown in Figure 12.2, a loss of function due to ischemia can be reversible. The window of opportunity for reversing ischemic symptoms is directly related to the level to which the blood flow has dropped. A severe perfusion deficit with cerebral blood flow values below 10 mL/100 g/min may lead to infarction within a matter of minutes, whereas more moderate levels of ischemia (10 to 20 mL/100 g/min) may be reversible for a period of hours after the start of the ischemic insult (10).
 FIGURE 12.1 Ischemia damage dependence on cerebral blood flow, estimates (these are variable and highly time-dependent). |
Along with electrical failure, the cell develops hypoxemia, which leads to mitochondrial dysfunction, impaired oxidative metabolism, and depletion of cellular adenosine triphosphate (ATP) in the first hour after the onset of ischemia (11,12). The decrease in cellular ATP levels results in energy depletion, and membrane potential cannot be maintained (12). The cell becomes depolarized, which leads to the release of glutamate into the extracellular space. This increase in glutamate in the extracellular space results in the activation of N-methyl-d-aspartate, α-amino-3-hydroxy-5-methyl-4-isoxazole propionic acid, and kainate receptors (13,14,15,16,17). Activation of these receptors leads to an influx of sodium and calcium ions (18,19). Cellular or cytotoxic edema ensues as water passively follows the sodium influx. Elevated intracellular calcium results in the activation of proteolytic enzymes, leading to the development of oxygen free radicals that promote tissue injury and disrupt mitochondrial membranes (12,18,19,20,21,22,23,24,25,26). Mitochondrial membrane disruption
results in cytochrome C release with subsequent activation of a caspase signaling cascade that leads to cellular apoptosis (12). Therefore, these neurochemical events set up a complex cellular cascade that results in lipolysis, proteolysis, cell necrosis inflammation, DNA fragmentation, and apoptosis after the loss of ion homeostasis (12,18,19,27,28).
results in cytochrome C release with subsequent activation of a caspase signaling cascade that leads to cellular apoptosis (12). Therefore, these neurochemical events set up a complex cellular cascade that results in lipolysis, proteolysis, cell necrosis inflammation, DNA fragmentation, and apoptosis after the loss of ion homeostasis (12,18,19,27,28).
 FIGURE 12.2 When local cerebral blood flow (LCBF) falls below 23 mL/100 mg, reversible paralysis occurs in this model. It also demonstrates that even when profound ischemia occurs, paralysis is reversible for a brief period. The time course depicted here may be somewhat different in humans undergoing infarction. These data were obtained from a primate model of reversible middle cerebral artery (MCA) occlusion. (Adapted from Jones TH, Morawetz RB, Crowell RM, et al. Thresholds of focal cerebral ischemia in awake monkeys. J Neurosurg 1981;54:773–782, with permission.) |
Cell depolarization is not observed until blood flow drops below 10 mL/100 g/min (29,30). This depolarization threshold implies that there are really two thresholds for ischemic changes (31), one occurring at 15 to 20 mL/100 g/min that results in loss of electric function and one at approximately 10 mL/100 g/min that results in cell depolarization. When a thromboembolic event occurs in the cerebrovascular circulation, the decline in regional cerebral blood flow is not uniform throughout affected brain parenchyma. This heterogeneity has been documented in experimental animal models and in humans (29,32). The blood flow to an infarcted zone has been depicted to have a central region or core of very low flow that results in rapid cell demise and a peripheral area where declines in flow are more moderate and cell death is not immediate (12,29,30,33). Microelectrode measurements have demonstrated the two regions in infarction with a central depolarized region and a peripheral zone that has lost electrical activity but not undergone anoxic depolarization (34,35). The peripheral area with a more moderate decline in flow can be a relatively large portion of the ischemic area. Autoregulation may be lost in this region, making it dependent on perfusion pressure and therefore inherently unstable (31).
Functionally, the ischemic tissue can be divided into three regions. The infarct core representing the dead or dying tissue is at the center of the infarction. The zone around the central core which may have lost electrical activity but has more moderate reductions in blood flow is defined as the penumbra. With reperfusion the penumbra may be salvageable, but without reperfusion it may go on to infarction (36,37). Surrounding the penumbra is tissue with mildly reduced blood flow, often called the oligemic region. This tissue is more likely to survive; however, this region too may go on to infarct if perfusion is further hemodynamically altered.
The pathology nomenclature for the temporal phases of infarction does not match the traditionally used terminology for the temporal evolution of infarction by imaging, and the terms used to describe pathologic evolution should not be assumed to literally translate into imaging findings. The gross pathologic changes after infarction generally proceed in three sequential stages (38,39). An initial acute period lasts for the first 2 days after the infarction in which gross examination demonstrates what appears to be normal tissue. This is followed by a subacute period during which there is a swelling and softening of the tissue with evidence of mass effect. This subacute period (with reference to pathology) generally extends for 7 to 10 days after the infarction, with maximal edema occurring at approximately 3 to 5 days. The chronic period extends from weeks to months after the infarction. During this time the infarcted tissue evolves into an area of encephalomalacia or cystic change.
Histologically, the infarcted cell initially displays pyknosis. This is followed by a breakdown of the membrane structures and disintegration into a granular appearance. Astrocytes and oligodendroglial and microglia cells undergo degeneration along with neurons in the regions of infarcted tissue (38,39). Next, liquefactive necrosis ensues with the appearance of inflammatory cells. The arrival of macrophages heralds the removal of cellular debris, setting the stage for the development of a well-defined cavitary region marked by encephalomalacia or a cerebrospinal fluid (CSF)–like fluid-filled cavity.
Many of the changes observed with MR are contingent on imaging abnormal accumulations of water that occur after brain injury. After the initial depolarization that occurs with ischemia, there is an influx of sodium and water, which passively follows the ionic influx. Cytotoxic edema begins within minutes after the onset of infarction. The overall tissue water content increases only 3% to 5% with the development of cytotoxic edema (7,40). In addition to the morphologic changes of the neural–glial tissue itself, ischemia alters the morphology and function of the cerebral vasculature. The capillary endothelium in the vasculature of the brain is responsible for maintenance of the blood–brain barrier and is more resistant to ischemic injury than the neuron (40,41,42). Loss of integrity of the blood–brain barrier is generally believed to begin 4 to 6 hours after the ischemic insult and lasts for approximately 3 to 5 days after the start of the infarction (5,40). With breakdown in the blood–brain barrier, vasogenic edema occurs, and proteins and water flood into the extracellular space from the intracellular environment. This results in much greater levels of tissue water and brain swelling. Vasogenic edema will maximally develop when residual flow is present or flow is re-established after the acute event to deliver these proteins and fluid to the extracellular space (41). After the peak of vasogenic edema (and mass effect), there is a gradual reabsorption of water and protein with resolution of the mass effect. In regions of chronic infarction, however, there are continued higher-than-normal levels of water content due to resulting cell loss and the development of encephalomalacia. These gross changes can be appreciated using conventional MR (Fig. 12.3).
Abnormal endothelium and consequent blood–brain barrier deficiency are present not only in the native cerebral blood vessels but also in the new blood vessels that form around the periphery of the infarction and grow inward during the reparative process. After a period of weeks, the endothelium usually
recovers to a more normal state with re-establishment of the integrity of the blood–brain barrier (43). Along with these morphologic changes of blood vessels, there are physiologic changes, including loss of autoregulation of adjacent blood vessels. Although cerebral infarction is generally associated with decreased cerebral blood flow and cerebral blood volume, there may be areas of abnormally increased cerebral blood flow and cerebral blood volume (“luxury perfusion”) in ischemic areas around the margins of the lesion (44).
recovers to a more normal state with re-establishment of the integrity of the blood–brain barrier (43). Along with these morphologic changes of blood vessels, there are physiologic changes, including loss of autoregulation of adjacent blood vessels. Although cerebral infarction is generally associated with decreased cerebral blood flow and cerebral blood volume, there may be areas of abnormally increased cerebral blood flow and cerebral blood volume (“luxury perfusion”) in ischemic areas around the margins of the lesion (44).
 FIGURE 12.3 Evolution of infarction. Axial T2-weighted images (top row) during the acute phase of infarction demonstrate high signal intensity (edema) in the medial aspect of the right temporal lobe. There is mild mass effect as demonstrated by effacement of the sulci and compression of the atrium of the right lateral ventricle. Axial T2-weighted images (middle row) and fluid-attenuated inversion recovery images (bottom row) demonstrate the infarction 1 year later. Areas of encephalomalacia and cystic change are now appreciated along with widening of the sulci and compensatory enlargement of the atrium of the right lateral ventricle (arrowheads). |
Ischemic Stroke Subtypes
Approximately 80% of strokes in the United States are due to ischemic cerebral infarction (45). Ischemic stroke increases in frequency with aging, approximately doubling with every decade. Infarction, however, does occur in the pediatric population and in the young adult. Several risk factors besides age and gender have been described that predispose to stroke (44): hypertension, diabetes mellitus, a history of smoking, underlying cardiac disease, and elevated levels of cholesterol and lipids.
A number of classification systems for ischemic stroke have been proposed. The most commonly used clinical systems divide ischemic stroke into three major stroke subtypes: large-artery or atherosclerotic infarctions, cardioembolic infarctions, and small-vessel or lacunar infarctions. This general classification scheme has been shown to have good interobserver agreement when making a specific etiologic diagnosis of stroke, although large numbers of patients often cannot be clearly categorized. Clinical studies may refer to this as the TOAST classification because it was adopted for the clinical evaluation of patients participating in a trial of a low–molecular weight heparinoid, the Trial of Org 10172 in acute stroke treatment (46). Accurate determinations of the relative frequencies of these stroke subtypes are difficult to assess because incidence varies from study to study. In addition, it can be difficult in some clinical settings precisely to determine the stroke subtype, and many clinical strokes are reported to be of undetermined etiology (47). In large series the incidence of large-artery or atherosclerotic infarction can vary from 15% to 40%, cardioembolic strokes from 15% to 30%, and lacunar infarctions from 15% to 30% of the infarctions reported (48). The use of MR with diffusion-weighted imaging (DWI) and MRA in the acute period after ischemic stroke may well refine clinical diagnostic accuracy (48). There is a relationship between stroke subtype using TOAST criteria and the DWI lesion pattern seen on MRI, which may help to identify the cause of stroke in some patients (49,50).
Large-Artery or Atherosclerotic Infarction
Atherosclerotic infarction can result from thrombosis directly at the site of the atherosclerotic plaque or from emboli produced at the plaque that lodge downstream, causing an artery-to-artery embolism. The most common site for atherosclerotic plaque formation is at the carotid bifurcation with involvement of the distal common carotid artery and the first 2 cm of the internal carotid artery. Identification of significant atherosclerotic plaque at this site (or any site), however, does not establish the etiology for stroke. It is true that a prospective trial, the NASCET study, did establish a high rate of stroke in patients with symptomatic carotid stenosis of greater than 70% (51). However, approximately 45% of the strokes in the territory of the symptomatic stenosis appear to be cardioembolic or small-artery strokes unrelated to the carotid stenosis (52,53,54,55,56).
Other more common sites for atherosclerotic plaque formation include the carotid siphon region and the proximal portions of the anterior and middle cerebral arteries. In the vertebrobasilar circulation, the most common extracranial site is the origin of the vertebral artery. Other sites of frequent involvement include the subclavian artery, the most distal portion of the vertebral artery, and the basilar artery.
In addition to atherosclerosis, there is a host of other, less common causes of large-artery thromboembolic stroke. These can be associated with an underlying vasculopathy or with a hematologic etiology. Vasculopathies can result from infectious and noninfectious arteritis. A host of bacterial fungal and viral organisms has been implicated; note that any inflammation in the subarachnoid space can cause an occlusive vasculitis. In addition, immune-related diseases such as systemic lupus erythematous, scleroderma, and systemic necrotizing vasculitides can lead to large-artery infarction.
Arterial dissection is a fairly common cause of large-artery infarction in a younger age group than that commonly associated with significant atherosclerotic disease. The diagnosis of dissection should be actively sought as an etiology in any young adult with infarction, particularly posterior fossa infarctions, and regardless of whether significant trauma is part of the initial history. Even seemingly nontraumatic events involving movements of the neck, particularly chiropractic manipulation, as well as self-induced neck movements to relieve neck ache, sudden turns, repeated sneezing, swimming, and other minor incidental impacts can be associated with dissection and secondary infarction (Fig. 12.4). Aside from trauma, diseases that predispose to dissection include fibromuscular dysplasia (FMD) and collagen vascular diseases (e.g., Ehlers–Danlos or Marfan syndrome).
Hematologic causes of stroke include conditions that cause hyperviscosity or lead to a hypercoagulable state. A number of etiologies predisposing to hypercoagulable state have been identified, including oral contraceptive use, pregnancy and the postpartum period, and deficiencies of protein C, protein S, or antithrombin III. In addition, a number of medical illnesses, such as paraneoplastic syndromes and lupus erythematosus, are associated with hypercoagulable states. A discussion of all the etiologies that relate to large-artery stroke is beyond the scope of this chapter, and readers are referred to other sources for more complete reviews (52,53,54,56).
Cardioembolic Infarction
Cardioembolic stroke is the next most frequent cause of cerebral infarction. There are several possible etiologies for cardioembolic strokes. They may occur in the setting of relative cardiac blood stasis, resulting in mural thrombus formation. Examples of this setting include myocardial infarction, ventricular aneurysm, atrial fibrillation or flutter, and cardiomyopathy. Cardioembolic stroke can also occur in the setting of valvular heart disease with the development of valvular vegetations or with the use of prosthetic mitral or aortic valves. Cardiac tumors represent another etiology for cardioembolic stroke. Patients with congenital heart disease and right-to-left shunts also have a higher incidence of cardioembolic stroke. Many of these cardiac conditions are seen in more atypical settings such as in ischemic stroke of the young (53).
Small-Vessel or Lacunar Infarction
Small-artery occlusions resulting in infarction are often referred to as lacunar infarctions. These are deep subcortical infarctions that generally involve perforating arteries that supply regions such as deep gray matter and brainstem. Lacunar infarctions are generally less than 1 cm and not larger than 1.5 cm in diameter (57). Nearly all lacunar infarctions demonstrate cavitation on follow-up MR performed at 1 month to 2 years after presentation (58,59), which is best appreciated on T1-weighted
sequences (59). In the anterior circulation, the perforating arteries are usually the lenticulostriate arteries. In the posterior circulation they are the thalamoperforating arteries and small perforating arteries from the main stem of the basilar artery. Lacunar infarctions are predominantly in the basal ganglia, the white matter of the internal capsule, the brainstem, and the deep white matter of the hemispheres. Perforating arteries responsible for lacunar infarctions have been demonstrated to have microatheromata, lipohyalinosis, and fibrinoid necrosis (57,60,61). Many of these pathologic changes have been attributed to hypertension, and a high percentage of patients with lacunar infarctions have hypertension. Patients with diabetes mellitus also are predisposed to the development of these small, deep infarctions (62,63,64,65).
sequences (59). In the anterior circulation, the perforating arteries are usually the lenticulostriate arteries. In the posterior circulation they are the thalamoperforating arteries and small perforating arteries from the main stem of the basilar artery. Lacunar infarctions are predominantly in the basal ganglia, the white matter of the internal capsule, the brainstem, and the deep white matter of the hemispheres. Perforating arteries responsible for lacunar infarctions have been demonstrated to have microatheromata, lipohyalinosis, and fibrinoid necrosis (57,60,61). Many of these pathologic changes have been attributed to hypertension, and a high percentage of patients with lacunar infarctions have hypertension. Patients with diabetes mellitus also are predisposed to the development of these small, deep infarctions (62,63,64,65).
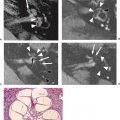
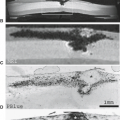
 FIGURE 12.4 Left internal carotid artery dissection resulting in acute infarction in a post-partum female with fibromuscular dysplasia. An area of acute infarction in the left frontal operculum is seen as high signal on diffusion-weighted imaging (A), low signal on the apparent diffusion coefficient maps (B), and high signal on fluid-attenuated inversion recovery (C). An axial T1 image with fat-saturation demonstrates hyperintense thrombus in the wall of the cervical left internal carotid artery (D, arrow). Coronal maximum intensity projection (MIP) images from a contrast enhanced MR angiogram (MRA) of the neck shows abrupt narrowing and occlusion in the proximal cervical left internal carotid artery, corresponding the site of dissection (E, arrow). Vessel irregularity within the cervical left vertebral artery is present and corresponds to changes of fibromuscular dysplasia (E, arrowheads). Coronal MIP images from a time-of-flight MRA of the head demonstrate no flow-related signal within the distal cervical or intracranial left internal carotid artery (F). The left anterior and middle cerebral arteries are reconstituted by flow through a patent anterior communicating artery (F). |
The clinical presentation of the patient with lacunar syndrome can be quite variable depending on the location of the event. Fisher defined a series of five classic lacunar syndromes based on clinical presentation (66,67,68,69). However, the lacunar syndrome is a poor predictor of a causative lacunar infarction (70), and diffusion-weighted MR has been useful in confirming the neuroanatomic location of infarctions in patients presenting with lacunar syndromes (70,71). Pure motor hemiplegia in which the patients have a motor deficit without other loss of neurologic function is the most common lacunar syndrome. The next most common syndrome is a sensorimotor stroke marked by a unilateral weakness with loss of proprioceptive and pain sensation in the same distribution. The other three classic lacunar syndromes are ataxic hemiparesis, dysarthria-clumsy hand syndrome, and pure sensory stroke. In general, the prognosis for lacunar infarctions is better than that of patients with large-vessel infarctions, with a high percentage of patients remaining functionally independent after these strokes (72).
Small-vessel infarctions can also be a manifestation of other nonatherosclerotic etiologies, including vasculopathies associated with collagen-vascular disease, vasculitides (infectious or noninfectious), meningitis, cerebral autosomal dominant arteriopathy with subcortical infarcts and leukoencephalopathy (CADASIL), and even dissection. Other MR findings of small-vessel vasculopathy include white matter T2-hyperintense signal abnormality, microhemorrhage on gradient-recalled echo (GRE) sequences, and increased conspicuity of perivascular spaces (73,74). A small-vessel disease score based upon MR identification of these findings has been developed and may be useful in risk stratification of patients with microangiopathic changes (75).
Venous Infarction
Venous infarction should be considered in a wholly separate light from arterial infarction for several reasons: (a) venous infarction is associated with a wide variety of different etiologies;
b) the patient with a venous infarction often has a different clinical presentation, different demographics, and different clinical course than the patient with arterial infarction; and (c) the radiologist plays the critical role in making this diagnosis because symptoms of venous infarction are often nonspecific and the imaging findings can be confusing unless someone is specifically keyed in to the diagnosis. The single common pathway for venous infarction is venous thrombosis, which usually occurs in the major dural sinuses. Occlusion of single or multiple cortical veins can also underlie venous infarction, an etiology that can be elusive even with high-quality imaging and high clinical suspicion.
b) the patient with a venous infarction often has a different clinical presentation, different demographics, and different clinical course than the patient with arterial infarction; and (c) the radiologist plays the critical role in making this diagnosis because symptoms of venous infarction are often nonspecific and the imaging findings can be confusing unless someone is specifically keyed in to the diagnosis. The single common pathway for venous infarction is venous thrombosis, which usually occurs in the major dural sinuses. Occlusion of single or multiple cortical veins can also underlie venous infarction, an etiology that can be elusive even with high-quality imaging and high clinical suspicion.
Venous occlusion leads to increased venous and capillary pressure in the affected territory of drainage. After venous thrombosis there is also a decrease in CSF resorption of interstitial fluid, resulting in interstitial edema. If the venous occlusion is extensive enough, the edema and congestion will lead to a venous infarction. Typically, venous infarctions are accompanied by hemorrhage within the affected tissue, which is particularly frequent in the white matter or near the gray–white matter junction. This distribution stands in contrast to the cortical location of hemorrhage associated with most arterial infarctions and is often the primary clue to the diagnosis.
A host of associated conditions can lead to a venous thrombosis (76). These include local causes, with infections such as sinusitis or mastoiditis being the most common, particularly in the pediatric population. It is true that local extension of tumors, such as meningiomas and metastatic tumors to the dura, can cause venous occlusion, but this is not commonly a cause of acute venous infarction. In addition to local causes, associated systemic conditions can include dehydration, pregnancy and puerperium, and nephrotic syndrome. In addition, any condition that predisposes to coagulation disorders causing a hypercoagulable state or hematologic disorders causing sludging can also predispose to venous thrombosis. Ultimately, however, many cases of venous infarction are categorized as idiopathic.
The patient with venous thrombosis may have a wide variety of symptoms, most of which are nonspecific, highlighting the essential role of the radiologist in making this diagnosis. The most common symptom is headache, which is seen in about 80% of cases (77,78,79,80,81). In addition, patients often present with other signs or symptoms of increased intracranial pressure, including papilledema, vomiting, and an altered level of consciousness (78,82,83,84). Patients may also develop focal or generalized seizures, likely owing to the common occurrence of acute hematoma. Focal deficits can develop and depend on the location of the thrombus, the degree of thrombosis, and the presence of hemorrhage. The most commonly involved sinus is the superior sagittal sinus, followed by the transverse sinus and then the straight sinus (78). Rarely, the cavernous sinus can be thrombosed as well. The time of onset of symptoms in the patient with venous thrombosis also can be quite variable, extending for days to weeks.
Treatment of Ischemic Stroke
Arterial Infarction
Brain imaging must be integrated into any treatment paradigm for stroke. Stroke treatment is undergoing rapid evolution, and the demands placed on stroke imaging for prognostic and even triage information may well change in the near future as acute stroke treatment continues to evolve. The treatment of stroke complications has been given greater import, and management of patients is often done in dedicated stroke units (81). The most important development has been the emphasis placed on managing the stroke patient as an acute emergency and using acute-phase therapies to improve outcome.
Currently, intravenous tissue plasminogen activator (tPA) administered in the first 3 hours after stroke is the only approved therapy for acute ischemic stroke (85,86,87,88). The approval of this therapy in the United States is based on a randomized study of intravenous tPA versus placebo administered within the first 3 hours after stroke (88). Subjects randomized to intravenous tPA had a 12% absolute increase in the rate of minimal or no disability when compared with those who received placebo. This study did have a higher rate of symptomatic hemorrhage in those patients treated with intravenous tPA (6%) versus those patients treated with placebo (0.6%). However, the benefit of intravenous tPA therapy outweighed the risk of hemorrhagic complication. The trial had strict inclusion and exclusion criteria and used CT to exclude patients with evidence of hemorrhage, arteriovenous malformation, tumor, or aneurysm. One additional trial evaluated the use of intravenous thrombolytic therapy in extended time windows of 3 to 4.5 hours compared to placebo (86). Intravenous tPA administered between 3 to 4.5 hours resulted in an improved neurologic outcome compared to placebo, although there was no difference in mortality between these two groups (86).
Endovascular therapy will likely have a more prominent role in the time window extending beyond 3 hours. The Prolyse in Acute Cerebral Thromboembolism (PROACT II) study (89) showed a benefit to intra-arterial thrombolytic therapy up to 6 hours after ischemic stroke onset. The trial randomized patients with middle cerebral artery (MCA) thromboembolic occlusion who could be treated within 6 hours after onset of symptoms to treatment with intra-arterial recombinant prourokinase versus placebo. The study found that significantly more patients receiving intra-arterial prourokinase had slight or no neurologic disability than patients receiving placebo. This study also relied on imaging supplied by CT to exclude patients with hemorrhage, significant mass effect with midline shift, or acute hypodensity in an area larger than one-third of the MCA territory.
Endovascular recanalization is also now being aided with mechanical thrombolysis devices. The U.S. Food and Drug Administration has approved multiple devices for removal of thrombus in patients with ischemic stroke (90,91,92,93). Initially a “corkscrew” device, the MERCI (Mechanical Embolus Removal in Cerebral Ishcemia) retriever, was used for endovascular thrombectomy (92,94). More recently, stentriever mechanical thrombectomy devices have been shown to provide improved recanalization and better clinical outcomes (90,91). Despite the improved recanalization achieved by stentriever devices, recent randomized clinical trials comparing endovascular stroke therapy with medical management have failed to demonstrate a benefit for endovascular therapy (95,96). These trials have been criticized because they used early-generation thrombectomy devices, had poor imaging selection of endovascularly treated patients, and long lag times in the initiation of endovascular therapy. Several ongoing randomized trials are underway at the time of this writing to establish if there is a benefit to endovascular therapy.
Venous Infarction
Anticoagulation therapy is the most widely used treatment for sinus thrombosis (97,98). In general, patients have a good functional recovery without neurologic sequelae in a significant percentage of cases, although major neurologic deficits and death can and do occur (77,79,99,100). A poor clinical outcome may be particularly true in patients with rapidly evolving symptoms and those who develop focal symptoms and coma (78,79,101). Poor outcome has also been associated with hemorrhage on the admission CT scan, older age, thrombosis of
deep venous system, concurrent infarction, or cancer (102). Patients who do not appear to be responding to anticoagulation therapy and those who have a more rapidly progressive course extending to coma are often managed more aggressively using direct thrombolytic or thrombectomy treatment (103,104,105). A recent multicenter retrospective study (106) compared mechanical thrombectomy to direct thrombolysis and found that there was no difference in the recanalization rates or outcomes between the two techniques after adjusting for differences in the baseline neurologic deficits between the two groups of patients. A randomized multicenter prospective trial (TO-ACT trial) has been started to compare endovascular thrombolysis and thrombectomy to conventional management with anticoagulation in venous sinus thrombosis patients with (107).
deep venous system, concurrent infarction, or cancer (102). Patients who do not appear to be responding to anticoagulation therapy and those who have a more rapidly progressive course extending to coma are often managed more aggressively using direct thrombolytic or thrombectomy treatment (103,104,105). A recent multicenter retrospective study (106) compared mechanical thrombectomy to direct thrombolysis and found that there was no difference in the recanalization rates or outcomes between the two techniques after adjusting for differences in the baseline neurologic deficits between the two groups of patients. A randomized multicenter prospective trial (TO-ACT trial) has been started to compare endovascular thrombolysis and thrombectomy to conventional management with anticoagulation in venous sinus thrombosis patients with (107).
TABLE 12.3 Time Course of Evolving Infarction on Computed Tomography | ||||||||||
|---|---|---|---|---|---|---|---|---|---|---|
|
MR Techniques in Infarction
Conventional Magnetic Resonance Imaging
Routine evaluation of the ischemic stroke patient (particularly in the subacute and chronic stages of infarction) typically includes some form of T1-weighted and T2-weighted spin-echo or fast spin-echo imaging and supplemental gradient-echo imaging for hemorrhage. T1-weighted imaging (repetition time, 400 to 600 ms; echo time, 20 to 35 ms) is commonly done to provide anatomic definition and detection of methemoglobin in subacute hemorrhage. T2-weighted imaging (repetition time, greater than 2,500 ms; echo time, 80 to 120 ms) is used to demonstrate sites of parenchymal injury, represented as regions of increased water content, and acute or remote hemorrhage. Fluid-attenuated inversion recovery (FLAIR) has generally replaced proton density–weighted imaging to augment the conventional (fast) spin-echo examination, particularly for areas of brain adjacent to the ventricles and the cortical sulci.
TABLE 12.4 Acute Infarction: Conventional Magnetic Resonance Findings | |||||||
|---|---|---|---|---|---|---|---|
|
The conventional imaging findings in evolving cerebral infarction are well characterized and follow a stereotypical temporal evolution similar in many ways to that seen on CT (Table 12.3). These changes seen in ischemic parenchyma rely on an increase in tissue water content, transient mass effect, and ultimately tissue loss. The acute changes are summarized in Table 12.4. This increased tissue water results in prolonged T1 and T2 relaxation times (108,109,110) and T2 signal changes, and are more sensitive to tissue water accumulation than T1-weighted images, but the T2 signal is still often normal in the first hours after infarction. Gradually during the acute stage, the T2-weighted image (Fig. 12.5) becomes more hyperintense in the ischemic region, particularly during the first 24 hours (111,112). At 24 hours, approximately 90% of patients who develop infarction show changes in the T2-weighted sequence as compared with approximately 50% on T1-weighted images (113,114). These signal changes seen in the first 24 hours are best appreciated in gray matter and are well visualized in deep gray matter structures such as the thalamus or basal ganglia in addition to cortical gray matter. Often, the white matter does not show appreciable change in this first 24-hour period. However, not infrequently, there is subcortical white matter hypointensity on T2-weighted images (Fig. 12.5A). This has
been ascribed to iron, free radicals (115), sludging of deoxygenated red blood cells, or even incidental magnetization transfer effects. Dynamic susceptibility contrast–enhanced imaging has been used to show susceptibility changes in the ischemic hemisphere of stroke patients, and this has been suggested to correlate with hemoglobin deoxygenation seen in misery perfusion (116). It should be noted that this marked hypointensity in acute cortical infarction is located within the subcortical white matter and therefore is most likely not due to hemorrhage, which characteristically is situated in the affected cortex (Fig. 12.6). Spin-echo images may also demonstrate thrombosis or slow flow seen as a loss of flow void in the arteries of the circle of Willis and arteries traversing the subarachnoid space within cortical sulci. This signal change in the arteries can be appreciated immediately after the thromboembolic event has started and may therefore precede any parenchymal water accumulation. Similarly, thrombotic occlusion can be seen using T2-weighted imaging, where the low signal of the thrombosed artery is often easily seen in the MCA or internal carotid artery (117,118).
been ascribed to iron, free radicals (115), sludging of deoxygenated red blood cells, or even incidental magnetization transfer effects. Dynamic susceptibility contrast–enhanced imaging has been used to show susceptibility changes in the ischemic hemisphere of stroke patients, and this has been suggested to correlate with hemoglobin deoxygenation seen in misery perfusion (116). It should be noted that this marked hypointensity in acute cortical infarction is located within the subcortical white matter and therefore is most likely not due to hemorrhage, which characteristically is situated in the affected cortex (Fig. 12.6). Spin-echo images may also demonstrate thrombosis or slow flow seen as a loss of flow void in the arteries of the circle of Willis and arteries traversing the subarachnoid space within cortical sulci. This signal change in the arteries can be appreciated immediately after the thromboembolic event has started and may therefore precede any parenchymal water accumulation. Similarly, thrombotic occlusion can be seen using T2-weighted imaging, where the low signal of the thrombosed artery is often easily seen in the MCA or internal carotid artery (117,118).
 FIGURE 12.5 A 70-year-old woman with sudden development of a left visual field deficit 3 days before magnetic resonance imaging (MRI). A: Axial T2-weighted MRI shows abnormal hyperintensity in the right occipital lobe (arrowhead) consistent with recent infarction. Note the subcortical white matter hypointensity. B: Axial T1-weighted image after contrast shows meningeal (arrowhead) and intravascular (arrow) enhancement in the area of the right occipital lobe infarction. C: Follow-up MR study 17 days after the onset of symptoms shows the development of parenchymal enhancement (arrow). Parenchymal enhancement generally begins toward the end of the first week and persists for approximately 8 weeks in thromboembolic infarction. |
 FIGURE 12.6 Cortical hemorrhage, gross specimen. Note the typical cortical location of the hemorrhage associated with embolic infarction. (Courtesy of H. Goldberg, MD, Philadelphia, PA.) |
Morphologic changes that coincide with the development of vasogenic edema come later and are seen with both CT and MR imaging. The increase in vasogenic edema results in brain swelling and can be particularly well appreciated in cortical regions as gyral swelling or sulcal effacement seen on both T1- and T2-weighted imaging (Fig. 12.5). This may be visualized in the first day but becomes more pronounced early after the infarction (greater than 24 to 48 hours). The T1 and T2 signal changes also become more pronounced in this period because the region of acute infarction becomes more clearly defined. If large areas of brain are affected, it is during this period (peaking at 3 to 4 days after infarction) that mass affect with herniation can manifest itself. Fast spin-echo imaging has largely replaced conventional spin-echo techniques. This technique is less sensitive to T2* variations due to the timing of multiple 180-degree pulses. Therefore, in fast spin-echo imaging, the detection of acute hemorrhage is reduced by virtue of lower sensitivity to magnetic susceptibility changes. It is important to supplement the MR evaluation of stroke patients with gradient-echo imaging, which is highly sensitive to susceptibility variations that accompany intraparenchymal hemorrhage (Figs. 12.7 and 12.8) (see Chapter 10).
Intravenous contrast was used more extensively in the past to help characterize cerebral infarction in the acute time period (119,120). Investigators described a pattern of progressive enhancement in which the enhancement of the arteries was seen acutely and persisted for the first 5 to 7 days after infarction (Fig. 12.5). During this period, parenchymal enhancement was absent or sparse. This early pattern was followed by a pattern of dense cortical contrast enhancement beginning at 5 to 7 days after the infarction (Fig. 12.9) (119). This paradigm of early arterial enhancement without significant early parenchymal enhancement was seen in most patients with a completed stroke, and it was believed to be due to arterial occlusion with
inadequate collateral circulation that prohibited contrast from reaching the site of infarction in the acute stages. A small group of patients demonstrated early cortical enhancement (seen within the first few days after the ischemic episode). This was postulated to be due to sufficient collateral inflow to deliver the contrast agent to the ischemic region, and it was suggested that this unusual pattern of early cortical enhancement suggested a more favorable clinical outcome (119). The use of contrast enhancement in the acute phase of cerebral infarction has largely been supplanted by the use of diffusion and perfusion imaging.
inadequate collateral circulation that prohibited contrast from reaching the site of infarction in the acute stages. A small group of patients demonstrated early cortical enhancement (seen within the first few days after the ischemic episode). This was postulated to be due to sufficient collateral inflow to deliver the contrast agent to the ischemic region, and it was suggested that this unusual pattern of early cortical enhancement suggested a more favorable clinical outcome (119). The use of contrast enhancement in the acute phase of cerebral infarction has largely been supplanted by the use of diffusion and perfusion imaging.
 FIGURE 12.7 Value of diffusion-weighted imaging in acute hemorrhage. Fluid-attenuated inversion recovery (A), T2-weighted fast spin echo (B), and gradient echo (C). Note that extensive hemorrhage is only visible on the gradient-echo images (computed tomography, not shown, showed no evidence of hemorrhage). Diffusion-weighted images (D) and apparent diffusion coefficient maps (E) show restricted diffusion posterior to the heterogeneous hemorrhagic part of the lesion, consistent with acute infarction. The purpose of diffusion techniques in the presence of known acute intracerebral hemorrhage is to investigate the nonhemorrhagic tissue adjacent to the hemorrhage, which in this case is clearly within a large-artery vascular distribution (middle cerebral artery, posterior division). |
 FIGURE 12.8 Hemorrhage in acute infarction, computed tomography (CT) versus magnetic resonance (MR). Despite no evidence of hemorrhage on either CT (A) or fluid-attenuated inversion recovery (B) in the right middle cerebral infarction, the gradient-echo image clearly shows extensive acute hemorrhage (C). The sensitivity of MR using gradient-echo imaging for acute hemorrhage may exceed that of CT, but it clearly depends on the precise techniques used. |
 FIGURE 12.9 Subacute infarction in the inferior left temporal lobe. Axial T1 postcontrast images (top row) demonstrates largely cortical enhancement within the area of infarction (arrows). Fluid-attenuated inversion recovery (middle row) and T2-weighted (bottom row) images demonstrate abnormal high signal corresponding to vasogenic edema in the area of infarction. |
 FIGURE 12.10 Subacute cortical middle cerebral artery infarction with contrast enhancement. A: T1-weighted images. B: T2-weighted images. C: Contrast-enhanced T1-weighted images. Abnormal signal in the cortex of the left posterior frontoparietal region extends into the white matter. Note the absence of mass effect. After intravenous contrast (C), classic gyriform (i.e. cortical) enhancement is seen in this same region. |
Although contrast is not used routinely in acute stroke evaluation, contrast enhancement on conventional MR images can play an important role in the diagnosis of subacute infarction and may be very helpful in the diagnosis in this entity. Gyral parenchymal enhancement in the subacute infarction (Fig. 12.5) typically begins toward the end of the first week, when mass effect has resolved, and persists for approximately 6 to 8 weeks. This discordance between enhancement and mass effect is an extremely useful radiologic sign because enhancing lesions with significant mass effect are unlikely to represent cerebral infarction (Fig. 12.9). A second important implication of this temporal evolution is that subacute infarction represents one of the lesions that demonstrate significant enhancement and no mass effect (Fig. 12.10). During the subacute time period, the relatively subtle T2 changes seen initially become obvious with marked hyperintensity on T2-weighted images. White matter abnormalities are also now more clearly seen. In approximately 20% of cases, there will be regions of increased signal on T1-weighted images indicating a hemorrhagic component.
The chronic stage of cerebral infarction is usually considered to begin when the integrity of the blood–brain barrier is restored, edema has resolved, and most of the resorption of necrotic tissue is complete. This takes longer with larger infarctions, but is usually accomplished by 6 weeks. The MR
of chronic infarctions is characterized by a smaller, better-defined zone of altered signal intensity than seen on earlier scans. There is a loss of cellular elements, and focal atrophy becomes apparent. This change is appreciated as a widening of sulci and ventricular enlargement. Contrast enhancement does not occur. The increased signal intensity is due to greater water content secondary to often frank cystic cavitation making up the bulk of the residual tissue, which is particularly seen in larger infarctions (Figs. 12.3 and 12.11). As time progresses, the lesions continue to shrink, with the atrophic changes becoming more obvious and the infarction itself less obvious. Rarely, in very small infarctions, the parenchymal lesion may become undetectable by MR, and only the atrophic changes indicate the previous insult. Secondary findings seen in the chronic phases of cerebral infarction can include morphologic and signal intensity changes seen in the areas remote from the infarct, which represent Wallerian degeneration (121,122) (Figs. 12.11 and 12.12). These changes, which can be appreciated in the descending corticospinal tract, include morphologic and signal intensity changes after a hemispheric infarct (Fig. 12.12). Diffusion tensor imaging has also been used to detect longitudinal changes due to Wallerian degeneration (123,124).
of chronic infarctions is characterized by a smaller, better-defined zone of altered signal intensity than seen on earlier scans. There is a loss of cellular elements, and focal atrophy becomes apparent. This change is appreciated as a widening of sulci and ventricular enlargement. Contrast enhancement does not occur. The increased signal intensity is due to greater water content secondary to often frank cystic cavitation making up the bulk of the residual tissue, which is particularly seen in larger infarctions (Figs. 12.3 and 12.11). As time progresses, the lesions continue to shrink, with the atrophic changes becoming more obvious and the infarction itself less obvious. Rarely, in very small infarctions, the parenchymal lesion may become undetectable by MR, and only the atrophic changes indicate the previous insult. Secondary findings seen in the chronic phases of cerebral infarction can include morphologic and signal intensity changes seen in the areas remote from the infarct, which represent Wallerian degeneration (121,122) (Figs. 12.11 and 12.12). These changes, which can be appreciated in the descending corticospinal tract, include morphologic and signal intensity changes after a hemispheric infarct (Fig. 12.12). Diffusion tensor imaging has also been used to detect longitudinal changes due to Wallerian degeneration (123,124).
 FIGURE 12.11 Chronic infarction, moyamoya. Old right basal ganglionic infarction is associated with ventricular dilation and ipsilateral Wallerian degeneration, shown by right cerebral peduncle atrophy with focal abnormality in the region of the corticospinal tract. Magnetic resonance angiography shows diminished flow in the narrowed right internal carotid and middle cerebral arteries. |
FLAIR Imaging
This sequence is often obtained in the evaluation of the patient with ischemic stroke to augment conventional T1- and T2-weighted imaging. FLAIR images null CSF signal based on the T1 signal of fluid and produce a strongly T2-weighted image. FLAIR has been particularly helpful in the evaluation of brain parenchyma immediately adjacent to CSF-filled spaces such as the ventricular compartment and cortical sulci and has proven to be more sensitive for the detection of infarction than T2-weighted imaging in the evaluation of strokes in these periventricular and cortical regions (125,126). In addition,
this technique has demonstrated improved lesion conspicuity over spin-echo imaging for infarctions in the brainstem (127), although some investigators have noted lesser sensitivity for brainstem lesions on FLAIR than on conventional T2-weighted MR. FLAIR images are markedly less sensitive than DWI in early infarction and should be thought of as a variant of conventional T2-weighted imaging (128). Beyond the hyperacute time period, in acute to subacute time periods (less than 10-day-old infarctions), the FLAIR sequence appears to show more infarctions than a technique such as T2-weighted fast spin-echo imaging (129). A specific limitation of FLAIR to keep in mind is the lack of specificity of hypointensity for acute hemorrhage, which on FLAIR alone can look identical to water-containing cystic regions.
this technique has demonstrated improved lesion conspicuity over spin-echo imaging for infarctions in the brainstem (127), although some investigators have noted lesser sensitivity for brainstem lesions on FLAIR than on conventional T2-weighted MR. FLAIR images are markedly less sensitive than DWI in early infarction and should be thought of as a variant of conventional T2-weighted imaging (128). Beyond the hyperacute time period, in acute to subacute time periods (less than 10-day-old infarctions), the FLAIR sequence appears to show more infarctions than a technique such as T2-weighted fast spin-echo imaging (129). A specific limitation of FLAIR to keep in mind is the lack of specificity of hypointensity for acute hemorrhage, which on FLAIR alone can look identical to water-containing cystic regions.
 FIGURE 12.12 Chronic right middle cerebral artery territory infarction. Chronic right temporal infarction demonstrates encephalomalacia (arrowheads) on T2-weighted (top row) and fluid-attenuated inversion recovery (bottom row) images. Abnormal high signal with associated volume loss in the right pons and right cerebral peduncle (arrows) is consistent with Wallerian degeneration secondary to the infarction. |
The FLAIR sequence is not able to detect infarctions in the hyperacute time period (within 3 to 4.5 hours after symptom onset) with a great deal of sensitivity (Figs. 12.13 and 12.14) (130,131,132). The absence of FLAIR hyperintense signal abnormality in the region of cerebral infarction within 3 to 4.5 hours may be useful in determining the age of infarction in patients with an unclear time of symptom onset (131,132,133,134,135). In theory, the absence of FLAIR hyperintense signal in the region of
stroke may be used as an imaging “clock” for the time of stroke onset, and such an imaging substitute in theory may be used to increase the number of patients who may be treated with intravenous thrombolysis. By contrast, more rapid development of FLAIR hyperintense signal abnormality within 3 to 4.5 hours after symptom onset may indicate a higher risk of intracranial hemorrhage after intravenous thrombolysis, which may be beneficial in guiding treatment (136,137).
stroke may be used as an imaging “clock” for the time of stroke onset, and such an imaging substitute in theory may be used to increase the number of patients who may be treated with intravenous thrombolysis. By contrast, more rapid development of FLAIR hyperintense signal abnormality within 3 to 4.5 hours after symptom onset may indicate a higher risk of intracranial hemorrhage after intravenous thrombolysis, which may be beneficial in guiding treatment (136,137).
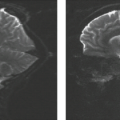
 FIGURE 12.13 Basilar artery thrombosis with acute pontine infarction. A: Sagittal T1-weighted images. B: Magnetic resonance angiogram. C: T2-weighted images. D: Fluid-attenuated inversion recovery (FLAIR) images. E: Diffusion-weighted images. Sagittal T1-weighted images (A) show abnormal signal in the location of the expected signal void of the basilar artery, ventral to the pons. Three-dimensional time-of-flight magnetic resonance angiography (B) shows absence of flow signal in the basilar and most of the posterior circulation. FLAIR (C) and T2-weighted (D) images confirm abnormal signal in the basilar artery. Note the otherwise normal brain parenchyma. Diffusion-weighted images (E) demonstrate the classic hemipontine lesion of acute infarction in the lower pons but bilateral acute infarction more superiorly. Acute infarctions in the pons characteristically extend all the way to the ventral surface, in contrast to demyelinating lesions. |
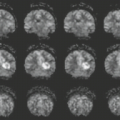
 FIGURE 12.14 Basilar artery occlusion with hyperacute pontine and superior cerebellar infarction. Abnormal hyperintense diffusion-weighted imaging (DWI) signal is present in the superior right cerebellum, pons, and left cerebral peduncle (first row); note the subtly of the DWI signal abnormality in the pons and left cerebral peduncle. These areas of hyperacute infarction are better appreciated as more conspicuous low signal on the apparent diffusion coefficient maps (middle row) and more conspicuous high signal on the exponential images (last row), which illustrates the utility of these sequences in the evaluation of hyperacute stroke. |
The FLAIR technique can also show occluded vessels or vessels with reduced blood flow as hyperintense, which are thereby seen in high contrast to the surrounding hypointense CSF where the signal has been nulled (128). This FLAIR vascular hyperintensity has been exploited an imaging proxy for ischemic but viable tissue (penumbra) when this FLAIR abnormality extends beyond cortical DWI hyperintensity (138).
Diffusion-Weighted Imaging
The development of MR techniques capable of imaging hyperacute ischemic changes at the parenchymal level such as DWI and perfusion-weighted imaging (PWI) were largely due to the development of high-speed T2- and T2*-sensitive techniques
that map apparent changes in proton motion and cerebral perfusion patterns. These high-speed methods are crucial in reducing motion artifacts, in imaging rapid time-resolved hemodynamic changes, and in maximizing diffusion-modulated T2 and magnetic susceptibility–modulated T2 tissue contrast. The development of stronger MR gradients capable of generating gradients well above 2 G/cm enabled the use of echo planar imaging, which can acquire a single-shot image. Parallel imaging methods and higher–field-strength systems, have further improved the image quality of DWI.
that map apparent changes in proton motion and cerebral perfusion patterns. These high-speed methods are crucial in reducing motion artifacts, in imaging rapid time-resolved hemodynamic changes, and in maximizing diffusion-modulated T2 and magnetic susceptibility–modulated T2 tissue contrast. The development of stronger MR gradients capable of generating gradients well above 2 G/cm enabled the use of echo planar imaging, which can acquire a single-shot image. Parallel imaging methods and higher–field-strength systems, have further improved the image quality of DWI.
DWI has revolutionized the evaluation of early stroke patients due to its high sensitivity to otherwise occult infarction and its high specificity for infarction (Fig. 12.14), and it has become a routine imaging sequence in all stroke patients. It uses a technique for mapping of proton contrast reflecting the microvascular water environment. DWI is sensitive to translational movement, or diffusion, of water over short distances. During typical periods of observation (40 ms), these distances are on the order of 5 to 20 μm (139). Stejskal and Tanner (140) initially used pulsed gradients to make in vitro diffusion measurements. Le Bihan et al. (141) first performed DWI to evaluate normal and abnormal cerebral tissues. The method uses a pair of gradient pulses placed symmetrically around the 180-degree refocusing pulse in a spin-echo sequence (139,140,141,142). Typically, a T2-weighted sequence is used. Static protons dephase and rephase completely, appearing as they would if the symmetric gradient pulses had not occurred. Moving protons acquire a phase change, resulting in a signal loss (or darker image) on the diffusion-weighted image. The image obtained is responsive to more rapid capillary-based perfusion using lower gradient strengths and to slower diffusional motion using higher gradient strengths (141,142).
Alteration in the time and amplitude of the gradient pulse (the b value) alters the sensitivity of the image to the diffusion, and multiple measurements allow for calculation of a diffusion coefficient. In vivo DWI is also subject to signal alteration from gross patient motion, tissue vibration, and cardiac-related motions, and so the term apparent diffusion coefficient (ADC) has been coined to account for these motions. Water diffusion occurs more rapidly parallel to white matter tracts. Therefore, the direction of the tensor (axial, sagittal, or coronal) needs to be specified. Often, the trace or average of the diffusion tensor in the orthogonal planes is used (143). Generally, the diffusion-weighted image and the ADC image are read together and can be compared with conventional images used in the protocol. The added value of the ADC image is found in the case of hyperintensity on DWI, which could be due to either restricted diffusion or T2 change (or both). It is in these cases, which occasionally represent simply high signal due to T2 contrast on DWI, that ADC maps should be inspected because ADC maps demonstrate contrast based purely on diffusion differences. On the other hand, if no hyperintensity is seen on DWI, then there is no acute infarction and no need for ADC maps because ADC maps alone have very low sensitivity and accuracy for acute infarction (144). Nonacute infarctions show no hyperintensity on DWI in the vast majority of cases, despite prolongation of T2 in the infarcted region (Fig. 12.9). Moreover, in certain cases, the additive contrast provided by T2 changes improves conspicuity of acute infarction on DWI as compared with ADC maps (Fig. 12.15), although these are typically beyond the time frame of treatable lesions.
In experimental models of ischemia, DWI is highly sensitive to slowing water proton translations very early in the ischemic episode (within minutes) (111,145,146,147). ADC decreases 30% to 60%, reaching a maximum decrease at about 24 hours (111,145,146,147). In permanent occlusion, ADC decreases have been shown to be highly correlated with the areas of infarction (147,148,149).
Models of both ischemically and nonischemically induced edema show that cytotoxic edema and not vasogenic edema is responsible for the decline in diffusion seen during ischemia (150,151). The cytotoxic edema itself has been implicated (111,145,152,153), as has a decrease in the extracellular space volume of water (154). Partial ischemia experiments have shown that the DWI does not change until cerebral blood flow drops below 15 to 20 mL/100 g/min (155). The ADC decrease has been observed after near-total occlusion and is not readily observed in partially reduced flow states (149). This finding implies that when collateral blood flow is sufficient to prevent the breakdown of cellular metabolism, a drop in ADC is not seen. It has been shown that when the Na+/K+ pump is disabled by intraparenchymal ouabain, the ADC decreases (156), supporting a link between altered ion homeostasis and alteration in ADC.
 FIGURE 12.15 Acute lacunar infarction, comparison of imaging techniques. A: Diffusion-weighted imaging (DWI). B: Apparent diffusion coefficient (ADC) map. C: Exponential. D: Noncontrast head CT. E: T2. F: Fluid-attenuated inversion recovery (FLAIR). Focal infarction in the left internal capsule (arrows) is high intensity on T2-weighted (E) and FLAIR (F) images. Diffusion-weighted image (A) and exponential map (C) shows marked hyperintensity. The ADC map (B) confirms the restriction of diffusion, seen as low intensity. Note that increased conspicuity of the lesion on the diffusion-weighted image (A) compared with the ADC map (B) is partly due to T2-based contrast of the lesion, which combine with ADC change on the diffusion-weighted image. The area of infarction is subtly seen as focal hypodensity on non-contrast head CT (D). |
Perfusion-Weighted Imaging
Brain perfusion imaging can be performed using a susceptibility-based contrast agent or an arterial spin labeling (ASL) technique. Perfusion imaging using a paramagnetic contrast agent is more widely used. Images are obtained after a bolus injection of a contrast agent that creates a detectable change in image intensity as it passes through the capillary beds. Magnetic susceptibility contrast agents such as dysprosium diethylene triamine penta-acetic acid (DTPA)-bis(methylamide) or gadolinium-DTPA induce a T2* shortening and produce a signal loss in perfused tissue (Fig. 12.16) (157,158). These agents
remain in the intravascular space when the blood–brain barrier is intact, inducing a local magnetic field gradient in the capillary bed (98). A transient signal loss is observed as the agent moves into and out of the tissue. These changes in T2* signal intensity can be used to construct a concentration–time curve, and regional cerebral blood volume maps can be calculated (159). Regional cerebral blood flow and relative mean transit time can also be calculated (145). However, the regional cerebral blood flow cannot be accurately calculated unless the concentration profile of the tissue’s arterial supply is known (160,161). One or more of these hemodynamic maps can then be displayed along with other imaging sequences.
remain in the intravascular space when the blood–brain barrier is intact, inducing a local magnetic field gradient in the capillary bed (98). A transient signal loss is observed as the agent moves into and out of the tissue. These changes in T2* signal intensity can be used to construct a concentration–time curve, and regional cerebral blood volume maps can be calculated (159). Regional cerebral blood flow and relative mean transit time can also be calculated (145). However, the regional cerebral blood flow cannot be accurately calculated unless the concentration profile of the tissue’s arterial supply is known (160,161). One or more of these hemodynamic maps can then be displayed along with other imaging sequences.
 FIGURE 12.16 Changing signal intensity over time in contrast agent bolus tracking. Gadolinium passing through the capillary bed results in decreased T2 relaxation time, seen as a drop in signal intensity that then returns to normal as the contrast passes out of the capillary bed. Compare the plot of signal intensity change for normal tissue versus ischemic tissue (from two regions of interest obtained in the same patient undergoing an infarction). The normal tissue demonstrates an earlier decline in signal intensity and a greater overall decrease in signal intensity than the ischemic region. |
In addition to the injection of contrast agents, blood flow imaging can be performed by magnetically labeling water protons. This ASL technique provides a completely noninvasive method for perfusion imaging using tissue water and endogenous contrast agent. The technique has been described using an inversion pulse to label or tag inflowing protons with subtraction of tagged and untagged images (162). Spin tagging methods are more readily quantifiable, avoid the cost and small risk of contrast agents, and have the advantage of being repeatable without limitation. Furthermore, vessel-specific ASL may be performed, which may offer insights into the perfusion of selective vascular beds (163,164,165,166).
In recent years, there has been widespread adoption of PWI in acute stroke imaging. Ischemic and infarcted cerebral tissue will demonstrate reduced cerebral blood flow, reduced cerebral blood volume, and increased mean transit time of blood through the affected vascular territory. Bolus tracking measurement of dysprosium-DTPA-bis(methylamide) in animal models of MCA occlusion has shown a 50% to 60% reduction in T2 signal intensity in areas of decreased perfusion (111,145).
The precise PWI parameters used to triage stroke patients for endovascular reperfusion therapy remain under investigation. Studies have used various hemodynamic maps including cerebral blood flow (CBF), cerebral blood volume (CBV), and time-to-maximum (Tmax) (Fig. 12.17). Many studies have reported the Tmax, which measures the time to maximum signal change after contrast agent injection or blood labeling, to be a useful parameter in the selection of endovascular reperfusion candidates (167,168,169,170). There is evidence that a Tmax threshold of 6 seconds or greater best represents critically hypoperfused tissue, and that cerebral tissue with a Tmax greater than 6 seconds should be considered the penumbra (168,169). However, Tmax calculation is complex and reflects delayed cerebral perfusion, blood dispersion, and mean transit time, so careful assessment of other PWI and MR sequences is necessary to avoid misinterpretation (168).
Other studies have investigated ASL as a measurement of cerebral perfusion in the setting of acute ischemic stroke. Regions of cerebral infarction, as identified by DWI hyperintense signal, demonstrate decreased CBF using the ASL technique (Fig. 12.18) (171). By contrast, cerebral tissue surrounding the area of infarction demonstrates increased CBF, which likely reflects hyperemia and collateral arterial flow toward the area of infarction (171).
Related posts:
Stay updated, free articles. Join our Telegram channel

Full access? Get Clinical Tree


